#Data Quality
Explore tagged Tumblr posts
Visit Tumblr Blog
Explore Tumblr blogs with no restrictions, modern design and the best experience.
Last Seen Tumblr Blogs


Fun Fact
Tumblr has a low social media market share in South America.
Text
Palantir freaks me out, and I have some thoughts...
Look, I have no actual plan here. Nothing concrete, anyway. But, I've just been thinking a lot about data collection lately. As someone who works with data professionally -- and specifically has a background in data quality -- I wanted to talk about different factors that make using data very difficult.
We have a saying in the data world: "Garbage in, garbage out." What that means is that you can have the nicest programs, the shiniest dashboards, and the smartest analysts, but if the data you're working with is inconsistent, incorrect, or missing, your conclusions cannot be counted on. We ran into this a lot at my last job; people would blame this one particular program that sat on top of a specific database for all the company's ills because, when we first started using it, our data quality was very poor. It took years of consistent data quality efforts and data clean-up to regain the trust of most of the company, and some people still distrusted the data in that database despite proof that it was actually a very good source by the end.
Think about it: you can run the most advanced analysis on a robust dataset, but if a quarter of the data is wrong, what good is the analysis?
So, here are a list of factors that I personally found the most frustrating to deal with as a data quality analyst, from least to most disruptive:
Missing data. Missing data is annoying, and in some cases, it can halt a project in its tracks. However, missing data can often be found, especially if it's something that was stored elsewhere -- like in state records or the like. It's also easier to recognize a problem if a field is empty -- searching for a "null" value is super simple.
Corrupt/consistently incorrect data. This is annoying, but it's something that a program or person can pick up on pretty quickly. For instance, I once found a crop of records for which the state IDs were all in the same way. I'm pretty sure what happened is someone dumped the IDs in Excel and some leading zeroes got deleted and zeroes were filled in at the end of the ID to make up for the missing numerals. It was kind of crazy that I even found these, but once I did, I quickly noticed the pattern and was able to fix them pretty easily because they were all wrong in the same way. Similarly, we received a bunch of records in an acquisition that had a value of "0" in one particular column for most wells. The "0" was meaningless, so we quickly deleted it.
Obviously incorrect data. Depending on the company, there may be measures put in place to catch data that is obviously outside the bounds of reality. Whether it be locations that don't exist or a part size that's far too large or small for the job being done, this sort of bad data can be found and deleted or excluded somewhat easily as long as parameters are established for the affect data points.
Plausible-yet-incorrect data. This is the absolute worst. Unless there is a ton of other data supporting or disproving the data point, finding and correcting it involves a lot more work -- and is sometimes impossible if the data is inconsistent across systems. Depending on the data point, AI/machine learning programs may not be able to detect that there's a problem, because all they're trained to do is recognize patterns, and if the piece of data isn't obviously incorrect or outside the bounds of possibility, it might go undetected. Too much plausible-yet-incorrect data in one dataset makes that dataset essentially useless, because who even knows what's true or not?
I'm not sure where to go with this. But it's just something I've been thinking about a lot lately.
2 notes
·
View notes
Text
How Large Language Models (LLMs) are Transforming Data Cleaning in 2024
Data is the new oil, and just like crude oil, it needs refining before it can be utilized effectively. Data cleaning, a crucial part of data preprocessing, is one of the most time-consuming and tedious tasks in data analytics. With the advent of Artificial Intelligence, particularly Large Language Models (LLMs), the landscape of data cleaning has started to shift dramatically. This blog delves into how LLMs are revolutionizing data cleaning in 2024 and what this means for businesses and data scientists.
The Growing Importance of Data Cleaning
Data cleaning involves identifying and rectifying errors, missing values, outliers, duplicates, and inconsistencies within datasets to ensure that data is accurate and usable. This step can take up to 80% of a data scientist's time. Inaccurate data can lead to flawed analysis, costing businesses both time and money. Hence, automating the data cleaning process without compromising data quality is essential. This is where LLMs come into play.
What are Large Language Models (LLMs)?
LLMs, like OpenAI's GPT-4 and Google's BERT, are deep learning models that have been trained on vast amounts of text data. These models are capable of understanding and generating human-like text, answering complex queries, and even writing code. With millions (sometimes billions) of parameters, LLMs can capture context, semantics, and nuances from data, making them ideal candidates for tasks beyond text generation—such as data cleaning.
To see how LLMs are also transforming other domains, like Business Intelligence (BI) and Analytics, check out our blog How LLMs are Transforming Business Intelligence (BI) and Analytics.

Traditional Data Cleaning Methods vs. LLM-Driven Approaches
Traditionally, data cleaning has relied heavily on rule-based systems and manual intervention. Common methods include:
Handling missing values: Methods like mean imputation or simply removing rows with missing data are used.
Detecting outliers: Outliers are identified using statistical methods, such as standard deviation or the Interquartile Range (IQR).
Deduplication: Exact or fuzzy matching algorithms identify and remove duplicates in datasets.
However, these traditional approaches come with significant limitations. For instance, rule-based systems often fail when dealing with unstructured data or context-specific errors. They also require constant updates to account for new data patterns.
LLM-driven approaches offer a more dynamic, context-aware solution to these problems.

How LLMs are Transforming Data Cleaning
1. Understanding Contextual Data Anomalies
LLMs excel in natural language understanding, which allows them to detect context-specific anomalies that rule-based systems might overlook. For example, an LLM can be trained to recognize that “N/A” in a field might mean "Not Available" in some contexts and "Not Applicable" in others. This contextual awareness ensures that data anomalies are corrected more accurately.
2. Data Imputation Using Natural Language Understanding
Missing data is one of the most common issues in data cleaning. LLMs, thanks to their vast training on text data, can fill in missing data points intelligently. For example, if a dataset contains customer reviews with missing ratings, an LLM could predict the likely rating based on the review's sentiment and content.
A recent study conducted by researchers at MIT (2023) demonstrated that LLMs could improve imputation accuracy by up to 30% compared to traditional statistical methods. These models were trained to understand patterns in missing data and generate contextually accurate predictions, which proved to be especially useful in cases where human oversight was traditionally required.
3. Automating Deduplication and Data Normalization
LLMs can handle text-based duplication much more effectively than traditional fuzzy matching algorithms. Since these models understand the nuances of language, they can identify duplicate entries even when the text is not an exact match. For example, consider two entries: "Apple Inc." and "Apple Incorporated." Traditional algorithms might not catch this as a duplicate, but an LLM can easily detect that both refer to the same entity.
Similarly, data normalization—ensuring that data is formatted uniformly across a dataset—can be automated with LLMs. These models can normalize everything from addresses to company names based on their understanding of common patterns and formats.
4. Handling Unstructured Data
One of the greatest strengths of LLMs is their ability to work with unstructured data, which is often neglected in traditional data cleaning processes. While rule-based systems struggle to clean unstructured text, such as customer feedback or social media comments, LLMs excel in this domain. For instance, they can classify, summarize, and extract insights from large volumes of unstructured text, converting it into a more analyzable format.
For businesses dealing with social media data, LLMs can be used to clean and organize comments by detecting sentiment, identifying spam or irrelevant information, and removing outliers from the dataset. This is an area where LLMs offer significant advantages over traditional data cleaning methods.
For those interested in leveraging both LLMs and DevOps for data cleaning, see our blog Leveraging LLMs and DevOps for Effective Data Cleaning: A Modern Approach.

Real-World Applications
1. Healthcare Sector
Data quality in healthcare is critical for effective treatment, patient safety, and research. LLMs have proven useful in cleaning messy medical data such as patient records, diagnostic reports, and treatment plans. For example, the use of LLMs has enabled hospitals to automate the cleaning of Electronic Health Records (EHRs) by understanding the medical context of missing or inconsistent information.
2. Financial Services
Financial institutions deal with massive datasets, ranging from customer transactions to market data. In the past, cleaning this data required extensive manual work and rule-based algorithms that often missed nuances. LLMs can assist in identifying fraudulent transactions, cleaning duplicate financial records, and even predicting market movements by analyzing unstructured market reports or news articles.
3. E-commerce
In e-commerce, product listings often contain inconsistent data due to manual entry or differing data formats across platforms. LLMs are helping e-commerce giants like Amazon clean and standardize product data more efficiently by detecting duplicates and filling in missing information based on customer reviews or product descriptions.

Challenges and Limitations
While LLMs have shown significant potential in data cleaning, they are not without challenges.
Training Data Quality: The effectiveness of an LLM depends on the quality of the data it was trained on. Poorly trained models might perpetuate errors in data cleaning.
Resource-Intensive: LLMs require substantial computational resources to function, which can be a limitation for small to medium-sized enterprises.
Data Privacy: Since LLMs are often cloud-based, using them to clean sensitive datasets, such as financial or healthcare data, raises concerns about data privacy and security.

The Future of Data Cleaning with LLMs
The advancements in LLMs represent a paradigm shift in how data cleaning will be conducted moving forward. As these models become more efficient and accessible, businesses will increasingly rely on them to automate data preprocessing tasks. We can expect further improvements in imputation techniques, anomaly detection, and the handling of unstructured data, all driven by the power of LLMs.
By integrating LLMs into data pipelines, organizations can not only save time but also improve the accuracy and reliability of their data, resulting in more informed decision-making and enhanced business outcomes. As we move further into 2024, the role of LLMs in data cleaning is set to expand, making this an exciting space to watch.
Large Language Models are poised to revolutionize the field of data cleaning by automating and enhancing key processes. Their ability to understand context, handle unstructured data, and perform intelligent imputation offers a glimpse into the future of data preprocessing. While challenges remain, the potential benefits of LLMs in transforming data cleaning processes are undeniable, and businesses that harness this technology are likely to gain a competitive edge in the era of big data.
#Artificial Intelligence#Machine Learning#Data Preprocessing#Data Quality#Natural Language Processing#Business Intelligence#Data Analytics#automation#datascience#datacleaning#large language model#ai
2 notes
·
View notes
Text
Data Modelling Master Class-Series | Introduction -Topic 1
https://youtu.be/L1x_BM9wWdQ
#theDataChannel @thedatachannel @datamodelling
#data modeling#data#data architecture#data analytics#data quality#enterprise data management#enterprise data warehouse#the Data Channel#data design#data architect#entity relationship#ERDs#physical data model#logical data model#data governance
2 notes
·
View notes
Text
“To sum up, just because someone put a lot of work into gathering data and making a nice color-coded chart, doesn’t mean the data is GOOD or VALUABLE.”
^^^^^^^ this!! A massive pet peeve of mine is that people assume just because “analysis” has been done on data that it’s valid. But you can do analysis on junk data and still turn out a pretty picture! Your analysis is only as good as the data and assumptions you have made.
If something looks hinky, investigate it further. Maybe it’s nothing, but maybe the assumptions underlying the data are wrong, or the type of analysis someone has done is wrong.
AO3 Ship Stats: Year In Bad Data
You may have seen this AO3 Year In Review.
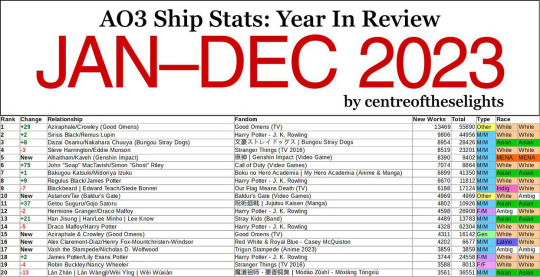
It hasn’t crossed my tumblr dash but it sure is circulating on twitter with 3.5M views, 10K likes, 17K retweets and counting. Normally this would be great! I love data and charts and comparisons!
Except this data is GARBAGE and belongs in the TRASH.
I first noticed something fishy when I realized that Steve/Bucky – the 5th largest ship on AO3 by total fic count – wasn’t on this Top 100 list anywhere. I know Marvel’s popularity has fallen in recent years, but not that much. Especially considering some of the other ships that made it on the list. You mean to tell me a femslash HP ship (Mary MacDonald/Lily Potter) in which one half of the pairing was so minor I had to look up her name because she was only mentioned once in a single flashback scene beat fandom juggernaut Stucky? I call bullshit.
Now obviously jumping to conclusions based on gut instinct alone is horrible practice... but it is a good place to start. So let’s look at the actual numbers and discover why this entire dataset sits on a throne of lies.
Here are the results of filtering the Steve/Bucky tag for all works created between Jan 1, 2023 and Dec 31, 2023:

Not only would that place Steve/Bucky at #23 on this list, if the other counts are correct (hint: they're not), it’s also well above the 1520-new-work cutoff of the #100 spot. So how the fuck is it not on the list? Let’s check out the author’s FAQ to see if there’s some important factor we’re missing.
The first thing you’ll probably notice in the FAQ is that the data is being scraped from publicly available works. That means anything privated and only accessible to logged-in users isn’t counted. This is Sin #1. Already the data is inaccurate because we’re not actually counting all of the published fics, but the bots needed to do data collection on this scale can't easily scrape privated fics so I kinda get it. We’ll roll with this for now and see if it at least makes the numbers make more sense:

Nope. Logging out only reduced the total by a couple hundred. Even if one were to choose the most restrictive possible definition of "new works" and filter out all crossovers and incomplete fics, Steve/Bucky would still have a yearly total of 2,305. Yet the list claims their total is somewhere below 1,500? What the fuck is going on here?
Let’s look at another ship for comparison. This time one that’s very recent and popular enough to make it on the list so we have an actual reference value for comparison: Nick/Charlie (Heartstopper). According to the list, this ship sits at #34 this year with a total of 2630 new works. But what’s AO3 say?

Off by a hundred or so but the values are much closer at least!
If we dig further into the FAQ though we discover Sin #2 (and the most egregious): the counting method. The yearly fic counts are NOT determined by filtering for a certain time period, they’re determined by simply taking a snapshot of the total number of fics in a ship tag at the end of the year and subtracting the previous end-of-year total. For example, if you check a ship tag on Jan 1, 2023 and it has 10,000 fics and check it again on Jan 1, 2024 and it now has 12,000 fics, the difference (2,000) would be the number of "new works" on this chart.
At first glance this subtraction method might seem like a perfectly valid way to count fics, and it’s certainly the easiest way, but it can and did have major consequences to the point of making the entire dataset functionally meaningless. Why? If any older works are deleted or privated, every single one of those will be subtracted from the current year fic count. And to make the problem even worse, beginning at the end of last year there was a big scare about AI scraping fics from AO3, which caused hundreds, if not thousands, of users to lock down their fics or delete them.
The magnitude of this fuck up may not be immediately obvious so let’s look at an example to see how this works in practice.
Say we have two ships. Ship A is more than a decade old with a large fanbase. Ship B is only a couple years old but gaining traction. On Jan 1, 2023, Ship A had a catalog of 50,000 fics and ship B had 5,000. Both ships have 3,000 new works published in 2023. However, 4% of the older works in each fandom were either privated or deleted during that same time (this percentage is was just chosen to make the math easy but it’s close to reality).
Ship A: 50,000 x 4% = 2,000 removed works Ship B: 5,000 x 4% = 200 removed works
Ship A: 3,000 - 2,000 = 1,000 "new" works Ship B: 3,000 - 200 = 2,800 "new" works
This gives Ship A a net gain of 1,000 and Ship B a net gain of 2,800 despite both fandoms producing the exact same number of new works that year. And neither one of these reported counts are the actual new works count (3,000). THIS explains the drastic difference in ranking between a ship like Steve/Bucky and Nick/Charlie.
How is this a useful measure of anything? You can't draw any conclusions about the current size and popularity of a fandom based on this data.
With this system, not only is the reported "new works" count incorrect, the older, larger fandom will always be punished and it’s count disproportionately reduced simply for the sin of being an older, larger fandom. This example doesn’t even take into account that people are going to be way more likely to delete an old fic they're no longer proud of in a fandom they no longer care about than a fic that was just written, so the deletion percentage for the older fandom should theoretically be even larger in comparison.
And if that wasn't bad enough, the author of this "study" KNEW the data was tainted and chose to present it as meaningful anyway. You will only find this if you click through to the FAQ and read about the author’s methodology, something 99.99% of people will NOT do (and even those who do may not understand the true significance of this problem):
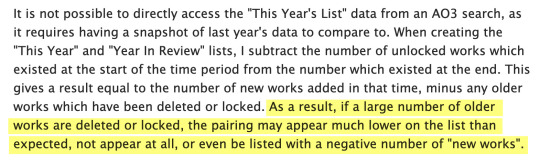

The author may try to argue their post states that the tags "which had the greatest gain in total public fanworks” are shown on the chart, which makes it not a lie, but a error on the viewer’s part in not interpreting their data correctly. This is bullshit. Their chart CLEARLY titles the fic count column “New Works” which it explicitly is NOT, by their own admission! It should be titled “Net Gain in Works” or something similar.
Even if it were correctly titled though, the general public would not understand the difference, would interpret the numbers as new works anyway (because net gain is functionally meaningless as we've just discovered), and would base conclusions on their incorrect assumptions. There’s no getting around that… other than doing the counts correctly in the first place. This would be a much larger task but I strongly believe you shouldn’t take on a project like this if you can’t do it right.
To sum up, just because someone put a lot of work into gathering data and making a nice color-coded chart, doesn’t mean the data is GOOD or VALUABLE.
#ao3#ao3 stats#data quality#also a reason I hate the use of big data techniques#it’s very easy to just run junk data through it til you find something#doesn’t mean the something is useful#data should be considered in CONTEXT
4K notes
·
View notes
Text
What is data quality?
Data quality is about how well data meets certain standards like accuracy, completeness, consistency, timeliness, and relevance. In the context of data analytics, it helps determine whether the data is good enough to be used for analysis, reporting, or decision-making.
Data issues such as missing values, duplicates, or outdated information can lead to wrong conclusions and poor business decisions. Fixing these issues is important for keeping operations smooth and reducing risks.
The need for high-quality data will only increase as more companies use automation and AI. If a system receives poor-quality data, its output will be untrustworthy.
To manage this, businesses use tools and processes that check for errors, clean up records, and track the quality of data over time. These steps help make sure the data stays useful and trustworthy.
In simple terms, good data quality allows teams to work faster, avoid mistakes, and build strategies based on facts instead of assumptions.
Data Quality vs. Data Integrity
While data quality and data integrity are closely related, they refer to different aspects of data management. Understanding the difference is important for building a strong data foundation.
Data quality refers to how accurate, complete, consistent, and up-to-date the data is. It answers questions like: Is the data correct? Is anything missing? Can it be trusted for reporting and decision-making?
Data integrity It ensures that data stays reliable and secure throughout its entire journey unchanged, correctly linked, and safe from unauthorized use or corruption.
Key Difference:
Data quality shows whether the data is good enough to support decisions and actions.
Data integrity means keeping data accurate and secure over time.
Both are essential. High data quality allows teams to use the data effectively, while strong data integrity ensures that the data remains safe and dependable throughout its use.
Why is Data Quality is Important?
Data quality matters because every business decision, report, or automated process depends on having reliable information. When data is accurate and well-managed, it becomes a strong foundation for daily operations, strategy, and long-term growth.
Poor-quality data can lead to costly mistakes. For example, if a business runs a marketing campaign with incorrect customer information, it wastes time and money and may lose customer trust. Inaccurate financial information may lead to problems with compliance or reporting. Even small problems, like missing values or duplicate records, can lead to confusion or delays.
Good data quality allows teams to make decisions with confidence. It supports better forecasting, helps improve customer experiences, and makes systems like automation and AI work more effectively. In short, clean data reduces risk and increases efficiency.
As businesses collect more data from different sources, maintaining quality becomes even more important. Without proper checks, data problems can quickly grow and impact performance across departments.
Strong data quality is not just helpful, it is essential for using data in a way that brings real value.
0 notes
Text

Data Problems Are Costing You More Than You Realize — Time to Take Control
In today’s digital landscape, data is the engine behind every decision. But when that data is messy, unreliable, or incomplete, it stops being an asset—and starts becoming a liability.
Studies reveal that analysts spend up to 80% of their time just cleaning and preparing data, leaving only 12 minutes out of every hour for actual analysis and insights.
This isn’t just a productivity issue—it’s a serious threat to how fast and how well your organization can operate.
🔹 Every error, duplicate, or inconsistency adds risk 🔹 Every manual correction slows down your team and wastes money 🔹 Every delayed report could mean a missed opportunity
Poor data quality leads to flawed insights, delayed decisions, and lost momentum.
So, how do you move forward?
That’s where PiLog’s Data Quality & Governance Suite comes in.
This solution is designed to tackle the root causes of data chaos—so you can finally trust the information driving your business.
With PiLog, you can:
✅ Automatically clean and validate your data for better accuracy ✅ Streamline data flows and reduce decision-making delays ✅ Align and unify master data across all systems and departments ✅ Apply governance and compliance with ease ✅ Catch and fix errors before they turn into bigger problems ✅ Feed your AI and BI tools with high-quality, reliable data
Good decisions start with good data.Let PiLog help you unlock the power of clean, trusted, and well-governed data.
0 notes
Text

Data quality isn’t just a checkbox—it’s the backbone of smart data-driven decision-making. Clean, consistent, and reliable data fuels trust, boosts efficiency, and drives impact. Because when data speaks the truth, your insights lead the way. This read targets strategic challenges, and possible solutions to resolve data quality issues.
Build Robust Data Quality Now https://bit.ly/3Zn0OUh
0 notes
Text
How Company Culture Fuels Data Quality Tool Adoption
So you’ve decided to invest in a data quality tool! But simply purchasing the software isn’t enough. The real magic happens when a strong data quality culture permeates your organization. Without it, even the most sophisticated tools will fall flat. So, what role does company culture actually play? Let’s dive in. Culture: The Foundation of Data Quality SuccessCultural Elements Driving Tool…
0 notes
Text
Quality Assurance in SAP Data Migrations
The SAP migration run is usually repeated several times to improve data quality and eliminate errors. Usually, a SAP system copy is created before the data migration so that the system can be reset to this state at any time. This allows iterative improvement processes in which data migrations can be repeated multiple times. Simulating the data migration also helps to identify deficiencies in advance and correct them. During the migration, all logical and semantical checks are performed analogously to manual input (no migration at the table level). Check out the core magazine to learn more:
https://s4-experts.com/2024/01/16/sap-s-4hana-datenmigration-nicht-ohne-qualitatssicherung/
#SAP #Migration #DataQuality #qualityassurance

0 notes
Text
❓ Question:
At admission, Mrs. Smith's date of birth is recorded as 3/25/1948. An audit of the EHR discovers that the numbers in the date of birth are transposed in reports. This situation reflects a problem in:
A. Data comprehensiveness B. Data consistency C. Data currency D. Data granularity

✅ Correct Answer: B. Data consistency
💡 Rationale:
Data consistency means that the same data is represented the same way across all systems and reports.
In this case, the DOB is entered correctly in one place (e.g., admission) but transposed in another (e.g., reports), showing an inconsistency in how that data is stored or retrieved.
Ensuring uniformity across different parts of the EHR is key to maintaining consistency.
#RHIT#RHIT exam#data quality#HIM#health information#studyblr#AHIMA#medical records#AcornHIM#RHIT question of the day
0 notes
Text
0 notes
Text
If taxonomy alignment is so important to data quality, are we paying enough attention to it?
0 notes
Text
In today’s world, data is considered one of the most valuable assets any business can have. However, to truly unlock the power of data, it’s not enough to simply collect it—organizations need to ensure that the data they are working with is accurate, consistent, and reliable. That’s where Data Quality Observability comes in.
Data Quality Observability is the ability to monitor, understand, and proactively manage the state of data across an entire ecosystem. With the growing complexity of data pipelines and the increasing reliance on data-driven decisions, organizations can no longer afford to ignore the health of their data. Data quality observability helps businesses identify issues before they impact operations, making it a critical part of any data strategy.
#datagaps#data quality#data#dataops#dataops suite#data quality observability#QA tester#Data Analysts#BI Experts
0 notes
Text

Master Data Management (MDM) plays a vital role in helping organizations take control of their data—but success doesn't happen by accident.
Many companies run into trouble by repeating the same critical errors, turning what should be a high-impact initiative into a stalled or ineffective project.
Here’s a look at the most common challenges—and how to steer clear of them:
1. Lack of Clear Objectives Without a well-defined purpose, MDM projects lose focus. Is your goal to improve data quality? Drive better customer insights? ✅ Solution: Set specific, measurable goals that align with your business priorities.
2. Weak Data Governance When rules are unclear and responsibilities aren’t assigned, data becomes disorganized and unreliable. ✅ Solution: Build a solid governance framework with clear policies, data ownership, and accountability.
3. Poor User Adoption Even the most advanced tools won’t deliver results if users aren’t engaged or properly trained. ✅ Solution: Involve users early, provide hands-on training, and create continuous feedback channels.
4. Inconsistent Data Quality One-time data cleanups aren’t enough. Without regular maintenance, quality will naturally decline. ✅ Solution: Implement ongoing monitoring, audits, and data cleansing processes.
. Ineffective Change Management Change is difficult—but necessary. Resistance from teams can block progress. ✅ Solution: Communicate clearly, gain leadership support, and involve change champions to smooth the transition.
6. Choosing the Wrong Technology An ill-fitting platform can waste time, drain resources, and damage credibility. ✅ Solution: Choose flexible, scalable solutions—and work with partners who truly understand your data ecosystem.
Avoiding these pitfalls can mean the difference between a failed project and a future-proof MDM strategy. Make smart choices, stay aligned with your business goals, and invest in the right people and tools from the start.
0 notes