#Data_Centers
Explore tagged Tumblr posts


Text
#Texas Instruments#innovative#data_centers#power stages#efficiency#AI_driven#Powermanagement#powerelectronics#powersemiconductor
0 notes
Text
Germany Dedicated Server
EU100TB offers world-class dedicated hosting with datacenters in Germany and the Netherlands. Enjoy unmatched performance, secure infrastructure, and exceptional support, all backed by industry-leading technology.
0 notes
Text
Germany Dedicated Server
EU100TB offers world-class dedicated hosting with datacenters in Germany and the Netherlands. Enjoy unmatched performance, secure infrastructure, and exceptional support, all backed by industry-leading technology.
0 notes
Text
dedicated server Germany
Discover unmatched server reliability in Frankfurt’s state-of-the-art data centers with CtrlServers.com. Choose your ideal configuration and enjoy seamless connectivity.https://www.ctrlservers.com/dedicated-servers-germany/
0 notes
Link
Jensen Huang expressed commitment to the Chinese market Nvidia CEO Jensen Huang believes that the United States is still far from independence in the semiconductor manufacturing market. [caption id="attachment_85069" align="aligncenter" width="780"] Nvidia[/caption] According to Huang, it will be another 10 to 20 years before the United States stops being dependent on Taiwanese and Chinese chip makers. Of course, this is provided that all these years the country’s course will be aimed at getting rid of this very dependence. The head of Nvidia thinks so The United States has been working for quite some time to open chip production factories within the country, but it cannot be said that very many of these factories have already been built there. Huang also noted that, despite US sanctions, Nvidia will continue to work with the Chinese market, as it is simply the largest. Let us remind you that yesterday it became known that instead of the banned RTX 4090, the company will create GeForce RTX 4090 D (Dragon) especially for China .
#Artificial_Intelligence.#computer_hardware#CUDA_cores#data_centers#deep_learning#Gaming#Gaming_Graphics#GPU#GPU_architecture#graphics_cards#graphics_processing_unit#graphics_technology#nvidia#nvidia_geforce#Nvidia_Quadro#Nvidia_Titan#technology_company
0 notes
Text
Nuovo Data Center per l'Esercito Italiano Lo scorso 3 aprile il Governo ha trasmesso alle Commissioni competenti della Camera dei Deputati e del Senato della Repubblica la richiesta di parere parlamentare sullo schema di decreto ministeriale di approvazione del programma pluriennale di A/R nr. SMD 16/2023, denominato “Data Center”, relativo al consolidamento e potenziamento capacitivo dello Strumento terrestre nell’ambito del Information Communication Technology, corredato della scheda tecnica ed illustrativa. Il programma pluriennale in esame (A.G. 146) riguarda l’ammodernamento, il rinnovamento ed il potenziamento dello Strumento terrestre nell’ambito del Information Communication Technology (ICT).Il programma risulta volto ad ammodernare e rinnovare l’infrastruttura ICT dell’Esercito mediante larealizzazione di un
0 notes
Link
Microsoft It looks like OpenAI's ChatGPT and Sora, among other projects, are about to get a lot more juice. According to a new report shared by The information, Microsoft and OpenAI are working on a new data center project, one part of which w... bitrise.co.in
0 notes
Text

In the ever-changing landscape of the Computer Industry, innovation and advancement are constants. While much attention is given to high-profile components like processors, storage devices, and networ... http://tinyurl.com/ysoocolc
#CABLE_MANAGEMENT#CABLE_MARKERS#COMPUTER_INDUSTRY#DATA_CENTER#FUTURE_TRENDS#MAINTENANCE#SAFETY_COMPLIANCE#SCALABILITY#SERVER_ROOM#TROUBLESHOOTING
0 notes
Text
Coursera- Regression Modelling - Week 3 Assignment
My code:
import pandas as pd import seaborn as sns import matplotlib.pyplot as plt import statsmodels.api as sm import statsmodels.formula.api as smf import scipy.stats
data = pd.read_csv(r'C:\Users\AL58114\Downloads\gapminder.csv',low_memory = False)
data['employrate'] = pd.to_numeric(data['employrate'], errors='coerce') data['urbanrate'] = pd.to_numeric(data['urbanrate'], errors='coerce') data['oilperperson'] = pd.to_numeric(data['oilperperson'], errors='coerce') data['incomeperperson'] = pd.to_numeric(data['incomeperperson'], errors='coerce')
data_centered = data.copy() data_centered['employrate'] = data_centered['employrate'].subtract(data_centered['employrate'].mean()) data_centered['urbanrate'] = data_centered['urbanrate'].subtract(data_centered['urbanrate'].mean()) data_centered['oilperperson'] = data_centered['oilperperson'].subtract(data_centered['oilperperson'].mean())
print ('Mean of', data_centered[['employrate']].mean()) print ('Mean of', data_centered[['urbanrate']].mean()) print ('Mean of', data_centered[['oilperperson']].mean())
scat1 = sns.regplot(x="urbanrate", y="employrate", scatter=True, data=data_centered) plt.xlabel('urban rate') plt.ylabel('employee rate') plt.title ('Scatterplot for the Association Between urban rate and employee rate in a year') plt.show()
reg1 = smf.ols('urbanrate ~ employrate', data = data_centered).fit() reg1.summary()
reg2 = smf.ols('urbanrate ~ employrate + oilperperson + incomeperperson', data = data_centered).fit() reg2.summary()
reg3 = smf.ols('urbanrate ~ incomeperperson + I(incomeperperson**2)', data = data_centered).fit() reg3.summary()
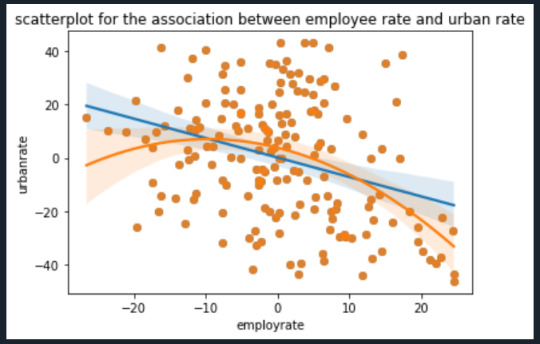
scat1 = sns.regplot(x = 'employrate', y = 'urbanrate', scatter = True, data = data_centered) scat2 = sns.regplot(x = 'employrate', y = 'urbanrate', scatter = True, order = 2, data= data_centered) plt.xlabel('employrate') plt.ylabel('urbanrate') plt.title('scatterplot for the association between employee rate and urban rate') plt.show()
fig4 = sm.qqplot(reg3.resid,line = 'r') print(fig4)
plt.figure() stdres = pd.DataFrame(reg3.resid_pearson) plt.plot(stdres, 'o', ls ='None') l = plt.axhline(y=0, color = 'r') plt.ylabel('standardized residual') plt.xlabel('observation number') plt.show()
fig2 = plt.figure() fig2 = sm.graphics.plot_regress_exog(reg3, "incomeperperson", fig=fig2) fig2
fig3=sm.graphics.influence_plot(reg3, size=8) fig3
Output:


The analysis shows that life expectancy is significantly correlated with income per person(p-value=0.000) ,employrate(p-value=0.000) and hivrate(p-value=0.000). With a coefficient of 0.0005 income per person is slightly positively correlated with life expectancy while employrate is negatively correlated with a coefficient of -0.2952 and hivrate is strongly negatively associated with a coefficient of -1.1005. This supports my hypothesis that lifeexpectancy could be predicted based upon incomeperperson, employrate and hivrate.
When I added internetuserate to my analysis, it exhibited a p-value out of range of significance, but it also threw several other variables into higher (but still significant) p-value ranges. This suggests that internetuserate is a confounding variable and is associated with the others but adding it to my analysis adds no new information.
Examining the plots posted above indicates that a curved line is a much better fit for the relationship between incomeperperson and lifeexpectancy. However, I do not believe a 2-degree polynomial line is the best; the data appears to match a logarithmic line better. Indeed, the Q-Q plot does show that the actual data is lower than predicted at the extremes and lower than predicted in the middle. This would match my theory that a logarithmic line would be a better fit. The plot of residuals has one data points fall outside -3 standard deviations of the mean; however, I am concerned that so many fall within -2 to -3 deviations. I attribute this to the poor fit of the polynomial line as compared to a logarithmic line. The regression plots and the influence plot show an alarming point (labeled 111 and 57 in the influence plot) which is an extreme outlier in terms of both residual value and influence. These points show up again in the plot Residuals versus incomeperperson and the Partial regression plot. I must examine what these points are and possibly exclude it from the rest of my analysis.
0 notes
0 notes
Text
we both thought clicking this would take us to the actual page
its ok, We're on tumblr. no one expects us to thinnk
7 notes
·
View notes
Text
boobs touching, sloppy style, with tongue, etc ..
i am going to kiss wikipedia
#also no wikipedia is most definitely not hosted from some basement#it's hosted across a number of datacenters#u can read more about that here#https://wikitech.wikimedia.org/wiki/Data_centers
28K notes
·
View notes
Text
#Infineon#power_modules#AI#data_centers#efficiency#powerelectronics#powermanagement#powersemiconductor#Innovation
0 notes
Photo

. 🔔 روش های کاهش مصرف برق در دیتاسنترها [#مقاله] . 🔸 مراکز داده پردازش های بسیار و سنگینی زیادی دارند و به تناسب افزایش پردازش، مصرف برق نیز در این مراکز افزایش می یابد. برای اینکه این مصرف به حداقل برسد، از روش هایی مثل لیکوئید کولینگ و هات ایسل ایزولیشن استفاده می شود. روش دیگر کاهش مصرف انرژی، استفاده از سرور های مجازی، جهت مدیریت هزینه ها است. طبق گزارش NRDC دیتاسنترهای آمریکا در سال ۲۰۱۳، ۹۱ میلیارد کیلووات در ساعت برق مصرف کرده اند و این موضوع تا سال ۲۰۲۰ به ۱۴۰ میلیارد کیلووات در ساعت رسیده که شامل هزینۀ هنگفت ۱۳ میلیارد دلاری شده است. . 〽️ ادامه این #مقاله را در وب سایت فرتاک بخوانید. . 🔸🔶🔸 https://fartak-co.com/green-datacenters-energy-saving 🔸🔶🔸 . ⭕️ سامانه فناوری فرتاک⭕️ ☎️ تماس : ۰۲۱۴۱۲۰۲۰۰۰ (۳۰ خط ویژه) . 📞 مدیریت فروش (داخلی ۱۲۸ ) . 📞 کارشناسان فروش سازمانی (داخلی ۲۱۱ و ۲۰۷ و ۲۰۹) . 🏢 آدرس دفتر مرکزی : تهران ، سهروردی شمالی ، بن بست آجودانی ، پلاک ۳ ساختمان فرتاک . #سامانه_فناوری_فرتاک #سرور_اچ_پى #سرور_hp #سرور #سرور_اچ_پی_ای #تجهیزات_شبکه #اچ_پی_ای_سرور #اچ_پی_ای #دیتاسنتر #مرکزداده #Datacenter #Data_Center #کاهش_مصرف_برق #انرژی_سبز #fuelcell #fuel_cell #پیل_سوختی #free_cooling #liquid_cooling #kyoto_cooling #میکرودیتاسنتر #micro_datacenter #میکرو_دیتاسنتر (at سامانه فناوری فرتاک) https://www.instagram.com/p/CityAO_Me4v/?igshid=NGJjMDIxMWI=
#مقاله#سامانه_فناوری_فرتاک#سرور_اچ_پى#سرور_hp#سرور#سرور_اچ_پی_ای#تجهیزات_شبکه#اچ_پی_ای_سرور#اچ_پی_ای#دیتاسنتر#مرکزداده#datacenter#data_center#کاهش_مصرف_برق#انرژی_سبز#fuelcell#fuel_cell#پیل_سوختی#free_cooling#liquid_cooling#kyoto_cooling#میکرودیتاسنتر#micro_datacenter#میکرو_دیتاسنتر
0 notes
Text
Tatiane Aquim, Jornalista, Editora de Conteudo, Rio de Janeiro
1 note
·
View note
Link
In monetary terms Nvidia is today's largest semiconductor manufacturer based on revenue and profit. We already talked about this the other day, and now another visual graph has appeared demonstrating the rapid success of the company. [caption id="attachment_84806" align="aligncenter" width="780"] Nvidia[/caption] This is a graph of the revenue of data center chip companies. As you can see, Nvidia became the first here too, with a huge gap from its competitors, and the turning point occurred only at the beginning of this year. Nvidia is turning into a monster. Before this, for several years (actually much longer, this data is just not on the graph), the leader was Intel, which accounted for 45% to 60% of revenue or more. At the same time, Intel's share gradually decreased, while the shares of Nvidia and AMD, on the contrary, grew. However, in 2023, due to the AI boom, Nvidia's share rose sharply, while the shares of AMD and Intel fell sharply. This does not mean that companies began to earn less - AMD is actively increasing sales of server CPUs, but Nvidia's growth is so great that the shares of AMD and Intel have actually decreased. [caption id="attachment_84807" align="aligncenter" width="780"] Nvidia[/caption] Today we already said that in the last quarter alone, Nvidia sold about half a million H100 and A100 accelerators and sales will only grow in the near future.
#Artificial_Intelligence.#computer_hardware#CUDA_cores#data_centers#deep_learning#Gaming#Gaming_Graphics#GPU#GPU_architecture#graphics_cards#graphics_processing_unit#graphics_technology#nvidia#nvidia_geforce#Nvidia_Quadro#Nvidia_Titan#technology_company
0 notes
Photo

Our Cisco 300-165 braindumps are better than all other cheap 300-165 study material.
Try us@ https://www.hotcerts.com/300-165.html
0 notes