#Fibonacci sequence in trading
Explore tagged Tumblr posts
Visit Tumblr Blog
Explore Tumblr blogs with no restrictions, modern design and the best experience.
Last Seen Tumblr Blogs


Fun Fact
69% of Tumblr users are millennials.
Text
How to Trade the Fibonacci Retracement Pattern: Complete Guide with Strategies
Fibonacci retracement is one of the most powerful tools in a technical trader’s toolbox. Derived from the famous Fibonacci sequence, this tool helps traders identify potential reversal levels in trending markets. Whether you’re trading stocks, forex, or cryptocurrencies, learning how to use Fibonacci retracements can significantly enhance your decision-making process. In this blog post, we’ll…
#Best Fibonacci retracement strategy for beginners#Candlestick confirmation#Combining Fibonacci retracement with RSI and moving averages#Entry and exit signals#Fibonacci levels explained#Fibonacci levels for intraday trading#Fibonacci levels in trading#Fibonacci Retracement#Fibonacci retracement confluence strategy#Fibonacci retracement forex#Fibonacci retracement in stock market#Fibonacci retracement indicator#Fibonacci retracement pattern#Fibonacci retracement trading strategies#Fibonacci sequence in trading#Fibonacci trading strategy#Golden ratio trading#How to draw Fibonacci retracement correctly#How to identify Fibonacci retracement levels#How to trade Fibonacci retracement#How to use Fibonacci retracement in day trading#learn technical analysis#Plotting Fibonacci retracement step by step#Risk management in trading#stock markets#stock trading#Stock trading using Fibonacci levels#successful trading#Support and resistance trading#Swing high and swing low
0 notes
Text
speaking of linux. goddddd i hate fake tech nerds. what do you mean you claim to be super good at coding and know all of the latest tech stuff but in reality dedicate your soul to apple. what do you MEAN your primary device is an ipad and not a pc running linux that you built yourself. and your apple products arent even jailbroken???? AND when pressed about this you just claim that you simply love gamepidgeon too much to switch to any other brand????? good lord at this point im a bigger tech nerd than you and the most "complicated" tech thing i do is pirate video games
#this persons “interesting” claims also include: saying that an ai trained on the fibonacci sequence(???) can trade crypto for a profit#the way you count cards in poker is by. straight up memorizing which cards have been played#like what are you on about.......
5 notes
·
View notes
Text
Fibonacci Retracement: Forex Trading Indicator Explained
Fibonacci retracement is a popular technical analysis tool used by forex traders to identify potential support and resistance levels. This indicator is based on the idea that markets will retrace a predictable portion of a move before continuing in the original direction. In this article, we will explore the concept of Fibonacci retracement, how it works, and how to effectively use it in forex…

View On WordPress
#Fibonacci Levels#Fibonacci Retracement#Fibonacci Sequence#Forex Market#Forex Trading#Market Analysis#Risk Management#Support And Resistance#Swing High#Swing Low#Technical Analysis#Trading Indicators#Trading Strategy#Trend Continuation#Trend Reversal
0 notes
Text

Recent archaeological discoveries have dramatically altered our understanding of Neanderthal artistic capabilities. While once dismissed as primitive, Neanderthals created sophisticated cave paintings as early as 64,000 years ago—at least 20,000 years before modern humans arrived in Europe. In Spain's La Pasiega cave, researchers identified a red ladder-shaped symbol created by Neanderthal artists that predates Homo sapiens art by millennia, demolishing the long-held belief that symbolic thinking was exclusive to our species.
The technical execution of Neanderthal art reveals surprising sophistication. They manufactured specialized tools for pigment application, created paint through complex mixing processes, and utilized the natural contours of cave walls to enhance three-dimensionality in their compositions. Most remarkably, evidence from El Castillo cave in Spain suggests Neanderthals harvested owl feathers and raptor talons not for practical purposes but for symbolic ornamentation—directly challenging narratives about their supposed lack of abstract thinking.
Perhaps most revolutionary is the discovery of "finger fluting" techniques in French cave sites, where Neanderthals dragged fingers through soft clay to create deliberate, repetitive patterns that follow mathematical principles similar to Fibonacci sequences. Isotope analysis of pigments from Iberian peninsula sites indicates some materials were transported over 100 kilometers, suggesting organized trade networks specifically for artistic materials.
30 notes
·
View notes
Photo
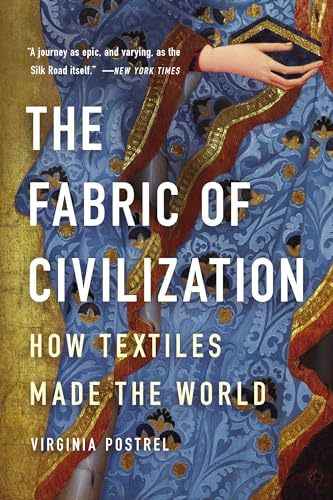
The Fabric of Civilization: How Textiles Made the World
In "The Fabric of Civilization," Virginia Postrel explores how the history of textiles is akin to the story of civilization as we know it. As evidenced throughout her book, Postrel treats each chapter as a standalone story of its production and journey, all the while masterfully weaving it together to show the story of human ingenuity. While academic in nature due to its incredibly well-researched methodology, the general reader will enjoy the book's unique style and approach to world history.
In The Fabric of Civilization: How Textiles Made the World, Virginia Postrel expertly demonstrates how the history of textiles is the story of human progress. Although textiles have shaped society in many ways, their central role in the development of technology and impact on socio-economics have been exceedingly overlooked. Attempting to remedy this issue, Postrel organizes her book into two distinct sections: one focusing on the different stages of textile production (fiber, thread, cloth, and dye) and the other on the consumers, traders, and future innovators of said textiles. To strengthen her argument, Postrel pulls from different primary sources across many regions and cultures, such as the works of people like entomologist Agostino Bassi and the accounts of disgruntled Assyrian merchants. However, Postrel goes beyond relying solely on books and peer-reviewed articles; she personally interviewed textile historians, scientists, businesspeople, and artisans who offered their own insight regarding the importance of textiles in the world. To help the reader envision the intricacies of textile manufacturing, the book is riddled with images that range from ancient spindle whorls and Andean textile patterns to nineteenth-century pamphlets raging over improved cotton seeds. It is quite a laborious task to explain the history of textiles, but Postrel’s way of organizing her chapters and style of writing does an excellent job of conveying her argument.
In Chapter One, Postrel illustrates the many uses of fibers and how their multipurpose functionality served its role in world economies. From the domestication of cotton in the Americas to sericulture in ancient China, such fibers left an indelible mark on trade and technology. Chapter Two looks at the use of thread's connection with social and gender roles as Postrel argues that dismissing fabric as feminine domesticity ignores its integral role in the social innovations that products like clothing and sails provided. Chapter Three connects mathematics with weaving through handwoven textiles by Andean artisans and in the notations written down in Marx Ziegler’s manual, The Weaver’s Art and Tie-Up Book (1677). Chapter Four explains how dyes not only contributed to the distinction between social classes, such as the use of Tyrian purple by Roman emperors but also the ingenuity of humans to ascribe meaning and beauty to a variety of colors. Furthermore, the increasing and competitive trading of dyes in the 16th and 17th centuries would eventually contribute to the discovery of synthetic dyes.
Textile traders and consumers also helped to foster cultural exchanges. Postrel then highlights how traders often also served as innovators. The implementation of the Fibonacci sequence in European trading not only helped traders with bookkeeping but also gave a new perspective to the practicality of learning math by helping traders understand profits and calculate prices. Readers explore in Chapter Six how the Mongol Empire expanded across many different lands for their desire for valuable woven textiles. Under the Pax Mongolica, the textile trade flourished as the Mongols protected the Silk Road, resulting in cross-cultural and technological exchange between Europe and Asia. Lastly, in Chapter Seven, Postrel introduces synthetic polymers like nylon and polyester, where the efforts made by scientists like Wallace Carothers, Rex Whinfield, and James Dickson have revolutionized the use of textiles. Companies like Under Armour use polyester to create water-repellent clothing. Despite synthetic polymers currently being used innovatively, many still seek to look into the future of textiles. As Postrel explains, imagine your pockets can charge your phone or your hat could give you directions. The future of textiles is incredibly exciting.
As an avid writer of socio-economics, Postrel expertly showcases her knowledge of the subject. Postrel’s previous books, such as The Future and its Enemies (1998) and The Power of Glamour: Longing and the Art of Visual Persuasion (2013), cover the interconnectedness between culture, technology, and the economy. Postrel has also worked as a columnist for several news sites, is the contributing editor for the magazine Works in Progress, and was a visiting fellow at the Smith Institute for Political Economy and Philosophy at Chapman University. This book is a wonderful intellectual contribution that feels like a documentary series, perfectly threading the reader through cultures and regions like a needle through fabric.
Continue reading...
93 notes
·
View notes
Text
Super underrated moments from the Change the WorLd movie in no particular order:
Ryuk telling L even if he burns the Death Note his fate can’t be changed and then immediately trying to get him to use the death note to speedrun becoming a god
“I’ve never babysat before, and so far… it’s not going very well.”
L trading potato chips for a necklace with a young boy who then just shoves them into his mouth with both hands with a surprising ferocity
L using a keyboard exactly how you would expect him to type and the movie asking us to believe it’s effective
A way too long shot of L, Mako, and the young boy with L and Mako on bikes and the young boy sitting in a basket on L’s bike looking like this

L’s back audibly cracking when he stands up straight, cheered on by the kids
There being two lines total that matched the subtitles, and the subtitles just entirely vanishing for entire swathes of the movie
Naomi walking into a building, gunshots immediately being heard, and then walking back out with no additional information provided about that scene
The guy saying “I’M AN FBI AGENT, LET ME THROUGH” and showing his badge and a random street vendor replying “Yeah, well I’m a CIA agent! You’re not FBI, you’re JAPANESE!”
The way F said the dialogue “This JAPANESE man is an extremist”
The FBI agent actually using the crepe truck to make himself a crepe which he then holds like L to eat
The young boy having like two lines of dialogue total, both being just screaming a sequence of numbers at the top of his lungs even after he’s told to stop
Him laying out sugar cubes in the Fibonacci sequence but every time he sets out down, L eats one
Them determining that the reason the virus isn’t affecting Mako is her blood sugar is too low and then immediately cutting to them having a whole spread of sweets
Mako seeing something on her back and thinking she’s displaying symptoms and when she tells the adults, L immediately picks up the boy, who they already know is genetically immune, and puts him in closet. Even when they determine it’s just a tick bite, nobody lets him out of the closet.
L Naruto running
Mako saying something depressing and L immediately grabbing the back of her neck and it reads like an attempt at comfort but you later learn he was taking her temperature and did it like that instead of her forehead for God only knows why
Mako bringing a box cutter to a gun fight
The fact that it’s counting down but randomly skips several days at a time without telling us what they were doing for those two days more than once
L suddenly being able to pilot a plane (albeit not well) and everyone in the terminal waiting until the last possible second to run
Knife girl, who wore several white dresses, and never seemed to get blood on them
#l change the world#that movie was a hot mess and I loved every second#only things I would change#1. hair color of the boy#2. would have replaced I’ll be waiting with a thematically inappropriate Red Hot Chili Peppers song#3. added the scene from the book where he literally stands in the street and screams at the sky#🎶 a greater woman stays cool#but I howl like a wolf at the moon 🎶#also L’s actor is perfect#he is just so perfect#he looks just like him and all his choices were perfect#paired with Alessandro’s dub is just#chef’s kiss#absolutely worth the like three months it took to schedule a time we were all available
7 notes
·
View notes
Text
Fic Recs Wrap Up October 2024ꐑ(ꐌ◡ꐌꐐ)࿐࿔࿓ཥ•̬͡•ོཤ(((༼•̫͡•༽)))←~(o `▽´ )oΨ

In Another Life (I Would Make You Stay) by aboutmalfoy
Seven years out from the war, Hermione comes to Harry with a way to undo the lasting damage done to the Wizarding World, and save those once lost. The catch is, only Harry will remember anything differently. When Harry wakes up in the world where Voldemort never came to be, he’ll have to navigate the life he never lived as if he’d been there all along. Except, a version of Harry was there all along—and he may not be so easily overridden. (Rec Post)
White Horses by JStevens
They say there are no white horses—those that we think of as white are really just a faded deceitful gray. And if there are no white horses, certainly there are no true heroes who will come riding in on one to save us from all our pain. After learning of the prophecy that will change his future, Harry returns to Hogwarts School for sixth year and finds that not everyone is who he thought they were. It seems that he is not. Definitely Draco Malfoy is not. As he tries to find a path to the end of his time at Hogwarts, he will have to grapple with questions of who to trust and who to love while navigating a world full of threats. This is a story of how we sometimes deceive ourselves and others, but hopefully find something true in the end. (Rec Post)
Recursion by Tessa Crowley (tessacrowley) @tessacrowley
A process is recursive when it defines or contains itself; e.g., the Fibonacci sequence, which determines the next number as the sum of the previous two. But not all recursive processes are mathematical. Recursion can happen in a temporal context when, for instance, the powerful magical force that is true love drags you back in time so it can create itself, endangering the fate of the Wizarding World—not to mention the very fabric of space and time—along the way. ( Rec Post)
To have a Home by Aulophobia
Not quite a decade after the war, Draco Malfoy was happy with his quiet little Muggle life in Oxford. He had a small group of friends from the university he’d attended, and colleagues from the law firm where he worked as a solicitor. He played folk music on his violin around the city. And he volunteered to provide legal services getting mostly idiot teenagers out of trouble with the law. His life was full. He had no contact with the magical world, and all was the way he liked it. And the feeling of emptiness in his chest, the feeling some part of him was missing, was at least better than the alternative. Or at least it was until the last few months when he kept getting called down to the police station to get Harry Potter out of trouble. Indecent exposure and possession was one thing, but the latest charge was for murder. OR Harry and Draco find each other again after the war in Oxford, a completely non-magical city. Together they solve the mystery of the city which hates all wizards but them. (Rec Post)

Here are a few more fics I've read recently that y'all might like to check out as well!(ノ゚∀゚)ノ━☆゚・*:.。. .。.:*・.*・。゚*:・゚✧
Trade My Heart For Honey by MyNameIsThunder @thunderfiction
A witch who thinks she’s a Seer, a Seer who thinks she’s a witch, a former nemesis-turned-something-turned-acquaintance who thinks they could be friends, and a Scottish village full of Muggles who think this is as much their business as the fair folk in the woods. Draco is going to prove them all wrong. (So so good, and it's for me?!?!? ♡✧( ु•⌄• )💜💙💚💛❤💗💕💖)
Change the Ending by Anonymous for @hd-fan-fair H/D Muggle Fair 2024
When Draco gets hit by a curse that makes him essentially allergic to magic, Harry takes him in as a favour to Ron and Kingsley to teach him how to survive without it while they wait for a cure.
In the Fight for Someone's Heart, the Best Armour is Armani by Anonymous for @hd-fan-fair H/D Muggle Fair 2024
Harry is a famous actor. Draco is his stylist, who can't help but fall in love with him.
[ART & FIC] Starry, Silver Anchor by Anonymous for @hd-fan-fair H/D Muggle Fair 2024
Although no one can see it, Harry’s struggling and barely holding on. When he's given a chance, he asks for his deepest desire: for the war to never happen.
( •ॢ◡-ॢ)-♡ HI! I'm back! I hope y'all didn't miss me too much! Please enjoy these fics as much as I have! Happy reading! xoxo Carey (◍•ᴗ•◍)♡ ✧*💜💙💚💛❤💗💕💖
#Fic recs wrap up October 2024#Fic Recs Wrap Up#Drarry Fic Recs#Fic Recs#drarry#hp Fic Recs#harry potter#draco malfoy#hp#Harry Potter fic recs#Drarry fanfiction#Harry Potter Fanfiction#drarry fic#drarry smut#drarry squad#drarry fanart#hp fic#hp fanfiction#hp fanart#smut#hp smut#harry potter fanfic#harry potter fic#hp fanfic#HD fan fair#HD Muggle Fair 2024#My recs#Carey's Bookmark Fic Recs#carey's personal bookmarks#Long Post
15 notes
·
View notes
Text
So, miles to km is 1.6, right? And the inverse of that is 0.6 or thereabouts, but I can't quickly do inverses in my head.
Okay, now what's the ratio for pounds to kg? I learned it as 2.2kg to the pound, not 0.45 pounds to kg.
Now on any given day, if you ask me to regurgitate one of those ratios, I am 90% likely to get it wrong. I'll quote you the other ratio or otherwise mix them up. Kilometers are bigger than miles, so 1 mile = 2.2 km, maybe? (No.)
But I can do Fibonacci in my sleep, maybe because I'm a programmer by trade. And because I'm trained as an engineer, estimation ratios like that are my bread-and-butter.
The other day I taught this trick to a friend of mine who's a graphic designer. She doesn't know the Fibonacci sequence by name, but she sure as hell does know the Golden Ratio. Never underestimate the utility of different ways of looking at a problem.
(My other favorite estimation ratio? To convert between Fahrenheit and Celsius, start with 20°C is 70°F and ±5°C is ±10°F. Is it perfect? No, but if you're trying to read a weather report and figure out how warm you're going to feel today, it's close enough.)
Fun little math trick I find really helpful: the ratio of a mile to a kilometer is within 1% of the Golden Ratio. That means that if you have a good memory for Fibonacci numbers (1 2 3 5 8 13 21 34 55 89) you can convert pretty accurately by taking consecutive Fibonacci numbers.
For example, 89 kilometers is really close to 55 miles (55.3). Or, say you need to convert 26 miles to kilometers: 26 can be written as 21 plus 5, so taking the next Fibonacci number up gives 34 and 8, meaning it should be around 42 kilometers. Sure enough, it's 41.8 km!
94K notes
·
View notes
Text
Top 10 Best Indicators for Stock Trading in India

Stock trading is an exciting way to grow your money. Many people in India have started trading in stocks, but not everyone makes profits. To become a smart trader, you need to know how to read the market. One of the best ways is by using indicators. Indicators help you understand whether it is a good time to buy or sell a stock.
In this blog, we will explain 10 important indicators every Indian trader should know. We will keep it simple so that even beginners can understand and use them.
1. Moving Average (MA)
What it means: A moving average shows the average price of a stock over a certain number of days. For example, a 50-day moving average shows the average price for the last 50 days.
How to use: When the stock price goes above the moving average, it is usually a sign to buy. When the price falls below it, it can be a sign to sell.
Tip: Popular moving averages are the 50-day and the 200-day moving average.
2. Relative Strength Index (RSI)
What it means: RSI tells you if a stock is overbought (too expensive) or oversold (too cheap). It is a number between 0 and 100.
How to use:
If RSI is above 70, the stock might be overbought. It may fall soon.
If RSI is below 30, the stock might be oversold. It may rise soon.
Tip: Check RSI along with other indicators before buying or selling.
3. Bollinger Bands
What it means: Bollinger Bands show how much a stock price moves around its average price. It has three lines: the middle one is the moving average, and the upper and lower bands show the range.
How to use: When the bands are wide, the stock is more volatile. If the price touches the upper band, it may fall back. If it touches the lower band, it may go up.
Tip: Bollinger Bands are great for spotting sudden price breakouts.
4. MACD (Moving Average Convergence Divergence)
What it means: MACD is a trend-following indicator. It shows the relationship between two moving averages.
How to use:
When the MACD line crosses above the signal line, it’s a buy sign.
When the MACD line crosses below the signal line, it’s a sell sign.
Tip: MACD works well for short-term and medium-term trading.
5. Volume
What it means: Volume shows how many shares were traded in a day.
How to use: High volume means strong interest in the stock. When price goes up with high volume, the trend is strong. If price moves without volume, the trend is weak.
Tip: Always check volume before trading. It confirms whether the trend is real.
6. Stochastic Oscillator
What it means: This indicator compares the closing price to a range of prices over time.
How to use:
If the value is above 80, the stock may be overbought.
If it is below 20, the stock may be oversold.
Tip: Use it with RSI for better signals.
7. Support and Resistance Levels
What it means: Support is the price level where a stock usually stops falling. Resistance is the price level where a stock usually stops rising.
How to use: Buy near support and sell near resistance. These levels help you set entry and exit points.
Tip: Support and resistance are easy to draw on a price chart. Practice spotting them.
8. Moving Average Crossovers
What it means: This method uses two moving averages of different periods.
How to use:
A “Golden Cross” happens when a short-term MA (like 50-day) crosses above a long-term MA (like 200-day). It’s a bullish signal.
A “Death Cross” happens when a short-term MA crosses below a long-term MA. It’s a bearish signal.
Tip: Crossovers help identify trend changes.
9. Average True Range (ATR)
What it means: ATR measures how much a stock moves, on average, in a day.
How to use: Higher ATR means higher volatility. It helps you decide stop-loss levels.
Tip: If you don’t like too much risk, pick stocks with lower ATR.
10. Fibonacci Retracement
What it means: This tool helps find possible support and resistance levels based on the Fibonacci sequence.
How to use: Traders draw Fibonacci levels on a chart to see where prices might bounce back.
Tip: Use it with trend indicators for better accuracy.
Final Words
Indicators are very helpful for making better trading decisions, but they are not magic. They help you read what is happening in the market. Always remember:
Use more than one indicator together.
Follow market news and company results.
Keep a stop-loss to control losses.
Never invest all your money in one stock.
In India, many traders use these indicators daily. If you learn how to use them, you will become more confident and trade smarter. Start by picking 2 or 3 indicators and practice with them. Over time, you will know which ones work best for you.
Happy Trading!
#outfit#branding#financial services#investment#investment planning#financial freedom#financial wellness#financial planning#financial advisor#finance
0 notes
Text
Fibonacci Lines: How Ancient Patterns Power Modern Trading and Strategy
In the world of finance, where numbers often feel like a language only the initiated can understand, there exists a sequence that has captivated minds for centuries. It’s not just a mathematical curiosity—it’s a tool that has shaped strategies, guided decisions, and even influenced the rise and fall of fortunes. Meet the Fibonacci sequence, a pattern so deeply embedded in nature, art, and markets…
0 notes
Text
The magical world of Fibonacci: unlock the securities market secret!
## The magical world of Fibonacci: unlock the securities market secret! @Tlginvestments has brought us a profound analysis of “Fibo technique”, a powerful tool to help investors “see through” the future of the stock market. This article will help you better understand the potential power of the Fibonacci sequence and how to apply it to your trading strategy. Get ready to enhance your investment…
0 notes
Link
#chartpatterns#FibonacciLevels#FibonacciRetracementTrading#GoldenRatio#MarketPrediction#marketvolatility#priceaction#ProfitTaking#riskmanagement#StockMarket#supportandresistance#technicalanalysis#TradeEntryPoints#TradingSignals#TradingStrategy#TrendReversal
0 notes
Text
Fibonacci Trading: Forex Trading Strategy Explained
Fibonacci trading is a popular forex trading strategy that utilizes the Fibonacci sequence and its ratios to predict potential price movements and retracement levels. This method helps traders identify entry and exit points, making it an essential tool in forex trading. Understanding Fibonacci Sequence The Fibonacci sequence is a series of numbers where each number is the sum of the two preceding…
#CCI#DeFi#Divergence#Downtrend#Entry and Exit Points#Fibonacci Levels#Fibonacci Retracement#Forex#Forex Trading#MACD#Market Conditions#Market Volatility#Moving Average#Moving Average Convergence Divergence#Predictability#Price Action#Price Charts#Price Movement#Price Movements#Relative Strength#Risk Management#RSI#Stop-Loss#Support And Resistance#Trading Decisions#Trading Strategy#Volatility
3 notes
·
View notes
Text
Crypto Market Crash & Investing Psychology Quiz
by uevs and the power of AI (NOT Financial Advice)
Test your knowledge on market crashes, contrarian investing, and risk management!
Section 1: Multiple-Choice Questions
1. What is the Fear & Greed Index used for in the crypto market? A) Measuring overall inflation rates B) Tracking Bitcoin’s network activity C) Analyzing investor sentiment and market emotions D) Predicting exact price movements
2. When the market is in ‘Extreme Fear,’ what do contrarian investors typically do? A) Sell all assets to avoid further losses B) Buy undervalued assets like BTC and SOL C) Short the market with leverage D) Avoid the market completely
3. Which risk is associated with leveraged trading? A) Unlimited profit potential B) Increased risk of liquidation by market volatility C) Guaranteed returns if the trade direction is correct D) No risk since leverage is backed by stablecoins
4. What is the best strategy to manage risk in a volatile market? A) Invest all capital in a single asset B) Use high leverage to maximize gains C) Dollar-cost averaging (DCA) into quality projects D) Buy only when prices are at all-time highs
Section 2: True or False
5. The market is designed to liquidate overleveraged traders. 🔲 True 🔲 False
6. Bitcoin has never experienced an 80% drawdown from its all-time high. 🔲 True 🔲 False
7. The best time to invest is always when the Fear & Greed Index is at ‘Greed’ or ‘Extreme Greed.’ 🔲 True 🔲 False
8. Using leverage means borrowing money to increase your position size. 🔲 True 🔲 False
Section 3: Short-Answer Questions
9. What does ‘buy the dip’ mean, and why do some investors use this strategy?
10. Explain why market sentiment shifts from greed to fear and how this affects investor behavior.
11. Why should investors be cautious about using leverage in crypto trading?
12. What is the Fibonacci sequence, and how is it applied in crypto investing?
Section 4: Calculation Question
13. If an investor wants to dollar-cost average into Bitcoin over 6 months with $12,000, how much should they invest per month?
Section 5: Scenario-Based Question
14. You have $5,000 to invest in crypto, but the Fear & Greed Index is at ‘Extreme Fear’ (25). BTC has dropped 30% in the past month, and Solana is down 40%. How would you allocate your investment while managing risk?
Crypto Market Crash & Investing Psychology Quiz – Answer Key
Test your knowledge on market crashes, contrarian investing, and risk management!
Section 1: Multiple-Choice Questions
1. What is the Fear & Greed Index used for in the crypto market? ✅ C) Analyzing investor sentiment and market emotions
2. When the market is in ‘Extreme Fear,’ what do contrarian investors typically do? ✅ B) Buy undervalued quality assets like BTC and SOL
3. Which risk is associated with leveraged trading? ✅ B) Increased risk of liquidation by market volatility
4. What is the best strategy to manage risk in a volatile market? ✅ C) Dollar-cost averaging (DCA) into quality projects
Section 2: True or False
5. The market is designed to liquidate overleveraged traders. ✅ True – Market makers and whales often hunt liquidation points.
6. Bitcoin has never experienced an 80% drawdown from its all-time high. ✅ False – BTC has historically faced multiple 80%+ corrections.
7. The best time to invest is always when the Fear & Greed Index is at ‘Greed’ or ‘Extreme Greed.’ ✅ False – High greed often signals market tops, not buy opportunities.
8. Using leverage means borrowing money to increase your position size. ✅ True – Traders use leverage to control a larger position, but it increases risk.
Section 3: Short-Answer Questions
9. What does ‘buy the dip’ mean, and why do some investors use this strategy? ✅ ‘Buying the dip’ means purchasing an asset when its price has dropped significantly, under the belief that it will recover in the future. Contrarian investors use this strategy to accumulate at lower prices instead of buying during market euphoria.
10. Explain why market sentiment shifts from greed to fear and how this affects investor behavior. ✅ Market sentiment shifts due to price fluctuations, news, and macroeconomic factors. When prices are rising, investors experience FOMO (Fear of Missing Out) and become greedy. When prices fall, fear takes over, leading to panic selling and further drops.
11. Why should investors be cautious about using leverage in crypto trading? ✅ Leverage increases potential gains but also magnifies losses. Since crypto markets are highly volatile, leveraged traders risk forced liquidation if price swings go against them, leading to complete loss of their position.
12. What is the Fibonacci sequence, and how is it applied in crypto investing? ✅ The Fibonacci sequence is a mathematical pattern found in nature and financial markets. Traders use Fibonacci retracement levels (e.g., 23.6%, 38.2%, 61.8%) to identify potential support and resistance levels for buying or selling.
Section 4: Calculation Question
13. If an investor wants to dollar-cost average into Bitcoin over 6 months with $12,000, how much should they invest per month? ✅ $12,000 ÷ 6 months = $2,000 per month
Section 5: Scenario-Based Question
14. You have $5,000 to invest in crypto, but the Fear & Greed Index is at ‘Extreme Fear’ (25). BTC has dropped 30% in the past month, and Solana is down 40%. How would you allocate your investment while managing risk? ✅ A balanced approach could be:
DCA Strategy: Invest $1,000 per month over 5 months to reduce risk.
Split Allocation: 70% in BTC (more stable), 30% in SOL (higher risk/higher reward).
Emergency Fund: Keep some cash aside in case of further market drops.
No Leverage: Avoid leverage to prevent liquidation.
Scoring System:
0-4 correct answers: 🛑 Crypto Newbie – Time to learn more before jumping in!
5-8 correct answers: ⚡ Market Observer – You know some basics but need to refine your strategy.
9-12 correct answers: 🚀 Smart Investor – You understand risk, strategy, and psychology.
13-14 correct answers: 🏆 Contrarian Mastermind – You think like a pro and capitalize on fear!
Drop your scores below! Who's buying the dip and who's still on the sidelines? 🚀🔥
#Bitcoin #Solana #Crypto #ExtremeFear #BuyTheDip #ContrarianInvesting #WealthBuilding #NoLeverage
0 notes
Text
5 Key Indicators Every Trader Should Know: Essential Tools for Today's Market
The Trading Compass: Navigating India's Current Market
Hey there, fellow traders! 📈 Have you been feeling the market's unpredictability lately? You're not alone! I've been trading through this volatility too, and wanted to share some hard-earned wisdom about the technical indicators that have truly made a difference in my decision-making process.
India's market has been particularly turbulent recently, with everything from global economic shifts to domestic policy changes throwing curveballs our way. That's why having reliable tools to guide your trading decisions isn't just helpful—it's essential for survival in today's market environment.
Let me walk you through the five indicators I personally rely on every single day:
1. RSI: Your Market Mood Reader
Think of the Relative Strength Index as your market psychiatrist—it tells you when the market is getting too emotional in either direction. On a scale of 0-100, it measures whether an asset is potentially overvalued or undervalued.
I've found RSI incredibly reliable lately, especially when:
It pushes above 70, suggesting a stock might be running too hot (happening frequently in our tech sector right now)
It dips below 30, hinting at oversold conditions (I've found some great bargains in manufacturing this way)
2. MACD: Your Trend's Best Friend
Don't let the complicated name fool you! The Moving Average Convergence Divergence indicator simply helps you understand the momentum and direction of trends.
Here's how I personally use MACD in today's market:
When the MACD line crosses above the signal line, I pay attention—this bullish signal has been remarkably accurate in renewable energy stocks lately (helped me catch a 12% move just last week!)
I watch the histogram to see momentum building or fading—crucial for timing entries and exits
Zero-line crossings give me confidence about the overall trend direction—essential for my medium-term positions
3. Bollinger Bands: Your Volatility Visualizer
In times like these, understanding volatility is everything—and Bollinger Bands make it visual. They expand during chaotic periods and contract during calmer ones.
Three ways I apply Bollinger Bands in my daily trading:
Band width immediately shows me if volatility is increasing/decreasing—absolutely crucial as our markets navigate current transitions (saved me from several false breakouts recently)
I love finding mean reversion opportunities when prices touch band extremes—this strategy has been particularly profitable in FMCG stocks
After consolidation periods, decisive band breakouts often precede strong trends—I've seen this pattern repeatedly in banking stocks this year
4. VWAP: Your Institutional Edge
As algorithms dominate more trading, understanding where big money is active becomes critical. VWAP (Volume-Weighted Average Price) helps me see the true average price incorporating volume—essentially showing where institutions are likely active.
Here's how VWAP gives me an edge:
Major institutions use it for execution benchmarks, creating natural support/resistance levels
Trading above/below VWAP helps confirm my intraday bias—essential in today's quick-moving markets
I use it as an exit benchmark to improve my average performance
5. Fibonacci Retracement: Your Timeless Market Map
It amazes me that a mathematical sequence discovered centuries ago works so well in our digital markets today, but Fibonacci retracement levels consistently help identify potential turning points.
My three favorite Fibonacci applications:
The 38.2%, 50%, and 61.8% retracement levels provide amazing entry points in trends—I've used these successfully throughout this year's commodity cycles
Fibonacci extensions help me project realistic profit targets beyond previous highs/lows
When Fibonacci levels align with other indicators like RSI or MACD, the high-probability setups that emerge have dramatically improved my win rate
Bringing It All Together: The Integrated Approach
Here's what I've learned after years of trading: while each indicator offers valuable insights, the real magic happens when you combine them strategically. I don't make major trading decisions without confirmation from multiple indicators—it's like having several expert advisors all agreeing on the same trade. You can learn this strategies and how to effectively apply them by enrolling in the Stock Market Courses in Mumbai
I'd love to hear which indicators you find most helpful in your trading! Drop a comment below and let's learn from each other. Happy trading! 📊
1 note
·
View note