#Financial data
Explore tagged Tumblr posts
Visit Tumblr Blog
Explore Tumblr blogs with no restrictions, modern design and the best experience.
Last Seen Tumblr Blogs


Fun Fact
Users from the US are the majority of Tumblr visitors.
Text
Likely the horse has left the barn, but let us hope.
13 notes
·
View notes
Text


So much fucking winning!
#economy#capitalism#late stage capitalism#data is beautiful#financial data#stock market#finance#tariffs
1 note
·
View note
Text

AI Meets Finance: How Data Science is Revolutionizing the Fintech Industry in 2025
Introduction
The financial world is no longer just numbers on a spreadsheet—it’s a fast-moving ecosystem driven by data, automation, and machine learning. In 2025, data science has become the engine behind fintech innovation. From detecting fraud in milliseconds to automating investment strategies and personalizing banking experiences, data science is transforming the way we save, spend, and invest.
In this blog, let’s explore how data science is shaping the future of fintech and why this synergy is one of the hottest tech trends of the year.
1. Real-Time Fraud Detection
Gone are the days of waiting hours to detect suspicious activity. With real-time data analytics, financial institutions can spot fraud as it happens.
🔹 How it works: Machine learning models analyze transaction patterns and flag anomalies instantly. If something looks off—like an unusual location or spending spike—alerts are triggered immediately.
✅ 2025 Trend: Deep learning combined with behavioral biometrics is enhancing fraud detection accuracy by over 95%.
2. Personalized Banking Experiences
Data science is helping banks tailor their services to individual users. Whether it’s recommending a credit card, offering a loan, or managing your savings goals, AI-driven insights create more meaningful customer experiences.
🔹 Example: AI chatbots trained on customer interaction data can now provide hyper-personalized financial advice 24/7.
3. Robo-Advisors and Smart Investments
Robo-advisors powered by data science use algorithms to manage portfolios based on risk appetite, market trends, and user goals.
🔹 Benefits: Low-cost, automated investment strategies that outperform many human-managed portfolios.
📈 2025 Insight: Generative AI is now being used to simulate multiple economic scenarios for even smarter investment planning.
4. Credit Scoring Reimagined
Traditional credit scores are rigid and often exclude underbanked populations. In 2025, data scientists are redefining credit scoring using alternative data—social behavior, transaction history, and mobile usage.
🔹 Impact: Millions of people without formal credit histories can now access loans and financial services.
5. Predictive Analytics in Lending
Lenders now use predictive analytics to assess loan risk and determine borrower reliability more accurately than ever.
🔹 Example: Models forecast the likelihood of repayment using real-time income, employment patterns, and spending behavior.
💡 Bonus: This reduces default rates and accelerates loan approvals.
6. Algorithmic Trading with AI
In stock markets, milliseconds matter. AI algorithms can analyze market data at lightning speed and execute trades based on complex patterns.
🔹 2025 Trend: Hybrid human-AI trading desks are emerging where analysts work alongside real-time ML models.
7. Blockchain Data Analysis
With the rise of decentralized finance (DeFi), data science tools are being used to analyze blockchain transactions, detect money laundering, and monitor crypto market trends.
🔹 Example: Graph analytics is helping trace illegal wallet activity and prevent crypto scams.
8. Regulatory Technology (RegTech)
Data science is helping financial institutions stay compliant with ever-evolving regulations. By automating compliance checks, reporting, and monitoring, companies save both time and money.
✅ 2025 Insight: NLP models now extract key regulatory updates from documents and integrate them into risk models in real-time.
Conclusion
The fusion of fintech and data science is creating a smarter, faster, and more inclusive financial world. Whether you're a consumer enjoying seamless digital banking or a startup using AI to innovate, data is at the core of it all.
As we move deeper into 2025, one thing is clear: mastering data science isn’t just for techies—it’s essential for anyone shaping the future of finance.
#nschool academy#data science#fintech#ai in finance#machine learning#fraud detection#personalized banking#robo advisors#credit scoring#predictive analytics#algorithmic trading#blockchain analytics#regtech#financial data#smart investing#data driven finance
0 notes
Text

Your Data. Our Responsibility.
At https://globalbookkeeping.net/, we take your privacy seriously. Here’s how we keep your financial data 100% secure,
0 notes
Text
The Nonprofit Accounting Software Buyers Guide
Is Your Accounting Software Helping or Holding You Back?
Ask yourself: Is your accounting and financial management software truly helping your nonprofit achieve its mission, or is it creating unnecessary obstacles?
Many legacy accounting systems struggle to provide fast, reliable financial data. If this sounds familiar, it might be time to consider upgrading to a modern accounting solution.
Choosing the Right Accounting Solution for Your Nonprofit
Before making a switch, it’s essential to evaluate all available options, including on-premises, hosted, and cloud-based solutions. But how do you determine which one is best suited for your nonprofit?
No matter which solution you choose, your organization should benefit from:
Faster financial closes
Easier regulatory compliance
Reduced manual work
Real-time visibility and reporting
A reliable service level agreement
Expert Insights to Guide Your Decision
Navigating the nonprofit accounting software landscape can be challenging. Understanding the strengths and limitations of different financial management systems is crucial in making an informed decision.
This comprehensive guide explores:
Why most financial management systems fail to deliver accurate, timely financial information
Six key questions every nonprofit should ask before transitioning to a cloud-based financial solution
How evaluating software for cloud-based solutions differs from traditional systems
Find out how the right solution can streamline financial operations and support your nonprofit's mission by accessing the Nonprofit Accounting Software Buyer’s Guide.
0 notes
Text
Proper financial management is critical for both individuals and businesses aiming to achieve stability and growth. Tax and accounting services offer a comprehensive approach to managing finances effectively.
0 notes
Text
10 Essential Bookkeeping Tips To Keep Your Business Finances In Check
Introduce the importance of accurate bookkeeping for business success, emphasizing how it helps track income, manage expenses, and maintain a clear picture of financial health. Mention that whether you’re a small business owner or managing a large corporation, good bookkeeping practices are essential.
Outline:
Separate Personal and Business Finances Explain the importance of having separate accounts to avoid confusion and simplify tax time.
Track Every Expense Describe how tracking every expense, no matter how small, adds up to a more accurate financial picture.
Automate Where Possible Suggest using bookkeeping software to automate data entry and reduce human error.
Stay on Top of Invoicing Offer tips on creating a consistent invoicing system to improve cash flow.
Schedule Time for Weekly Financial Review Encourage readers to set aside time each week to review financial reports.
Keep Your Receipts Organized Provide ideas for organizing receipts digitally, making it easier for audits and tax filing.
Understand Basic Accounting Principles Briefly explain terms like debits, credits, and accrual vs. cash accounting.
Prepare for Tax Time Throughout the Year Suggest setting aside funds for taxes and keeping accurate records to ease tax season stress.
Work with a Professional Accountant Explain the benefits of working with an accountant, especially as the business grows.
Regularly Backup Financial Data: Recommend secure data backup solutions to prevent data loss.
Conclusion: Wrap up by emphasizing how consistent bookkeeping habits lead to financial clarity, better decision-making, and business growth. Encourage readers to implement these tips right away for a more organized financial future.
0 notes
Text
The Power of Data Analysis and Integration for Your Business: Why You Need to Start Now
To keep your trucking business financially healthy, it’s crucial to track revenue and expenses accurately. Data analysis helps you monitor income from various brokers and customers, and keep a close eye on every cent of your expenses. By integrating financial data from multiple sources, you get a clear picture of your cash flow, enabling you to make smart decisions. We touched on this topic once…

View On WordPress
#automated reminders#brokers#business#business operations#cash flow#cash flow management#credit reports#Creditworthiness#customers#data analysis#data integration#expense tracking#financial data#financial health#financial metrics#Freight#freight industry#Freight Revenue Consultants#income sources#logistics#operational data#payment patterns#payment terms#profitability#small carriers#strategic decisions#timely payments#track expenses#track revenue#Transportation
0 notes
Text

15 Must-Visit Sites to Follow the Latest Financial Industry Trends
Navigating the vast sea of financial information on the internet can be overwhelming. With countless websites offering insights and analyses, it's crucial to know where to turn for reliable and up-to-date financial trends. To aid in this quest, we've compiled a list of the top 15 sites that are invaluable resources for anyone looking to stay informed about the financial world.
FinChat.io: Touted as the best overall for fundamentals data, FinChat.io provides investors with extensive historical financial data and company-specific key performance indicators.
Bloomberg Businessweek: A staple in the business world, Bloomberg Businessweek delivers information and interpretation on global business events.
Reuters: Known for its speedy and accurate news reporting, Reuters is a go-to for financial professionals and casual readers alike.
Forbes: Forbes is a leading source of reliable business news and financial information, offering in-depth coverage and analysis.
Wall Street Journal — The Wall Street Journal is a must-read for its trusted news, business insights, and financial information.
Investing.com — This site provides a wealth of information, including real-time data, financial tools, and market analysis.
Kiplinger — Kiplinger is known for its practical advice on managing money and achieving financial security.
This Is Money — A comprehensive site that covers personal finance, investment news, and market trends.
The Street — The Street offers financial news, analysis, and stock market data for the savvy investor.
Financial Times — The Financial Times is internationally recognized for its authoritative news and analysis on global financial markets.
CNN Money — CNN Money is a prime destination for those looking to understand how news affects their finances.
CNBC — CNBC provides international business news coverage and real-time financial market updates.
MarketWatch: MarketWatch is a leading innovator in business news, personal finance information, and market insights.
The Economist — The Economist offers authoritative insight on international news, politics, business, finance, science, and technology.
The Motley Fool — The Motley Fool helps investors stay informed with leading insight and analysis of the stock market.
These websites are not just data sources; they are gateways to understanding the complexities of the financial markets. They offer a range of perspectives, from macroeconomic trends to individual stock analysis, making them essential tools for anyone serious about finance. Whether you're a professional investor or just starting to explore the financial landscape, these sites provide the insights needed to make informed decisions. Happy investing!
0 notes
Text
D&B Direct for Finance
Assess risk and creditworthiness in real-time
D&B Direct for Finance is an application programming interface (API) that integrates Dun & Bradstreet insight and capabilities directly into your systems and workflows and cuts through complexities to reduce friction in your overall quote-to-cash process.
0 notes
Text
Organizing Your Finances: The Importance of Financial Data Categorization
Haynes Bookkeeping Solutions offers expert financial data categorization services to help you streamline your financial management. Our dedicated team ensures that your financial data is accurately categorized, providing you with a clear overview of your finances. By categorizing your financial data, you can easily track your income, expenses, and investments, enabling you to make informed financial decisions.
0 notes
Text
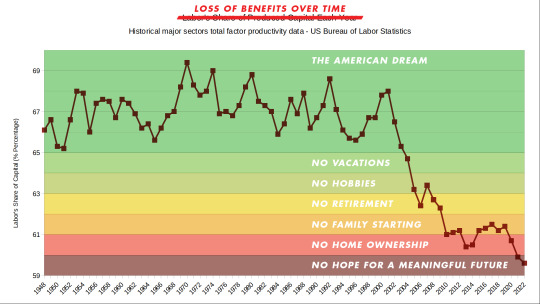
One more way to frame our current reality. But go ahead and tell me the economy is strong one more time.
#economy#capitalism#data is beautiful#financial data#late stage capitalism#no vacations#no hobbies#no retirement#no family#no home#no hope#the American dream#people die in the margins
5 notes
·
View notes
Text
Polkadot's Price Movement Indicates a Bullish Trend, Analysts Forecast an Upsurge
Polkadot (DOT) is currently experiencing a significant surge of around 16%, marking a potential shift towards a bullish trend. This positive movement is exemplified by its breakthrough of a key descending trend line, a notable indicator pointing towards a possible uptrend. Analyst Rekt Capital highlights the importance of establishing a strong foothold in the orange zone above, as failure to do so may impact the ongoing rebound trajectory illustrated by the blue path.
The chart analysis also emphasizes the relevance of specific horizontal levels that denote critical support and resistance points, playing a pivotal role in understanding DOT's price dynamics. Further insights include potential price targets and the percentage gains needed for specific milestones. Notably, the chart suggests the likelihood of a retracement following the testing of a significant resistance level, as indicated by an upward blue arrow followed by a downward red arrow.
The Fibonacci retracement levels contribute significantly to the analysis, with the 1.0 level around $7.4725 standing out. Traders closely monitor this level for potential signs of trend reversals or continuations. Additionally, the chart outlines a typical market pattern known as the "ABC" correction or "1-2-3" pattern, involving an initial uptick, a retracement, and subsequent upward movement.
As of the latest financial data, DOT's value stands at $7.22, reflecting a 1.59% increase over the past day. While this uptick supports the overall bullish sentiment, investors are advised to remain attentive to key resistance levels and potential retracements, contributing to the dynamic landscape that positions DOT as a cryptocurrency to watch in the coming days.
#Polkadot#DOT#financial data#bullish sentiment#market participants#technical analysis#key resistance levels#dynamic scenario#cryptocurrency#cryptotale
0 notes
Text
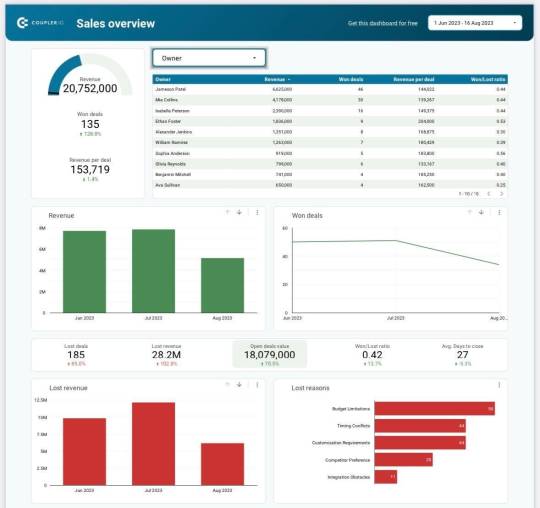
Explore 10 Company Financial Dashboards with Examples & Free Templates
This article presents a variety of financial dashboards, ranging from a CFO financial dashboard to a revenue overview and cashflow forecast. These dashboards are designed to assist you in comprehending your financial data effectively.
Among them, some serve as inspiration for crafting a personalized dashboard, while others are pre-made templates ready for immediate use. The latter enables you to effortlessly visualize your financial data within minutes. Additionally, we will guide you on automating your financial dashboard reporting, ensuring that your dashboards remain current and ready for analysis.
10 financial dashboard examples
1. SaaS financial dashboard + template
Utilize this dashboard to:
Discern the key drivers influencing financial outcomes
Identify current and potential obstacles
Examine the impact of sales on revenue generation
Monitor the evolving dynamics of revenue over time
Investigate the causes of revenue loss
Fine-tune your strategy to enhance financial performance
This dashboard is available as a free template for different apps:
Financial dashboard template for HubSpot
Financial dashboard template for Pipedrive
Financial dashboard template for Salesforce
2. Billing overview dashboard + template
Similar to contemporary financial reporting dashboards, this visually presented report is automatically updated, interactive, and conducive to analysis. It empowers you to:
Delve deeply into your data
Employ diverse filters and delve into specific details
Real-time monitoring of billing statuses
Recognition of top-performing projects and clients
Efficient billing management
Analysis of profits over time from different perspectives
This Billing overview dashboard is available as a free template.
3. CFO financial dashboard + template
Utilizing this template for a financial reporting dashboard, you can:
Track near-real-time revenue growth
Discern the top-performing products
Maintain a comprehensive record of invoices
Analyze financial data for actionable insights
Formulate data-supported projections and plan for the future
This Financial dashboard for QuickBooks is available as a free template.

4. Ecommerce financial reporting dashboard + template
Utilize this dashboard to:
Gain insights into the overall business performance of your store
Analyze and enhance order management for revenue maximization
Filter orders based on country and source
Filter orders according to their financial status (paid, pending, refunded, etc.)
Foster alignment among your finance, marketing, and sales teams to enhance overall strategy
This Ecommerce financial reporting dashboard is available as a free template.
5. Financial performance dashboard
Utilize this dashboard to:
Monitor revenue in relation to established targets
Swiftly observe shifts in growth trends
Compare actual revenue to your projections
Assess overall financial health at a glance
This dashboard was built in Tableau by MergeYourData and designed to serve as a cockpit, giving several graphs and multiple scorecards presenting various aspects of financial performance.
6. Cashflow tracking dashboard
With this dashboard, you can:
Track the dynamics of cashflow over time
Visualize the contribution of various products to cashflow (annual/monthly subscriptions)
Identify trends and patterns
Perform time-over-time analysis
This type of dashboard example is a Cashflow report built in PowerBI.
7. MRR breakdown dashboard
With this dashboard, you can:
Monitor and analyze Monthly Recurring Revenue (MRR) data
Uncover trends and significant factors impacting MRR
Perform month-over-month comparison analysis
Keep tabs on crucial metrics like churn or reactivation
Extract valuable insights to integrate into your strategy
Incorporate financial analytics into your regular processes
You can check this example of MRR breakdown dashboard for a better understanding.
8. Product revenue dashboard
Utilize this product Key Performance Indicator (KPI) dashboard to:
Monitor and analyze product revenue
Effectively manage churn
Gain deeper insights into Monthly Recurring Revenue (MRR) trends
Conduct financial analysis related to product performance
9. Daily cashflow forecast dashboard + template
With this template, you can:
Create forecasts for various time frames
Perform cashflow analysis
Develop strategies to attain the projected outcomes
Make well-informed decisions
This Ecommerce financial reporting dashboard is available as a free template.
10. High-level revenue and profit dashboard
Utilize this dashboard to:
Monitor essential metrics such as total revenue, gross profit margin, net profit margin, and more
Track month-to-month variations
Access the latest financial data around the clock
Maximize decision speed with effective financial dashboards. These dashboards serve diverse purposes, acting as reporting tools, KPI monitoring cockpits, and data analysis instruments. To be genuinely effective, a dashboard must be tailored to specific goals and audience preferences and live auto-updating with interactive features like filters and drill-downs. Including only relevant metrics, an excellent financial dashboard becomes a powerful tool for decision-makers, facilitating KPI monitoring, process control, progress tracking, and more.
This article showcases examples of automated finance dashboards with real-time data, providing actionable insights and encouraging a data-driven approach. Apart from financial, click here to learn how to build other types of SaaS dashboards and unlock your data’s full potential for informed decision-making.
#dashboards#dashboard templates#data analytics#data visualization#reporting#finance#financial data analytics#financial dashboards#financial reporting#financial data
0 notes
Text
The Calcbench Q3 Quarterly Wrap-Up
Good news for analysts everywhere just before the Thanksgiving holiday: Calcbench has released its Q3 2023 Wrap-Up, so you have something to read surreptitiously on your phone while the in-laws gripe about politics.
We release our wrap-ups at the end of every earnings season (you probably figured out that part already) to study broad trends in revenue, net income, capital spending, and other important metrics. This quarter’s report tallies up the data for more than 3,300 non-financial firms — not quite every filer that’s out there, but more than enough to give us a sense of this quarter’s corporate performance.
Most notably, we saw an 11.8 percent increase in net income compared to the year-earlier period. That compares to more modest increases in capital expenditures (up 3.4 percent) and inventory (up 1.7 percent), and overall revenue actually edged downward by 1.1 percent. See Figure 1, below.
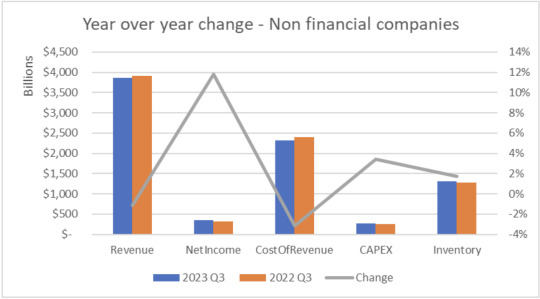
(To be clear, all firms included in this report filed earnings for Q3 in both 2023 and 2022, for the most apples-to-apples comparison.)
The Q3 Wrap-Up also examines three specific sectors: retail, software, and chemicals, to get a sense of how performance varied from one sector to another.
Sometimes that performance varied by a lot. The 230 companies in our retail group, for example, reported a year-over-year jump in net income of 148.4 percent, while capital expenditures dropped 11.2 percent. Various specific companies had equally impressive numbers. Walmart ($WMT) revenue rose 5 percent; Amazon.com ($AMZN) net income jumped from $2.9 billion to $9.9 billion.
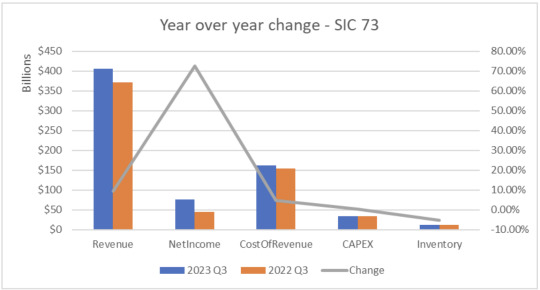
Meanwhile, the software sector saw year-over-year revenue rise 9.5 percent, while net income rose 72.7 percent — led, not surprisingly, by tech giants such as Facebook ($META), Google ($GOOG), and Microsoft ($MSFT), which all reported multi-billion dollar increases in profit. See Figure 2, below.
The highlights in this report are a great place to start when analyzing Q3, but they certainly do not tell individual stories of specific companies. For example, Berkshire Hathaway ($BRKA) reported a year-over-year revenue of $16.3 billion (yay!) and a decrease in net income of $9.8 billion (yuck). To find out more about the specific companies you follow, you’ll need to do more digging and reading in the footnote disclosures.
For example, did you know Berkshire reported investment losses of $24.1 billion in the quarter? We did, because our Interactive Disclosure tool lets you dig into the footnotes and bring those important kernels of insight to the surface in short order.
Try Calcbench’s suite of products to get more data and details yourself!
0 notes
Text

flickr
Interoperability in healthcare refers to the seamless exchange and use of health information between different systems, applications, and stakeholders. It enables disparate healthcare systems to communicate and share vital patient data in a standardized and meaningful way.
0 notes