#Grafana
Explore tagged Tumblr posts
Visit Tumblr Blog
Explore Tumblr blogs with no restrictions, modern design and the best experience.
Last Seen Tumblr Blogs


Fun Fact
Tumblr was named as a finalist in Lead411’s New York City Hot 125 in Aug 2010.
Text
2022-2025
Hartnäckiger Komfort im Kangoo
Im November 2022 kaufen wir einen gebrauchten Renault Kangoo Z.E. (Baujahr 2019) für unseren Fuhrpark. Genutzt wird er überwiegend für Transporte auf dem Gelände. Zu dem Zeitpunkt haben wir noch keine Wallbox, so dass wir ihn schlicht an der Schuko-Steckdose laden. Genau genommen haben wir die Wallbox schon, aber niemand findet es auch nur annähernd wichtig, sie zu installieren. Es geht ja auch so.
So ungefähr zum Ablauf der Wallbox-Gewährleistung mache ich mich doch daran, sie in Betrieb zu nehmen. Beim Kauf war mir wichtig gewesen, dass sie netzwerkfähig ist, ich dem Auto also per Modbus/TCP beim Laden zuschauen oder den Ladevorgang auch steuern kann. Wozu das gut sein könnte, weiß ich noch nicht, aber oft finde ich dann hinterher heraus, warum es interessant ist – wie in diesem Fall.
Die Daten landen via IOBroker und InfluxDB auf einem Grafana-Dashboard. Und so können wir ab September 2024 die Ladevorgänge bestaunen:

Links und rechts sind Ladevorgänge; was mich jedoch irritiert, ist das Gekräusel dazwischen. Es stellt sich heraus, dass das täglich morgens ab halb acht stattfindet.
Tatsächlich kann unser E-Kangoo im Vergleich zum Komfort-Chichi aktueller Elektroautos so ungefähr nix. Was er aber kann: täglich zu einer festen Zeit den Innenraum heizen, "Komfort-Funktion" nennt sich das. Gedacht ist das für Menschen, die täglich zur selben Uhrzeit losfahren: das Auto wird mit "Landstrom" geheizt, und man fährt mit vollem Akku und warmem Innenraum los. Andernfalls würde man im Winter nach dem Losfahren erst mal wertvolle Akkukapazität aufs Heizen verschleudern.
Wir brauchen diese Komfort-Funktion so überhaupt nicht, und mich ärgert der unnötige Stromverbrauch. Das Handbuch sagt, dass man den Lüftungsknopf bloß an eine bestimmte Stelle drehen muss, um das tägliche Heizen zu deaktivieren. Grafana zeigt jedoch, dass das keine Auswirkung hat. Das Autohaus sagt "na ja, wir können uns das mal anschauen". Anschauen bedeutet in dem Fall vermutlich: einmal das gesamte Armaturenbrett ausbauen und den Lüftungsschalter ersetzen. Das würde ganz schön teuer, fürchte ich.
Wir frickeln eine Weile daran rum, zwischendurch kommt mal ein Kollege und sagt: "ist erledigt, ich hab' das jetzt auf null gestellt". Auf null Uhr hat er den Heizzeitpunkt verschoben, na ja. Es heizt natürlich weiterhin.

Weil nun Wallbox und IOBroker eh schon miteinander sprechen, hinterlege ich einen Zeitplan, der der Wallbox sagt: tagsüber darfst du bis zu 32 Ampere abgeben, zwischen 22 und 2 Uhr jedoch nichts. Das Zeitfenster wähle ich großzügig, weil bei Sommerzeitumstellung bestimmt niemand die Auto-Uhr stellen wird etc. Leider heizt der Kangoo weiter, Tag für Tag, völlig unbeeindruckt:

Es folgen ein paar weitere Monate Gefrickel, auch im Kontakt mit dem Hersteller der Wallbox, der meine Nachrichten nur unwillig beantwortet, die Gewährleistung sei ja schon abgelaufen. Außerdem sei IOBroker nicht auf der Liste unterstützter Energiemanagement-Systeme.
Ab April 2025 beginne ich, unseren Eigenverbrauch zu optimieren, indem ich versuche, der Wallbox beizubringen, immer nur so viel Strom abzugeben, wie wir gerade an Solarstrom übrig haben. Dabei stoße ich schließlich auf den banalen Fehler, weswegen die Wallbox die Nachtabschaltung ignoriert. Man darf den Vorgabewert nicht als "bestätigt" senden, in dem Fall denkt sich die Wallbox nämlich "wenn es bestätigt ist, hat's schon jemand anderes erledigt, also muss ich mich nicht mehr drum kümmern". Von unbestätigten Befehlen fühlt sie sich dagegen angesprochen und damit ist der unerwünschte Komfort endlich ausgehebelt:

(Lennart Schütz)
#Elektromobilität#Wallbox#Modbus/TCP#Grafana#Lennart Schütz#Heizung#Komfort#IOBroker#Renault Kangoo Z.E.#Workaround
7 notes
·
View notes
Text
observability tools 可觀察性工具推薦12個最佳監控軟體
可觀察性工具 對於即時洞察系統運作狀況和效能至關重要。它們能夠幫助您精準地監控、排除故障和分析系統以便快速識別和解決問題。您可以借助合適的可觀測性工具即可從檢測到問題到了解其根本原因。
小編在此探討了目前市面上 12 款最佳的可觀測性工具,涵蓋從解決方案到專用開源方案。您將了解每種工具的優勢、如何將其整合到您的環境中以及需要考慮的關鍵特性讓您可以自信地根據自身需求、技術堆疊和預算選擇最合適的工具。
了解更多:https://www.taki.com.tw/blog/observability-tools-%e5%8f%af%e8%a7%80%e5%af%9f%e6%80%a7%e5%b7%a5%e5%85%b7%e6%8e%a8%e8%96%a612%e5%80%8b%e6%9c%80%e4%bd%b3%e7%9b%a3%e6%8e%a7%e8%bb%9f%e9%ab%94/
#observability tools#可觀察性工具#Grafana#prometheus#loki#datadog#New Relic#Dynatrace#Splunk Observability Cloud#ELK Stack#Netdata#Honeycomb#Jaeger#Zabbix
0 notes
Text
📊 Monitoring Systems and Services with Prometheus: Real-Time Insights for Modern Infrastructure
In today’s fast-moving DevOps world, real-time monitoring is not optional—it’s essential. As systems become increasingly dynamic, cloud-native, and microservices-driven, traditional monitoring solutions often fall short. That’s where Prometheus, an open-source monitoring and alerting toolkit, shines.
🚀 Why Prometheus?
Prometheus, a project under the Cloud Native Computing Foundation (CNCF), is built for reliability, scalability, and multi-dimensional monitoring in dynamic environments. It’s the go-to solution for Kubernetes environments and modern microservices architectures.
Key Benefits:
Pull-based metrics collection via HTTP
Powerful multi-dimensional data model
PromQL (Prometheus Query Language) for flexible queries
Easy integration with Grafana for dashboards
Built-in alerting with Alertmanager
🔍 Core Components of Prometheus
1️⃣ Prometheus Server – Scrapes and stores time-series data 2️⃣ Exporters – Collect metrics from services, systems, and applications (e.g., Node Exporter, Blackbox Exporter) 3️⃣ Pushgateway – Allows ephemeral jobs to push metrics 4️⃣ Alertmanager – Manages alerts and routes notifications (email, Slack, PagerDuty) 5️⃣ Grafana – Visualizes Prometheus data in customizable dashboards
Setting Up Prometheus (Basic Workflow)
Install Prometheus on your server or Kubernetes cluster.
Configure the prometheus.yml file to define scrape jobs and targets.
Deploy exporters on the target systems (e.g., node_exporter for system metrics).
Use PromQL to query real-time data and analyze performance metrics.
Set alert rules and connect Alertmanager to handle incidents.
📈 What Can You Monitor?
System metrics (CPU, memory, disk I/O)
Application metrics (API latency, error rates)
Kubernetes cluster health
Database performance
Uptime checks & network availability
💡 Real Use Case: Prometheus + Kubernetes
Prometheus excels in containerized environments. By integrating with Kubernetes, it can automatically discover services, collect pod-level metrics, and scale horizontally with minimal overhead. It’s often paired with Kube-State-Metrics, cAdvisor, and Grafana for a full-stack observability setup.
✅ Final Thoughts
Prometheus isn’t just a tool—it’s a monitoring ecosystem designed for modern infrastructure. Whether you're managing bare metal, VMs, or Kubernetes clusters, Prometheus gives you the power to observe, alert, and act with precision.
By combining it with Grafana and Alertmanager, you can transform raw metrics into actionable insights and build a truly resilient system.
📖 Start building your monitoring stack today with Prometheus — and never fly blind again.
For more insights, follow: Hawkstack Technologies
#Prometheus#Monitoring#DevOps#Observability#Grafana#Kubernetes#CloudNative#Alerting#OpenSourceTools#SRE#Metrics#RedHat#MonitoringWithPrometheus#HawkstackTechnologies
0 notes
Text
Home Automation – My 2025 Update 智能家居計劃 – 2025 年回顧
A latest upgrade to my Home Automation works.
回顧我過去數年做過的家居自動化工作。 Visit my new WordPress site at My New Chapter In Life @UK for the full post. 請到我的新網誌 My New Chapter In Life @UK 瀏覽全文 Copyright © MyNewChapterInLife / MyNewChapterInLife/mynewchapterinlife.blog, 2025 All Rights Reserved.Unauthorised use and/or duplication of this material without express and written permission from this site’s…
#BNO Visa#移民#Energy Meter#ESP32#英國#Grafana#Hilderbrand#Home Assistant#Home Automation#Immigration#InfluxDB#Octopus Energy Agile Plan#Octopus Home Mini#Smart Meters#UK
1 note
·
View note
Text
Home Automation - My 2025 Update 智能家居計劃 - 2025 年回顧
#BNO Visa#DCC#docker#Energy Meter#ESP32#grafana#Hilderbrand#Home Assistant#Home Automation#InfluxDB#Octopus Energy Agile Plan#Octopus Home Mini#Ryzen#Smart Meters#UK#移民#英國
0 notes
Text

#Guess
Can you recognize this logo?
What’s your guess?
💻 Explore insights on the latest in #technology on our Blog Page 👉 https://simplelogic-it.com/blogs/
🚀 Ready for your next career move? Check out our #careers page for exciting opportunities 👉 https://simplelogic-it.com/careers/
Comment Below👇
#LogoChallenge#TechTrivia#GuessTheLogo#Logo#Prometheus#SimpleLogicIT#MakingITSimple#Grafana#OpenSource#Monitoring#Data#RealTimeData#SimpleLogic#MakeITSimple#GuessGame#TechLogo
0 notes
Text
Advance Real-Time monitoring Tools: Prometheus and Grafana.

0 notes
Text
Visualize Keploy Test Data in Grafana for Real-Time Monitoring

In today's fast-paced development environment, efficient monitoring and visualization of test results are essential for ensuring the quality of your application. Keploy, a zero-code testing tool, simplifies test generation and integration, but how do you effectively monitor and analyze the test data Keploy generates?
This is where Grafana, a powerful open-source analytics and monitoring platform, comes into play. In this blog, we'll explore how you can set up a Grafana dashboard to visualize Keploy test data, enabling you to quickly assess the health of your tests and debug issues efficiently.
What is Grafana?

With Grafana, you can create real-time dashboards to track everything from server performance to test results, all in one place. By combining Grafana with Keploy, you can visually monitor your test suites and gain insights into test performance, failures, and trends over time.
What is Keploy?
Keploy is an open-source, zero-code testing platform that generates and executes test cases by observing real-world network traffic. It captures API requests, responses, and user interactions to automatically create test cases without requiring developers to write test scripts.
Brownie points out that it can integrate with existing CI/CD pipelines to enable end-to-end, integration, and unit testing.
Why Integrate Keploy with Grafana?
While Keploy automates test creation and execution, visualizing the test results can sometimes be challenging, especially with large test suites. Integrating Keploy with Grafana allows you to:
Monitor test results in real-time: Get immediate insights into your test runs.
Visualize test trends: Track how your tests perform over time, including pass/fail rates and test coverage.
Analyze test failures: Quickly identify patterns and potential areas of improvement.
Share insights: Easily share dashboards with team members, providing transparency and accountability across your testing process.
Step-by-Step Guide to Using Grafana with Keploy
Step 1: Install Grafana
If you don't have Grafana yet, follow these steps:
Use the docker to start Grafana service:docker run -d -p 3000:3000 --name=grafana grafana/grafana-enterprise
Access Grafana via http://localhost:3000/ and log in with the default credentials (admin/admin).
Step 2: Set Up Keploy to Generate Test Data
Before integrating Grafana, you need to ensure that Keploy is generating and storing test reports. Keploy captures API traffic to create tests and stores the test results, which can then be visualized in Grafana. I am using a sample app based on Mux router with Postgres database : - https://github.com/Sonichigo/mux-sql#Start Postgres docker-compose up -d postgres #Build App binary go build -cover
You can generate test cases with Keploy by running:keploy record -c "./test-app-product-catelog"
This command captures the real-world traffic from your application and creates test cases based on it. We can make API Calls using Hoppscotch, Postman or cURL command and keploy would be able to capture those calls to generate the test-suites containing testcases and data mocks.
To run the test cases we created earlier and generate our report, let’s run :keploy test -c "./test-app-product-catelog"
This will execute the test cases and generate test reports.
Step 3: Export Keploy Test Data
Next, you need to export the test data generated by Keploy into a format that Grafana can read. Most common being JSON format, so let’s export the test reports to JSON using JSON Converter.
Step 4: Configure Grafana Data Source
Grafana supports a wide range of data sources, and you can use one based on how you've exported your Keploy data. If you're using JSON or CSV, you can set up Grafana Loki or another time-series database that supports the format. If you store test reports in MySQL or Prometheus, configure Grafana to fetch data from that source.
Go to Settings > Data Sources in Grafana.
Select the appropriate data source type (e.g., MySQL, Prometheus).
Configure the connection by providing the necessary credentials and database details.
Test the connection to ensure that Grafana can pull data from your source.
Step 5: Create a Grafana Dashboard
Once the data source is set up, you can create a dashboard to visualize the Keploy test results.
Go to Create > Dashboard in Grafana.
Select Add a new panel.
Query the test data from your chosen data source.
Configure visualizations based on your needs. Some examples include:
Bar charts to display test pass/fail ratios.
Time-series graphs to track test execution times.
Tables to list failed tests and their details.
Customize the panels to reflect the key metrics you want to monitor, such as:
Total tests run
Passed/failed tests
Test duration
Coverage percentage
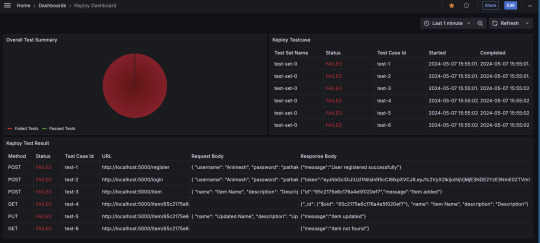
Alternatively, you can import the existing Keploy Dashboard on Grafana with everything already in place and just upload the JSON to view the metrics.
Step 6: Automating Keploy Test Data Updates
To keep your dashboard updated with the latest test data, you can automate the process of exporting Keploy reports and updating the Grafana data source. Set up a cron job or CI/CD pipeline step to regularly export Keploy reports.
Key Metrics to Track in Your Dashboard
Here are some useful metrics to include in your Grafana dashboard for Keploy:
Total Test Runs: The number of test executions over time.
Pass/Fail Ratio: A visual breakdown of successful vs. failed test cases.
Test Execution Time: The average time it takes for tests to run, helping identify slow-running tests.
Test Coverage: Percentage of code covered by the tests, which can help you identify areas lacking coverage.
Failed Test Cases: A detailed breakdown of the specific tests that failed, including error messages and stack traces.
Conclusion
Integrating Keploy with Grafana offers a powerful combination of zero-code test automation and real-time test visualization. By creating a Grafana dashboard for your Keploy test data, you can monitor the health of your application’s test suite, track key trends, and quickly respond to any issues that arise.
This setup not only saves time but also improves transparency and accountability across your testing process, enabling your team to make data-driven decisions with confidence. So, whether you're a developer, tester, or DevOps engineer, start using Grafana with Keploy to streamline your testing and monitoring efforts.
FAQs
What benefits does integrating Keploy with Grafana offer?
Integrating Keploy with Grafana provides real-time monitoring of test results, enabling you to visualize test trends, quickly spot failures, track test execution times, and assess test coverage. It also promotes transparency, helping teams make data-driven decisions and improve testing accountability.
How does Keploy generate test cases without writing code?
Keploy automatically captures network traffic and API interactions within your application to create test cases. This zero-code approach lets you generate comprehensive test suites by simply observing real-world user interactions, saving time and eliminating the need for manually written test scripts.
What kind of data sources can I connect to Grafana to view Keploy test data?
Grafana supports various data sources such as Prometheus, MySQL, CSV, and JSON. Depending on the format of the Keploy test data, you can configure Grafana to pull data from these sources, allowing flexible and customized visualization of test metrics.
Can I automate the process of exporting Keploy test data to Grafana?
Yes, you can automate the export of Keploy test data by setting up a cron job or adding a CI/CD pipeline step. This automation ensures that Grafana receives the latest test reports regularly, keeping the dashboard metrics up to date.
What are some key metrics I should monitor in my Grafana dashboard?
Useful metrics include Total Test Runs, Pass/Fail Ratio, Test Execution Time, Test Coverage Percentage, and specific details of Failed Test Cases. These metrics help assess the overall health of your tests, identify slow-running tests, and focus on areas requiring improvement.
Is there a pre-built Grafana dashboard for Keploy, or do I need to create one from scratch?
You can import an existing Grafana dashboard for Keploy by uploading the provided JSON file. This allows you to quickly set up a dashboard with default panels and visualizations, which you can further customize based on your specific testing needs.
0 notes
Text
Tech Links of the Month September 2024
Automate SAP cloud testing
Revolutionizing Software Testing: The Power of AI in Action
Grafana vs. Prometheus: Comparison and Differences
6 GitOps Tools You Should Know About in 2024
1 note
·
View note
Text
Seit Sommer 2024
Das Schlafzimmer ist zu feucht, der Kühlschrank ist zu warm, und die Gräser blühen zu stark
Es fing an mit ein bisschen Schimmel an einem Fensterrahmen. Ärgerlich, dabei lüften wir immer so gründlich. Oder? Wir besorgen uns für jedes Zimmer einen Sensor, der die Temperatur und Luftfeuchtigkeit anzeigt. Einen Überblick über das Klima in der ganzen Wohnung verschafft uns ein Grafana-Dashboard, in dem alle Sensordaten grafisch dargestellt werden. Ein Sensor wird im Kühlschrank platziert und soll uns helfen, ihn auf die ideale Temperatur einzustellen. Ein einziger CO2-Sensor steht im Flur und soll einen weiteren Einblick in die Luftqualität liefern (unsere Zimmertüren stehen typischerweise immer offen). Daten über das Wetter außerhalb der Wohnung erhalten wir über eine offene Wetterdaten-API.
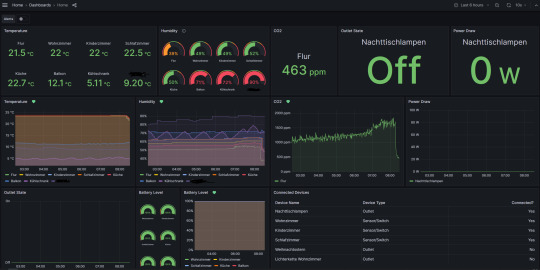
Das Dashboard wird von einem eigens dazu eingerichteten Raspberry Pi mit den Daten von den Messgeräten und der API befüllt. Wenn man schon mal alle Daten in einem Computer hat, kann man auch noch einen Telegram-Bot bauen, der uns mit einer hilfreichen Notification darauf hinweist, wann wir mal lüften sollten, und dann auch darauf, wann die Luft wieder ausreichend gut ist. Der Kühlschrank sagt jetzt auch bescheid, wenn er zu warm oder zu kalt wird, das ist unter anderem praktisch, weil manche Familienmitglieder nicht immer sorgfältig die Tür schließen.
Ob die Luft innendrin vom Lüften wirklich besser wird, hängt vor allem an der Kombination der Messwerte für Luftfeuchtigkeit und Temperatur sowohl drinnen als auch draußen. Man könnte ja kühlere, aber feuchtere Luft reinlüften. Eine Annäherung an die zu erwartende Verbesserung der Luft bietet der Taupunkt, den man anhand der Feuchtigkeit und Temperatur errechnen kann. Zusätzlich zum Dashboard und dem Telegram-Bot haben wir jetzt auch eine Übersichtsseite, in der zusätzlich zu den Messdaten der Taupunkt der Luft draußen und drinnen angezeigt wird. So kann eine positive oder negative Lüftempfehlung erzeugt werden, an der wir uns orientieren können.
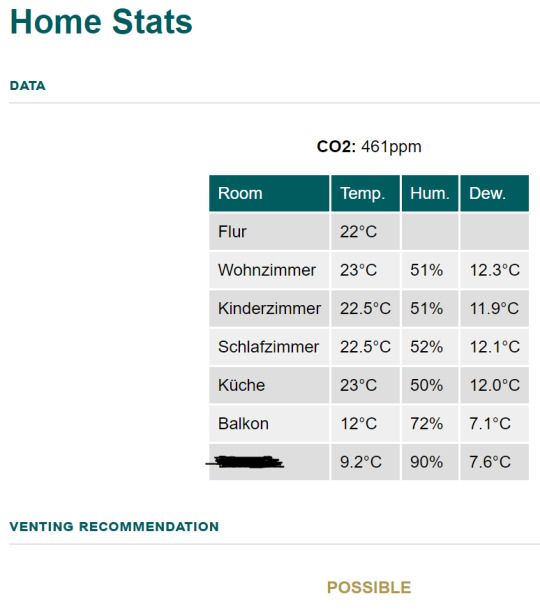
Ein Familienmitglied ist allergisch gegen bestimmte Pollen. Wenn der Wind ungünstig steht, fliegen beim Lüften die Pollen aus dem nahe gelegenen Naturschutzgebiet auf direktem Weg in die allergische Nase. Kein Problem, die Lüftempfehlung berücksichtigt ab sofort, welches Datum wir haben (jede Pollenart fliegt nur zu bestimmten Zeiten im Jahr) und aus welcher Richtung der Wind weht.
Ein einziges Lüftproblem bleibt ungelöst, und das sind die permanent quarzenden Nachbarn untendrunter. Social hacking (höflich fragen, ob sie uns zuliebe einmal am Tag vielleicht drei Minuten Pause machen könnten) war nicht erfolgreich. Einen Sensor für den Nikotingehalt oder die Gestankintensität der Luft haben wir nicht. Aber immerhin haben wir eine Strategie gefunden, um zu vermeiden, dass der Fensterrahmen wieder schimmelt. Die Messdaten werden übrigens bis auf weiteres abgespeichert, sodass wir im Zweifel der Vermieterin beweisen können, wie gewissenhaft wir ständig lüften.
(Alina Smithee)
8 notes
·
View notes
Text

Grafana Labs raises $270 million in funding http://dlvr.it/TCBqd5
0 notes
Text
Introducing The Metrics Exporter For Dell PowerStore

Metrics Exporter for PowerStore can help you unleash the “power” of your metrics and take your company to new heights. Acquiring real-time insights on metrics such as performance, capacity utilization, or power consumption becoming essential in the rapidly evolving world of IT infrastructure and services, and in certain situations, it can even set you apart from the competition.
Dell PowerStore
Dell Technologies has made available Metrics Exporter for Dell PowerStore, an open-source tool on their official GitHub page that allows users to extract metrics from their enterprise storage solution PowerStore and have them used by well-known third-party tools like Grafana, Prometheus, and Zabbix. This could be a strategy to maximize your IT operations by releasing the “power” of your storage metrics.
Visibility into your whole infrastructure environment is made possible by tracking indicators such as performance (IOPS/bandwidth/latency), capacity usage (available/used space), and power consumption (temperature/watts). Keep an eye on your surroundings to identify any capacity restrictions or performance bottlenecks. By determining which resources are oversaturated or underutilized, you may distribute resources more effectively and optimize them as needed.
Forecasting future storage requirements and analyzing existing data enable effective capacity planning. Last but not least, monitoring power usage enables businesses to reach their sustainability targets by optimizing for energy efficiency and cutting operating expenses. Making better decisions, increasing operational efficiency, and ensuring the efficient use of your IT infrastructure assets are all possible with the tool.
Metrics Exporter for Dell PowerStore is a tool for more than just tracking metrics. In order to maximize performance, enhance capacity utilization, reallocate resources according to need, and contribute to a more sustainable future, it can be a strategic asset that gives Dell’s clients the ability to make data-driven decisions. Unlock the “power” of your measurements to achieve unprecedented success for your company.
Overview of the Dell PowerStore Metrics Exporter
End-to-end visibility into crucial workloads is necessary for enterprise monitoring. High-level monitoring and alerting are required to inform the appropriate personnel about emerging trends or urgent problems that need to be addressed.
A multitude of performance measures are gathered by Dell PowerStore to assist you in managing and keeping an eye on your vital storage resources. For a more thorough look at PowerStore, you can simply check these metrics in CloudIQ and PowerStore Manager.
PowerStore can also be integrated with third-party open source applications for administration and monitoring. Zabbix and Grafana are two examples of enterprise monitoring systems that let you monitor different infrastructure components from a single pane of glass.
Making performance metrics public
Customers can enhance the metrics capabilities of PowerStore Manager or link it with widely used enterprise monitoring tools by using the Metrics Exporter for Dell PowerStore. Performance metrics from PowerStore may be consumed by enterprise monitoring systems like Zabbix and Grafana thanks to an open-source programme called the Metrics Exporter for Dell PowerStore. Performance metrics are captured by PowerStore Exporter by utilising the PowerStore REST API.
The well-known open-source event monitoring programme Prometheus receives the metrics that PowerStore Exporter collects and distributes. PowerStore performance data can be utilized directly for monitoring and alerting through Prometheus when it is stored in a Prometheus time-series database (TSDB). Alternatively, it can be used as a data source by well-known open-source Prometheus-supporting monitoring applications like Zabbix and Grafana.
PowerStore
Among the categories of PowerStore metrics that are accessible are:
Hard Drive with Battery
Fan on the network port
Energy source
Volume performance, capacity, and appliance performance
Savings of data
Zabbix illustration
Zabbix is used by numerous businesses, including Dell Technologies, to monitor their IT infrastructure. This is an illustration of how to get the PowerStore appliance IOPS through the PowerStore Exporter and see it in Zabbix.
This is but one illustration of Zabbix’s PowerStore appliance metrics. Zabbix can use any of the several dozen performance metrics that PowerStore offers.
For instance, Grafana
Another well-liked programme for making performance dashboards is Grafana. To get you started, the PowerStore Exporter comes with a sample dashboard.
Container Storage Modules: Enterprise applications are increasingly being run on the Kubernetes (K8s) platform. With Dell Technologies Container Storage Modules, PowerStore on K8s is supported by Dell Technologies. The Container Storage Module for Observability is one of these modules; it publishes data to Prometheus as well.
The PowerStore appliance and host storage statistics can be viewed on the same Grafana dashboard for Windows, Linux, and K8s environments in conjunction with the Metrics Exporter for Dell PowerStore.
In conclusion
For comprehensive business monitoring, Dell Technologies offers PowerStore integration for your preferred monitoring tool. You can monitor PowerStore and your other essential infrastructure from a single pane of glass by publishing PowerStore metrics to the well-liked open-source programme Prometheus.
Using PowerStore’s RESTful API, this exporter gathers metrics from several PowerStore systems. Grafana is supported for data visualization, and Prometheus or Zabbix is supported for data collecting. PowerStore REST API versions 1.0, 2.0, and 3.5, Zabbix version 6.0LTS, Prometheus version 2.39.1, and Grafana version 9.3.8 have all been used to test this exporter.
Read more on Govindhtech.com
#MetricsExporter#infrastructure#DellPowerStore#RestApi#prometheus#PowerStore#grafana#news#TechNews#technology#technologynews#technologytrends#govindhtech
0 notes
Text
0 notes
Text
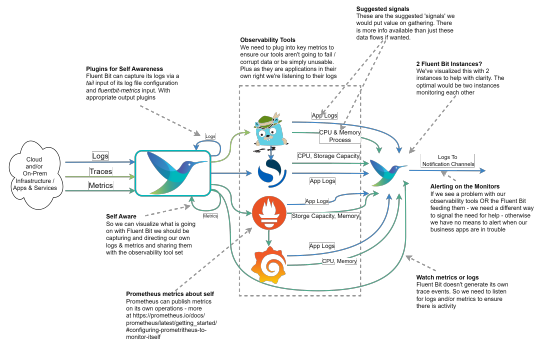
Observing the Observer (Fluent Bit monitoring)
In the Fluent Bit book I touch upon the point that we should be observing the observer. After all, if we don’t monitor our observability stack, then we’ll be operating blind and may never know until things go catastrophically wrong, and we’re getting complaints that production business solutions are down. One of the peer review comments was it would be really good to have a visual representation…
View On WordPress
0 notes
Text
Which is the most used monitoring tool for DevOps?
There isn't a single "most used" monitoring tool for DevOps, as it often depends on the specific needs and preferences of each organization. However, some widely used monitoring tools in the DevOps space include:
Prometheus: An open-source monitoring and alerting toolkit designed for reliability and scalability, particularly well-suited for dynamic cloud environments.
Grafana: Often used alongside Prometheus, Grafana is an open-source analytics and monitoring solution that allows for customizable dashboards and data visualization.
ELK Stack (Elasticsearch, Logstash, Kibana): Elasticsearch is a distributed search and analytics engine, Logstash is a data processing pipeline, and Kibana is a visualization layer. Together, they provide powerful log monitoring and analytics capabilities.
Datadog: A cloud-based monitoring and analytics platform that offers a wide range of features including infrastructure monitoring, application performance monitoring (APM), and log management.
New Relic: A comprehensive observability platform that provides insights into application performance, infrastructure monitoring, and real-time analytics.
Nagios: An open-source monitoring tool known for its robustness in monitoring IT infrastructure and network components.
Zabbix: Another open-source monitoring solution that offers network monitoring, server monitoring, and application monitoring capabilities.
Ultimately, the choice of monitoring tool depends on factors such as the specific requirements of your infrastructure, the scale of your operations, and your team's familiarity with the tooling.
#DevOps#MonitoringTools#Prometheus#Grafana#ELKStack#Datadog#NewRelic#Nagios#Zabbix#InfrastructureMonitoring#magistersign#support
0 notes
Video
youtube
how to give access of grafana dashboard to user
1 note
·
View note