#MS Graph API
Explore tagged Tumblr posts
Visit Tumblr Blog
Explore Tumblr blogs with no restrictions, modern design and the best experience.
Last Seen Tumblr Blogs


Fun Fact
Tumblr.com is the 103rd most visited website in the world.
Text
Optimizing Email Branding with BIMI
Have you ever noticed that some of the people and companies that email you have different icons? Somehow rather than initials, they are represented by a custom avatar in your message list. Usually, it is their corporate logo. BIMI which is an acronym for Brand Indicators for Message Identification is the protocol being used to achieve the effect. In a nutshell, the protocol requires that you…
#BIMI#Corporate Logos#Email Branding#Email Sender Avatars#Email Sender Icons#MS Graph API#Powershell
0 notes
Text
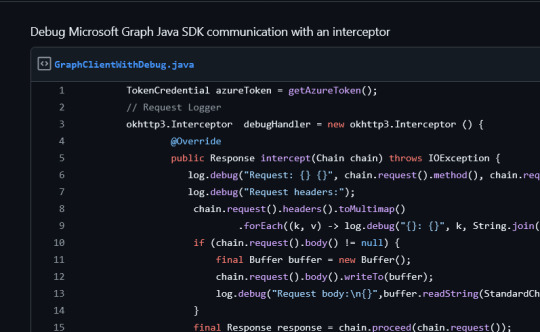
Tracing MS Graph SDK
Well, sometimes with the Microsoft Graph SDK I I feel like getting a glipse of the requests and responses send from/to the API.
And it is possible to add debugging by adding a HTTP interceptor.
Here is just a recipe on how I added it in case it helps you: https://gist.github.com/xmanoel/84828c86d03d3d4c2ff892a6e0ca69ba
0 notes
Text
Microsoft Dynamics 365 CRM Training | MS Dynamics CRM Training
How Canvas Apps Improve Dynamics 365 CRM Customization
Introduction
Microsoft Dynamics CRM Training Customization to streamline customer relationships, sales, and service processes. However, standard CRM functionalities may not always meet unique business needs. This is where Canvas Apps for Dynamics 365 CRM come in. These low-code applications allow businesses to customize CRM interfaces, automate workflows, and create tailored solutions without requiring extensive coding knowledge.
What Are Canvas Apps in Power Apps?
Canvas Apps, part of Microsoft Power Apps for CRM, provide a drag-and-drop interface to build custom applications. Unlike Model-Driven Apps, which follow a structured data model, Canvas Apps offer complete UI flexibility, allowing users to design screens, integrate data sources, and build applications that fit specific business processes.
Key Features of Canvas Apps
Drag-and-drop design interface for easy customization. Seamless integration with Dynamics 365 CRM, SharePoint, Excel, and third-party applications. Responsive mobile and desktop applications for on-the-go access. Built-in AI capabilities to enhance decision-making.
By using Canvas Apps for Dynamics 365 CRM, businesses can create custom CRM dashboards, automate workflows, and improve data management.

How Canvas Apps Improve Dynamics 365 CRM Customization
1. Customizing CRM Interfaces for a Better User Experience
One of the biggest limitations of traditional MS Dynamics 365 CRM Customization is UI rigidity. Standard CRM screens may not always match business workflows, leading to inefficiencies and user frustration.
Canvas Apps allow businesses to design custom UI elements based on their specific needs. Users can create interactive dashboards, custom data entry forms, and optimized navigation experiences. With a touch-friendly and mobile-responsive design, employees can access CRM data seamlessly on any device.
This results in a more intuitive and user-friendly Microsoft Dynamics CRM Training system, improving productivity and adoption rates.
2. Automating Workflows for Improved Efficiency
Manual data entry and repetitive tasks can slow down CRM operations. Dynamics 365 CRM Workflow Automation with Canvas Apps helps businesses streamline processes and reduce errors.
Create automated lead tracking systems to update sales records in real-time. Build approval workflows that trigger emails and notifications based on CRM actions. Integrate with Power Automate to execute tasks like data validation, invoice generation, and follow-up scheduling.
By leveraging Microsoft Power Apps for CRM, businesses can eliminate inefficiencies and focus on high-value tasks.
3. Enhancing Data Visualization and Reporting
CRM systems collect vast amounts of customer, sales, and service data. However, without proper visualization tools, extracting insights can be challenging.
Canvas Apps enable real-time data dashboards, displaying insights using charts, graphs, and reports. Users can customize CRM views to display only relevant metrics, improving decision-making. Integration with Power BI allows advanced analytics, predictive modeling, and KPI tracking.
By using Canvas Apps for Microsoft Dynamics CRM Online Training, organizations gain better data control and reporting capabilities.
4. Extending CRM Functionalities with Third-Party Integrations
Every business relies on multiple tools beyond CRM, such as ERP systems, HR platforms, and marketing automation tools. Canvas Apps bridge the gap by enabling seamless integrations.
Connect CRM with Microsoft Teams, Outlook, SharePoint, and SAP. Fetch and update records from SQL databases, Excel, and third-party APIs. Use AI-driven chatbots within CRM for automated customer interactions.
These integrations enhance CRM functionality, ensuring a unified and connected business ecosystem.
5. Mobile Accessibility for On-the-Go Productivity
Sales and service teams often need Microsoft Dynamics 365 Training Courses access outside the office. Canvas Apps provide a mobile-first solution to keep employees connected.
Sales reps can update leads, log calls, and check customer history from their mobile devices. Field service agents can capture on-site data, generate invoices, and manage appointments. Managers can approve workflows, view performance dashboards, and make data-driven decisions remotely.
With Canvas Apps for Dynamics 365 CRM, organizations enable mobile workforce efficiency like never before.
Conclusion
Canvas Apps revolutionize MS Dynamics 365 CRM Customization by offering flexibility, automation, and enhanced user experiences. With Dynamics CRM Online Training custom UI, automated workflows, real-time data visualization, and mobile accessibility, businesses can unlock the full potential of their CRM systems. By leveraging Microsoft Power Apps for CRM, organizations can increase efficiency, improve customer interactions, and drive better business outcomes.
Trending Courses are : D365 Functional (F & O), Prompt Engineering, Generative AI (GenAI), Microsoft Dynamics AX Retail Management.
Visualpath is the Leading and Best Software Online Training Institute in Hyderabad. Avail complete Microsoft Dynamics CRM Certification Worldwide. You will get the best course at an affordable cost.
WhatsApp: https://wa.me/c/917032290546
Visit: https://www.visualpath.in/online-microsoft-dynamics-crm.html
#D365#MSDynamics#Dynamics365#Microsoft#Education#visualpath#softwarecourses#dynamics#dynamics365crm#demovideo#microsoftpowerapps#ITCourses#ITskills#MicrosoftDynamics365#onlinetraining#powerappscrm#CRM#software#student#NewTechnology#career
0 notes
Text
AMD and ONNX Launch TurnkeyML Toolchain for Model Agility
AMD and ONNX with TurnkeyML
With the rise of generative AI models that can produce words and synthesize visuals, machine learning and artificial intelligence are constantly evolving. New models constantly challenge what is possible in this ever-changing sector. Though intriguing, this presents a major obstacle for model repositories to remain current. The main problem is with the upkeep and consumption of these models. The state-of-the-art models might fast become outdated as the field develops because they are unable to keep up with newer, more efficient structures. This difficulty is exacerbated by the many and constantly growing amalgamation of hardware backends, software stacks, and model precisions, all of which contribute to the intricacy of the model management procedure.
What the ONNX ecosystem discovered is that a more dynamic strategy to automating the ongoing integration of these novel, state-of-the-art model architectures is required. By making the newest models easily accessible and tailored for a range of platforms and applications, this is essential to allowing the community to fully utilize the promise of these breakthroughs.
Presenting TurnkeyML:
AMD is pleased to provide TurnkeyML, an open-source toolchain intended to enhance the way they handle AI models for inferencing, in order to address these issues in partnership with the ONNX community. With the help of TurnkeyML, you can quickly and easily integrate any open-source PyTorch model, optimize it, and run it on a variety of hardware targets. Additionally, the user is able to see through all of this functionality.
TurnkeyML’s strength is its automation of open-source AI model import and pre-processing, which saves a tonne of time and work when integrating the models into the ONNX Model repository. The user can also alter the model processing parameters, such as the target OpSet version, data type precision, and model optimizations, using this tool.
ML Architecture Turnkey: TurnkeyML can be accessed by API or CLI to meet a variety of user preferences and automation needs. Its architecture comprises several key components that play specialized roles in model deployment and optimization:
Model-to-model transformations are carried out using sequences, which are the fundamental building blocks of the TurnkeyML stack. Tasks like applying model quantization techniques, exporting a PyTorch model to the ONNX format with torch.onnx.export, or optimizing graphs with ONNX Runtime to improve model performance are examples of sequences.
Runtimes: Known as the execution layer, a runtime is the program that makes a certain model execute on a particular piece of hardware. Runtimes that offer cross-platform compatibility and may be used with various backend hardware, such as AMD ROCm execution provider for AMD GPUs, or high-performance frameworks like TensorRTTM for NVIDIA GPUs are examples.
Profilers: TurnkeyML interacts with a number of profiling tools so that users may assess and improve model performance while also getting insight into how well your model is being executed. Users can choose from a variety of profilers, such as Intel’s VTune Profiler for comprehensive CPU profiling and performance monitoring or Nvidia’s System Management Interface (SMI) for GPU-based data.
Devices: Targeting a broad spectrum of hardware platforms, TurnkeyML is engineered to be device-agnostic. TurnkeyML offers versatility and adaptability in hardware choices, whether it’s for running models on x86 CPUs, using GPUs’ parallel computing capabilities, or deploying to custom accelerators. Adding new hardware targets to TurnkeyML is a simple process.
TurnkeyML’s reporting infrastructure is the last part. It gathers and displays performance metrics from the model execution process, like mean latency (ms) and throughput (IPS). The ability to visualize performance statistics, offer efficiency insights, and support users in making well-informed decisions on model deployments are all made possible by this reporting.
The modular, plug-and-play architecture of TurnkeyML allows for simple addition, removal, or replacement of any component without the need for laborious integration procedures. Developers can easily modify the toolchain to meet their unique requirements by integrating additional models, introducing new model-to-model conversions, or focusing on new hardware accelerators thanks to its modular architecture.
Important advantages for AI development come from TurnkeyML’s methodical reproducibility: Designed to Reduce User Error: Process automation reduces human error, improving consistency and dependability while handling models.
Standardizes Model Sources: It makes sure that models are consumed and processed consistently, which makes comparison and assessment simpler.
Standardized testing environments provide equitable and precise benchmarking among many models with TurnkeyML.
Read more on Govindhtech.com
0 notes
Text
List all the MS Teams you have joined in PowerApps
In my previous article, I have covered how you can get started with the Graph Api integration with Power Apps. If you have missed this article, you can jump back and get started. Get Started with GraphAPI in Power Apps In Today’s article, we will look at how you can list all the MS Teams Teams you have joined. We are aiming at creating a simple app, which lists all the teams, and allow the users…

View On WordPress
0 notes
Text
try public preview - microsoft identity Conditional access filters for apps
try public preview – microsoft identity Conditional access filters for apps
As part of Zero trust posture, protecting all apps is key. At present, policies explicitly list apps. Today Microsoft announced the public preview of filters for apps. This provides a new way to manage Conditional Access (CA) assignment for apps and workload identities at scale. With filters for apps, admins can tag applications with custom security attributes and apply Conditional Access…
View On WordPress
#$filter#access#API#apps#Azure Active Directory#conditional access#cpolicy#developers#devices#Identity platform#Management#Microsoft Entra#MS Graph API#Policy#public preview#Secure#Security#security attributes#service principal#users#workload identities#zero trust
2 notes
·
View notes
Text
Lessons Learned: How to avoid getting asked for tokens in MS Azure console apps
Lessons Learned: How to avoid getting asked for tokens in MS Azure console apps
Microsoft has been migrating most of Azure’s functionality to the “Microsoft Graph API”, which is fantastic as that allows us to automate a bunch of things within the Azure cloud. However, the Graph API is secured behind an OAuth2 flow, and if you’ve ever dealt with OAuth2 you’d know that it revolves around “tokens” which are issued by a central authentication/authorization server for any given…

View On WordPress
0 notes
Text
We can all agree Proxmox VE is such an amazing Virtualization solution for home users and corporate business application setups. There is no need for separate management tool in Proxmox since everything can be done through the web browser. A built-in HTML5 console is used to access the guest console. As an alternative, SPICE can be used. Proxmox Virtual Environment offers excellent command-line tools and REST API for third-party application integrations. By design, Proxmox comes with a single theme upon its installation. In this guide we shall cover the steps you’ll follow to install a custom Discord-like dark theme for the Proxmox Web UI. But first let’s look at the features of Proxmox Web Interface. Features of Proxmox VE Graphical User Interface Some of the features available on Proxmox VE Graphical User Interface are: Seamless integration and management of Proxmox VE clusters AJAX technologies for dynamic updates of resources Fast search-driven interface, capable of handling hundreds and probably thousands of VMs Secure access to all Virtual Machines and Containers via SSL encryption (https) Secure HTML5 console or SPICE Role based permission management for all objects (VMs, storages, nodes, etc.) Support for multiple authentication sources (e.g. local, MS ADS, LDAP, …) Two-Factor Authentication (OATH, Yubikey) Based on ExtJS 6.x JavaScript framework Install Discord-like dark theme on Proxmox VE We’ll use a dark theme for the Proxmox Web UI, inspired by Discord’s color scheme. The project is available on Github if you’re interested in code sources. In this theme, everything is dark, including the graphs, context menus and all in between. Before theme installation, the Proxmox VE graphical user interface (GUI) has a look shown in screenshot below. We will perform theme installation via the CLI utility. Login to your PVE node running Web UI, see our example below: $ ssh [email protected] 10:32:31 root@pve01 ~ → Install wget tool if not available on the node. sudo apt update && sudo apt install wget curl -y Use wget utility to download theme installation script. wget https://raw.githubusercontent.com/Weilbyte/PVEDiscordDark/master/PVEDiscordDark.sh Make the script executable and run it. chmod +x PVEDiscordDark.sh sudo ./PVEDiscordDark.sh install Installation process should complete in seconds. ✔ Backing up template file ✔ Downloading stylesheet ✔ Downloading patcher ✔ Applying changes to template file ✔ Downloading images (29/29) Theme installed. To see all script options run the command: $ ./PVEDiscordDark.sh -h Usage: ./PVEDiscordDark.sh [OPTIONS...] COMMAND Manages the PVEDiscordDark theme. -h --help Show this help -s --silent Silent mode Commands: status Check current theme status (returns 0 if installed, and 1 if not installed) install Install the theme uninstall Uninstall the theme update Update the theme (runs uninstall, then install) Exit status: 0 OK 1 Failure 2 Already installed, OR not installed (when using install/uninstall commands) This scripted installer relies on the /meta/supported and /meta/imagelist files being present in the repository. Below is new look on the login screen. Web interface overview page view with the new theme. The theme can be updated to new release with the command: $ sudo ./PVEDiscordDark.sh update ✔ Removing stylesheet ✔ Removing patcher ✔ Reverting changes to template file ✔ Removing images Theme uninstalled. ✔ Backing up template file ✔ Downloading stylesheet ✔ Downloading patcher ✔ Applying changes to template file ✔ Downloading images (29/29) Theme installed. Uninstall Discord-like dark theme on Proxmox VE If you want to uninstall the theme use the commands below to remove it and all its associated files. $ sudo ./PVEDiscordDark.sh uninstall
✔ Removing stylesheet ✔ Removing patcher ✔ Reverting changes to template file ✔ Removing images Theme uninstalled. Enjoy your new look on Proxmox VE GUI. We hope this guide was helpful. We have other guides on Proxmox Virtual Environment in the links shared here. How To Install Pritunl VPN on Debian / Proxmox VE Using Dnsmasq DHCP Server in Proxmox for VMs IP Create Private Network Bridge on Proxmox VE with NAT Protect VM from accidental deletion in Proxmox VE How To Mount and Use NFS ISO Share on Proxmox VE Remove “No valid subscription” warning on Proxmox VE 7
0 notes
Text
Using microsoft office on mac

#Using microsoft office on mac how to#
#Using microsoft office on mac for mac#
#Using microsoft office on mac install#
#Using microsoft office on mac software#
#Using microsoft office on mac Pc#
The Dock is a long display of icons located at the bottom of Mac's screen. For Mac, a similar interface like the start menu is used which is called the Dock. The start menu on Mac is used to Launch and find programs on the computer. Sometimes it can get difficult to find applications stored on the Mac. In both cases, you just click or double-click the icon of the application.
#Using microsoft office on mac Pc#
Launching an application on a Windows PC and opening it on a Mac is very similar. There are many ways to open an application on a computer.
#Using microsoft office on mac install#
This will check for the latest update of Microsoft Office and install the updates.
In the lower-right corner of the Microsoft AutoUpdate tool dialogue box, you will find the Check For Updates tab.
Select "Automatically Download and Install".
If you don't see "Check for Updates" in the Help menu, download the latest version of the Microsoft AutoUpdate tool from the official site of Microsoft.
Here we will discuss the method to update MS Excel on Mac using auto-update. Fortunately, Microsoft offers many updates with fixes related to the performance and stability of its tools which also include updates for MS Excel 2019. Most of the time updating MS Excel solves the issue. ASAP Utilities displays some sort of error message when it malfunctions. Plugins such as ASAP Utilities, that use VBA for its functions could be the reason behind such errors. Many users experience different types of bugs and errors in MS Excel.
Click on Close after a successful installation.
Click on Continue and agree on the license agreement.
Click the Microsoft Office installer.pkg file.
Click on Office 365 apps and the downloading process will start.
Sign in with your existing account or make a new one.
Go to the official site of Microsoft office.
Here are the steps to install MS Office on your Mac: If you already have one then before installing Office, sign in with your existing account, and enter your product key. Microsoft products come with a product and activation key. How to Download & Install Microsoft Excel for Mac: Here we will discuss every tip and tricks related to Excel on Mac.
#Using microsoft office on mac software#
Updates to The office suite generally come out at least a year after the Windows versions, but they are compatible with Office for Windows software and support almost all the features that exist in the Windows versions of the software. Microsoft offers a special version of Office suite to run on Apple computers. It automatically collects data from Microsoft Excel to create a report on Microsoft Word. VBA can be used to control user interface features such as enabling toolbars and menus. It enables user-defined functions (UDFs), editing Windows API, and other low-level functions. Microsoft also includes a macro programming language called Visual Basic for Application(VBA) in MS Excel. The function categories are listed below: Excel offers almost 400 worksheet functions which are classified in 14 categories by Microsoft. Excel tables help administrators to observe the progress of single as well as combined statistics such as report trends and product densities. It allows the user to set tables, where they can shape their data. Excel has now become the industry standard for spreadsheets all around the world.Įxcel processes raw data and stores it in a systematic, and organized manner. It also offers a limited animated graphics display. Data is displayed in the form of lists, graphs, and charts. Excel offers a network of cells arranged in letter-named columns and numbered rows to organize data operations like formula based calculations and data entry. It was released in 1987 for Microsoft Windows, before that its version 1.0 was only limited to Macintosh computers. Microsoft Excel is a spreadsheet developed by Microsoft.
#Using microsoft office on mac how to#
How to Recover Deleted Excel Files on Mac.
#Using microsoft office on mac for mac#
How to Download & Install Microsoft Excel for Mac.
Click Close when the installation is complete.
Click Continue and follow the on-screen instructions to install.
If you get an error that the file can't be opened because it's an unknown developer, wait about 20 seconds, drag the file to your desktop, and then hold the Control key as you click the file to open it.
Open your Downloads folder and double-click the file called something similar to Microsoft Office-Installer.pkg.
If you haven't yet purchased Office, click Buy Office at the top-right corner first, and then follow the on-screen steps to make your purchase.
If you don't see this option and are signed in through a business account, go to instead. This is usually your Microsoft account, but if you got Office through your employer or school, you may need to use that account info. If you're not signed in, click Sign in to sign in with the account associated with Office. X Trustworthy Source Microsoft Support Technical support and product information from Microsoft. If you haven't already done so, you'll need to install and redeem Microsoft Office before you can activate it.
1 note
·
View note
Text
Commonly Occurring Errors: Microsoft Graph
Commonly Occurring Errors: Microsoft Graph
2022-08-29 15:54:56 With the release of Exchange Server in 2007, Microsoft also introduced Exchange Web Services (EWS). These SOAP-based APIs allow developers to access Microsoft Exchange products such as calendars, contacts, etc. over the internet. As part of the Office 365 product launch, Microsoft also released the new REST-based Office 365 Unified APIs, later known as the MS Graph APIs, in…
View On WordPress
0 notes
Text
Data Science with Job Placement in India
What is data science?
Data science is the area of study that associations domain knowledge, programming skills, and knowledge of mathematics and statistics to extract significant visions from data. The visions that data science creates help organizations grow operational efficiency, recognize new business opportunities, and progress marketing and sales programs, amongst other benefits.
Why data science is important?
More and more companies are coming to recognize the significance of data science, AI, and machine learning. Anyway of industry or size, organizations that demand to remain competitive in the stage of big data need to capably develop and implement data science abilities or risk being left behind.
Components of data science
Data Science consists of 3 parts namely:
Machine Learning: Machine learning involves algorithms and mathematical models, mainly employed to make machines learn and prepare them to adjust to everyday progress. For example, these days, time series estimating is very much in use in trading and financial schemes. In this, based on historical data patterns, the machine can forecast the outcomes for the future months or years.
Big Data: Every day, humans are creating so much data in the system of clicks, orders, videos, images, comments, articles, blogs, news, etc. These data are usually unstructured and are frequently called Big Data. Big Data tools and techniques mostly help in converting this unstructured data into a structured system.
Business Intelligence: Every business has and produces too much data every day of life. This data when investigated carefully and then presented in visual reports including graphs, can bring good decision-making to life. This can help the management in pleasing the best decision after carefully researching into designs and details the reports bring to life.
Skills Required
Skills required to become a data scientist contain:
Tools
In-depth knowledge in R: R is used for data analysis, as a program design language, as an atmosphere for statistical analysis, data conception
Python coding: Python is majorly desired to implement mathematical replicas and concepts because python has big libraries/packages to figure and deploy models.
MS Excel: Microsoft Excel is measured as a basic requirement for all data entry jobs. It is of excessive use in data analysis, applying formulae, equations, and diagrams available of a disordered lot of data.
Hadoop Platform: It is an open-source spread processing framework. It is used for handling the processing and storing of big data applications. Technology : Since there is so much formless data out there, one also should know how to admittance that data. This can be done in a diversity of ways, via APIs, or web servers.
Techniques
Mathematical Expertise: Data scientists also work on machine knowledge algorithms such as regression, gathering, time series, etc. which need a very high amount of mathematical information then they are based on mathematical algorithms.
Working with unstructured data: Since most of the data shaped every day, in the form of images, comments, tweets, search past, etc is unstructured, it is a very useful skill in today’s world to know how to convert this unstructured into a structured form and then occupied with them.
Business Understanding
Business Acumen: Analytics Specialists derive from the mid-management to high-management in the pyramid. So, having business information comes as a big requirement for them.
Job Trends
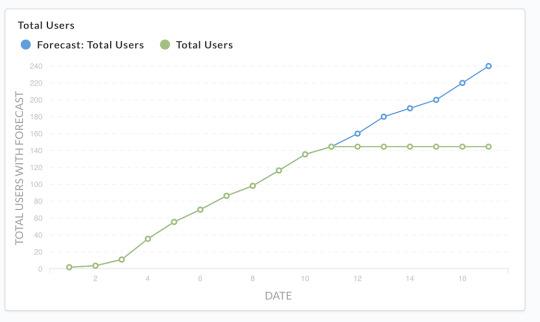
Jobs by Salary
Nearly 46% of Data Scientists make a salary between 6-15 LPA.

Candidates with Institute are sought by 37% of the recruiters.

Experience Requirement
17% of available job requirements are looking for fresher candidates.
38% of Data Science job starts are for specialists with more than 5 years of job experience.

Roles in Data science
Data Scientist
Big Data Analysts
Business Analytics Professional
Business Intelligence Professional
Marketing Analytics Professionals
HR Analytics Professionals
Conclusion
In these courses you can learn about Data Science, what is Data Science, and how can use this in the business world. The classes for this course will be over LIVE lectures that will be led via classroom or online via the internet to member desktops/laptops or classrooms using Eduvogue Direct to Convenient platform.
Apply now
https://forms.gle/fx6Cu5jUboUKRmMX9
1 note
·
View note
Text
What is Data Science?
Data science are often defined as a mix of mathematics, business acumen, tools, algorithms and machine learning techniques, all of which help us find out the hidden insights or patterns from data which may be of major use within the formation of massive business decisions.
In data science, one cope with both structured and unstructured data. The algorithms also include predictive analytics in them. Thus, data science is all about this and future. That is, checking out the trends supported historical data which may be useful for present decisions and finding patterns which may be modelled and may be used for predictions to ascertain what things may appear as if within the future.
Data Science is an amalgamation of Statistics, Tools and Business knowledge. So, it becomes authoritative for a knowledge Scientist to own good knowledge and understanding of those.
Why to learn
With the quantity of knowledge that's being generated and therefore the evolution within the field of Analytics, Data Science has clothed to be a necessity for companies. To make most out of their data, corporations from all domains, be it Marketing, Finance, Retail, IT or Bank. All are looking for Data Scientists. This has led to an enormous demand for D. Scientists everywhere the world. With the kind of salary that a corporation has got to offer and IBM is declaring it as trending occupation of 21st century, it's a well-paid job for several. This field is such anybody from any background can make a career as a knowledge Scientist.
Skills Required
Skills required to become a data scientist include:
I have listed down all the talents required to become a knowledge Scientist:
Fundamentals.
Statistics.
Programming.
Machine Learning and Advanced Machine Learning (Deep Learning)
Data Visualization.
Big Data.
D. Ingestion.
D. Munging.
Tools
In-depth knowledge in R: R is employed for d. analysis, as a programing language , as an environment for statistical analysis, data visualization
Python coding: Python is majorly preferred to implement mathematical models and ideas because python has rich libraries/packages to create and deploy models.
MS Excel: Microsoft Excel is taken into account a basic necessity for all data entry professions. It is of great use in data analysis, applying formulae, equations, diagrams out of a messy lot of knowledge.
Hadoop Platform: it's an open-resource distributed processing framework. It is utilized for managing the processing and storage of huge data applications.
SQL database/coding: it's mostly used for the preparation and extraction of datasets. It also can be used for problems like Graph and Network Analysis, Search behaviour, fraud detection etc.
Technology: Since there's such a lot unstructured data out there, one also should skills to access that data. This can be wiped out a spread of the way, via APIs, or via web servers.
Job Trends
Jobs by Salary
Nearly 46% of knowledge Scientists earn a salary between 6-15 LPA.
Education Requirement
Candidates with B.Tech / B.E. or M.Tech / M.E. degrees are sought by 37% of the recruiters.
Experience Requirement
17% of obtainable job requirements are trying to find fresher candidates
38% of knowledge Science job openings are for professionals with quite 5 years of job experience
Job Roles
Business Analytics Professional
Business Intelligence Professional
D. Scientist
Big D. Analysts
HR Analytics Professionals
Marketing Analytics Professionals
Looking for B.Tech in Data Science ?
B.Tech in Data Science is a four - year undergraduate degree program in engineering. The main objective of the program goals to induce training to the admitted candidates with respect to the recent current and new evolving techniques and theories that are related to Data Science. This establishes the statistics, data mining, data warehousing and data visualization.
Mangalmay Group of Institution is offering 4 year full time Btech in Data Science.
Affiliated to AKTU, Lucknow (Formerly known as U.P. Technical University) and approved by AICTE, Ministry of HRD, New Delhi
0 notes
Text
Microsoft graph bookings api available at v1.0
Microsoft graph bookings api available at v1.0
If you’re using Microsoft Graph Bookings API in beta, then please note that it’s now available in v1.0. This way you will continue use the core functionalities (offered in beta + newly introduced features such as SMS notifications, online meeting, custom questions, group appointments etc). So how the change is going to look like. I played with bookingbusiness: The beta endpoint was…
View On WordPress
#API#Beta#bookings#Bookings API#Developer#General Availability#group appointments#M365#Microsoft Graph#MS Graph API#online meeting#SMS notification#v1.0
0 notes
Link
This post is about editing office documents online in a web application interface for users. In this, you will require an office 365 license to use Microsoft graph APIs to edit documents through Onedrive.
To edit MS Word documents online, one of the quick approaches is saving the Word document to OneDrive and use the graph API to open document editing preview online.

0 notes
Text
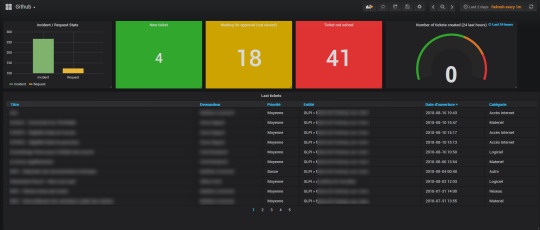
Grafana Metabase

If you’ve ever done a serious web app, you’ve certainly met with a requirement for its monitoring, or tracking various application and runtime metrics. Exploring recorded metrics lets you discover different patterns of app usage (e.g., low traffic during weekends and holidays), or, for example, visualize CPU, disk space and RAM usage, etc. As an example, if the RAM usage graph shows that the usage is constantly rising and returns to normal only after the application restart, there may be a memory leak. Certainly, there are many reasons for implementing application and runtime metrics for your applications.
There are several tools for application monitoring, e.g. Zabbix and others. Tools of this type focus mainly on runtime monitoring, i.e., CPU usage, available RAM, etc., but they are not very well suited for application monitoring and answering questions like how many users are currently logged in, what’s the distribution of server response times, etc.
When comparing Grafana and Metabase, you can also consider the following products. Prometheus - An open-source systems monitoring and alerting toolkit. Tableau - Tableau can help anyone see and understand their data. Connect to almost any database, drag and drop to create visualizations, and share with a click.
Here's what people are saying about Metabase. Super impressed with @metabase! We are using it internally for a dashboard and it really offers a great combination of ease of use, flexibility, and speed. Paavo Niskala (@Paavi) December 17, 2019. @metabase is the most impressive piece of software I’ve used in a long time.
时间序列,日志与设备运行数据分析选 Grafana;企业生产经营数据分析则可以选 Superset。 Metabase. Metabase 目前在 GitHub 上受欢迎程度仅次于 Superset,Metabase 也是一个完整的 BI 平台,但在设计理念���与 Superset 大不相同。. Kibana and Metabase are both open source tools. Metabase with 15.6K GitHub stars and 2.09K forks on GitHub appears to be more popular than Kibana with 12.4K GitHub stars and 4.81K GitHub forks.
In this post, I’ll show you, how to do real time runtime and application monitoring using Prometheus and Grafana. As an example, let’s consider Opendata API of ITMS2014+.
Prometheus
Our monitoring solution consists of two parts. The core of the solution is Prometheus, which is a (multi-dimensional) time series database. You can imagine it as a list of timestamped, named metrics each consisting of a set of key=value pairs representing the monitored variables. Prometheus features relatively extensive alerting options, it has its own query language and also basic means for visualising the data. For more advanced visualisation I recommend Grafana.
Prometheus, unlike most other monitoring solutions works using PULL approach. This means that each of the monitored applications exposes an HTTP endpoint exposing monitored metrics. Prometheus then periodically downloads the metrics.
Grafana
Grafana is a platform for visualizing and analyzing data. Grafana does not have its own timeseries database, it’s basically a frontend to popular data sources like Prometheus, InfluxDB, Graphite, ElasticSearch and others. Grafana allows you to create charts and dashboards and share it with others. I’ll show you that in a moment.
Publishing metrics from an application
In order for Prometheus to be able to download metrics, it is necessary to expose an HTTP endpoint from your application. When called, this HTTP endpoint should return current application metrics - we need to instrument the application. Prometheus supports two metrics encoding formats - plain text and protocol buffers. Fortunately, Prometheus provides client libraries for all major programming languages including Java, Go, Python, Ruby, Scala, C++, Erlang, Elixir, Node.js, PHP, Rust, Lisp Haskell and others.
As I wrote earlier, let’s consider ITMS2014+ Opendata API, which is an application written in Go. There is an official Prometheus Go Client Library. Embedding it is very easy and consists of only three steps.
Free microsoft office download for mac full version. The first step is to add Prometheus client library to imports:
The second step is to create an HTTP endpoint for exposing the application metrics. In this case I use Gorilla mux and Negroni HTTP middleware:
We are only interested in line 2, where we say that the /metrics endpoint will be processed by Prometheus handler, which will expose application metrics in Prometheus format. Something very similar to the following output:
In production, you would usually want some kind of access control, for example HTTP basic authentication and https:
Although we have only added three lines of code, we can now collect the application’s runtime metrics, e.g., number of active goroutines, RAM allocation, CPU usage, etc. However, we did not expose any application (domain specific) metrics.
In the third step, I’ll show you how to add custom application metrics. Let’s add some metrics that we can answer these questions:
which REST endpoints are most used by consumers?
how often?
what are the response times?
Grafana Metabase On Pc
Whenever we want to expose a metric, we need to select its type. Prometheus provides 4 types of metrics:
Counter - is a cumulative metric that represents a single numerical value that only ever goes up. A counter is typically used to count requests served, tasks completed, errors occurred, etc.
Gauge - is a metric that represents a single numerical value that can arbitrarily go up and down. Gauges are typically used for measured values like temperatures or current memory usage, but also “counts” that can go up and down, like the number of running goroutines.
Histogram - samples observations (usually things like request durations or response sizes) and counts them in configurable buckets. It also provides a sum of all observed values.
Summary - is similar to a histogram, a summary samples observations (usually things like request durations and response sizes). While it also provides a total count of observations and a sum of all observed values, it calculates configurable quantiles over a sliding time window.
In our case, we want to expose the processing time of requests for each endpoint (and their percentiles) and the number of requests per time unit. As the basis for these metrics, we’ve chosen the Histogram type. Let’s look at the code:
We’ve added a metric named http_durations_histogram_seconds and said that we wanted to expose four dimensions:
code - HTTP status code
version - Opendata API version
controller - The controller that handled the request
action - The name of the action within the controller
For the histogram type metric, you must first specify the intervals for the exposed values. In our case, the value is response duration. On line 3, we have created 36 exponentially increasing buckets, ranging from 0.0001 to 145 seconds. In case of ITMS2014+ Opendata API we can empirically say that most of the requests only last 30ms or less. The maximum value of 145 seconds is therefore large enough for our use case.
Finally, for each request, we need to record four dimensions we have defined earlier and the request duration.Here, we have two options - modify each handler to record the metrics mentioned above, or create a middleware that wraps the handler and records the metrics. Obviously, we’ve chosen the latter:
As you can see, the middleware is plugged in on line 8 and the entire middleware is roughly 20 lines long. On line 27 to 31, we fill the four dimensions and on line 32 we record the request duration in seconds.
Configuration
Since we have everything ready from the app side point of view, we just have to configure Prometheus and Grafana.
A minimum configuration for Prometheus is shown below. We are mainly interested in two settings, how often are the metrics downloaded (5s) and the metrics URL (https://opendata.itms2014.sk/metrics).
A minimal Grafana configuration:
Note: As we can see, a NON TLS port 3000 is exposed, but don’t worry there is a NGINX in front of Grafana listening on port 443, secured by Let’s Encrypt certificate.
Monitoring
Finally, we get to the point where we have everything we need. In order to create some nice charts it is necessary to:
Open a web browser and log into Grafana
Add Prometheus data source
Create dashboards
Create charts
An example of how to create a chart showing the number of HTTP requests per selected interval is shown on the following figure.
Similarly, we’ve created additional charts and placed them in two dashboards as shown on the following figures.
Summary
In this post, we have shown that the application and runtime monitoring may not be difficult at all.
Prometheus client libraries allow us to easily expose metrics from your applications, whether written in Java, Go, Ruby or Python. Prometheus even allows you to expose metrics from an offline applications (behind corporate firewalls) or batch applications (scripts, etc.). In this case, PUSH access can be used. The application then pushes metrics into a push gateway. The push gateway then exposes the metrics as described in this post.
Grafana can be used to create various charts and dashboards, that can be shared. Even static snapshots can be created. This allows you to capture an interesting moments and analyze them later.
Reports and Analytics
Powerful Enterprise Grade Reporting Engine
Elegant SQL interface for people who need a little more power
Widgets for Creating Bar Chars, Pie Charts, Line Graphs
Multiple Dashboards with different personal widgets
Create, organize, and share dashboards with others
Dashboards
Open Source
Completely Open Sources
Community Contribution Available
Simple to Use even for beginners
Install on premises or in the Cloud
Free and Simple to Use
Integrations
Integration with any Data Source in SQL
PostgreSQL, MySQL, Maria DB
Oracle, MS SQL or IBM DB2
Ready Plugins Available
Metabase Vs Grafana
Altnix Advantage
Metabase Consulting Services
Altnix provides Professional services for Consulting on Metabase products. Following items are covered:
Consulting Services for Metabase business intelligence tool
Best practices and guidelines on how to adopt the Metabase business intelligence tool
Architecture Design for Metabase
Technology Roadmap for Metabase adoption at your organization
Solution Design on using Metabase business intelligence tool
Metabase Implementation and Deployment
Altnix will implement Metabase based business intelligence and Analytics solution keeping in mind the business requirements. Implementation includes the following:
Integration with different databases and data sources
Extract Transform Load (ETL) Design
Designing Queries to be used in Metabase
Widgets and Dashboards design in Metabase
Reports Design in Metabase
Development and Design Implementation
UAT and Testing Activities
Production Implementation and Go Live
Warranty Support Period Included
Metabase Customization
Grafana Metabase On Twitter
Altnix will customize your Metabase installation so that it is a better fit for your business environment.
Creating new visualizations and dashboards as per customer needs
Creating custom reports and charts as per customer needs
Adding new scripts, plug-ins, and components if needed
Third-Party Integration
Altnix will integrate Metabase business intelligence tools with other third-party tools to meet several use cases.
Ticketing systems such as LANDesk, BMC Remedy, Zendesk, and ((OTRS)) Community Edition
ITSM Tools such as ((OTRS)) Community Edition, GLPi Network Editon, ServiceNow, and HP Service Manager
Monitoring tools such as Zabbix, Nagios, OpenNMS, and Prometheus
IT Automation Tools such as StackStorm, Ansible, and Jenkins

24x7 AMC Support Services
Altnix offers 24x7 support services on an AMC or per hour basis for new or existing installations on the Metabase Business intelligence tool. Our team of experts are available round the clock and respond to you within a predefined SLA.
Case Studies
Knute Weicke
Security Head, IT
Fellowes Inc, USA
Altnix was an instrumental partner in two phases of our Security ISO needs. The first being a comprehensive developed Service/Ticketing system for our global offices. The second being that of an Asset Management tool that ties all assets into our Ticketing systems to close a gap that we had in that category. They are strong partners in working towards a viable solution for our needs
The Altnix team was very easy to work with and resolved our needs in a timely manner. Working with Altnix, allowed us to focus on our core business while they handled the technical components to help streamline our business tools. We have found a strategic partner in Altnix
Johnnie Rucker
General Manager
Encore Global Solutions, USA
White Papers
0 notes
Text
Latest technologies for web development
Internet Development is anything connected with a site, such as static HTML pages, front-end, and backend improvements. While the front is visible to everybody working with the site, which has pages, images, text, pictures, the backend is all linked to the database, API’s and more, which is needed for a site to operate properly, and that has the database and API’s to interact with the database through feeds, query language, or even more and more reunite the necessary data to the consumer.
Let’s Take a Look at a Few of the popular internet development technologies frequently used nowadays:
Most smart devices like smartwatches, smart TV, smart switches, even refined lovers, and lighting are connected via the web of items. These devices require the world wide web to operate, and that’s the reason why integration between hardware, applications, and sites is essential on a big scale, and which will drive the next wave of change in the near future.
Artificial Intelligence (AI) is just another cutting-edge technology that drives the shift in web development. By self-driven automobiles, voice-assisted navigation, automated recognition of face and voice of a person being, and allowing access to the ideal individual along with also a machine-assisted conscience that may make decisions to assist human beings, even the program is innumerable.
Artificial Intelligence is an advanced technology that’s advocated and employed by big tech MNC’s such as Google, Apple, Microsoft, Facebook, and has also found usage in the growth of plugins of internet browsers and Word Press.
The most typical usage of AI and Machine Learning in web development is via the usage of Chatbots, which are currently used by each IT, banking, support, and product-based organization to supply premium excellent customer solutions according to the needs of the clients.
These days, organizations are focusing on constructing a site using an interactive and immersive user experience, which can be reached by producing a much better UI using easy-to-visit web pages with interactive and appealing components and a superb web page design.
To accomplish this feat, an individual may use movement UI technologies to execute a website development strategy rigorously. One of a number of other internet application development technology, UI is the only technology which includes animated graphs, background animations, animated headers & banner ads.
Numerous programming languages may be used by a programmer to design the pages, front end, or rear end.
ASP.NET is an open-source internet framework used to develop dynamic sites, internet applications, and services using Microsoft. NET framework. Frequently utilized together with MS-SQL, a database query language together with APIs to bring results by a relational database through APIs such as REST, it may be employed to design and send the desirable site by the customer. JavaScript is among the most frequently used programming languages such as creating the net software’ front end since it could add interactivity into a site. Every modern internet browser uses Javascript to run programs, games, and much more. It may also be used to make 2D and 3D images, games, database-driven programs, etc…
The solution is rather simple: since those are unique technologies that load sites faster, and subsequently, Google prioritizes them and enhances their rank.
An innovative web program (PWA) is web pages that are used by e-commerce sites that could work online or using an inadequate net, is at a minimal price, and can be optimized for a mobile viewing experience. A PWA supports connections, permitting users to enjoy a luxury encounter without ever realizing they are still using the internet browser.
An accelerated phone page (AMP) functions for static content only, and its loading time is a lot less compared to the HTML page. An AMP will get rid of all unnecessary components and exhibits just the essential data like text, pictures, etc.
A student might decide to find out internet technology to work in a corporate or public business office or become an entrepreneur. Sharda University is obviously encouraging of the students’ career option Technoglobe has a coveted 91% positioning offer listing for B.Tech students, 100% positioning provides for MBA students, a total of 150+ MNC’s have seen the Technoglobe campus for placements, together with the maximum bundle offered of 65 lac.
#digital marketing course in jaipur#Digital marketing Training in Jaipur#Distance Education in Jaipur#Web Designing Training in Jaipur#c c++ java coaching in jaipur#Networking Training in Jaipur
0 notes