#MarketMovement
Explore tagged Tumblr posts
Visit Tumblr Blog
Explore Tumblr blogs with no restrictions, modern design and the best experience.
Last Seen Tumblr Blogs


Fun Fact
Tumblr was the first site to host the blog for President Barack Obama in 2011.
Text
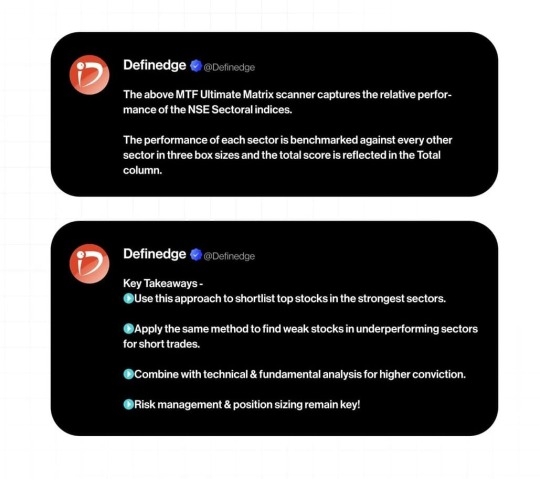
Stock Market Update – Bullish Signals or a Temporary Bounce?
In today's market update, we analyze the recent movements in NIFTY, BANKNIFTY, and SENSEX as the indices show signs of bullish momentum. Is this the beginning of a new upward trend, or just a short-term relief rally? We discuss key levels, market breadth indicators, and potential trading strategies to navigate this phase.
0 notes
Text

Market trends may change, but strategy and foresight remain constant. Play the game wisely, no matter who’s leading.📊
#ShareMarket#BullishTrends#BearishTrends#StockMarket#MarketMovement#BullVsBear#MarketAnalysis#TradingTips#ShareMarketIndia#EquityMarket#BullishMarket#BearishMarket#StockTrading#MarketWatch#InvestmentStrategy#BullMarketRun#BearMarketAlert#MarketUpdates#FinancialMarkets#InvestorAlert#ShareTrading#BullOrBear#DailyMarketTrends#MarketOpportunities#RiskManagement
0 notes
Text
Stocks making the biggest moves midday: GXO Logistics, CarMax, Nvidia, Circle and more
Check out the companies making the biggest moves midday: GXO Logistics — The stock popped more than 11% after the supply chain and warehousing management firm raised its full-year earnings outlook. The company now sees earnings before interest, taxes, depreciation and amortization, or EBITDA, between $860 million and $880 million. GXO also appointed Patrick Kelleher as CEO, effective Aug. 19.…
#Accenture PLC#Breaking News: Markets#Business#business news#Carmax Inc#Circle Internet Group Inc#Economy#GMS Inc#GXO Logistics Inc#Home Depot Inc#Jack in the Box Inc#KLA Corp#Kroger Co#Market Insider#Markets#NVIDIA Corp#Regencell Bioscience Holdings Ltd#regwall-marketmovers#SilverSun Technologies Inc#Stock markets#VanEck Semiconductor ETF
2 notes
·
View notes
Text
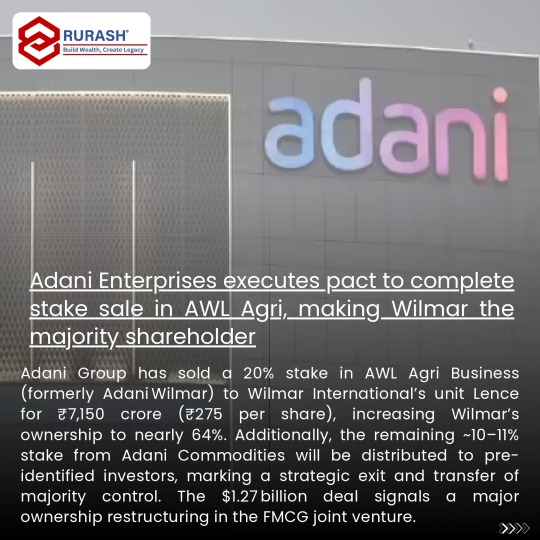
Strategic reshuffle in the FMCG space! Adani Group steps back as Wilmar solidifies its control with a landmark $1.27B stake acquisition. A move that could redefine ownership dynamics in India's agri-business landscape.
0 notes
Text
Exploring the Dynamics of the S&P TSX Venture Composite Index
Dive into the latest trends of the S&P TSX Venture Composite Index, a key barometer of early-stage public companies across diverse sectors in Canada. This index reflects evolving market movements and sectoral shifts that are shaping the small-cap segment. Stay informed with curated insights on performance and structure.
#TSXV#SPTSXVentureCompositeIndex#CanadianMarkets#SmallCapIndex#TSXIndex#MarketMovers#VentureExchange#TSXToday#EquityIndex#TSXComposite
0 notes
Text
How FTSE Chart Reveals Hidden Gaps and Breakout Zones
The FTSE chart offers a dynamic snapshot of how the UK’s premier stock index behaves across time. As markets evolve daily, weekly, and monthly, this visual tool provides clarity that raw numbers or single-day summaries often cannot. With every candlestick, line, or volume spike, the FTSE’s movement becomes more than a data point — it becomes a story.
Momentum in Real Time
Unlike static tables or lists, the FTSE chart captures velocity. Whether markets trend upward on positive sentiment or dip in reaction to macro events, these shifts appear immediately on the visual interface. Market participants often track these fluctuations to observe momentum, particularly during times of heightened news flow or economic data releases.
Intraday moves, for instance, may show sudden directional changes — a sharp upward candle during morning trade or a pullback into afternoon sessions. These visual trends, spread across time intervals, can often signal deeper shifts in sentiment.
Historical Traces and Long-Term Patterns
Beyond the short-term moves, the FTSE chart provides a clear view of long-range behavior. Weekly or monthly charts offer insight into multi-year cycles, revealing how economic expansions, policy changes, or global events shape the index’s path over time.
These longer-term views frequently reveal repeated formations — channels, consolidations, or inflection zones — that highlight areas where momentum has stalled or surged before. Such visuals help frame the broader narrative of how corporate health, geopolitical tension, and currency movements influence large-cap UK equities.
Sector Rotation and Index Composition
One of the subtler elements embedded in the FTSE chart is the impact of sector rotation. As money flows between areas like energy, financials, and healthcare, the chart may reflect that movement in the form of directional bias or hesitation.
For example, during periods when commodity prices spike, the FTSE often mirrors that strength due to its weight in energy stocks. The chart may show extended rallies that align with such periods. Conversely, weakness in banking or telecom can sometimes cap the index, and that deceleration shows up as flattening or sideways ranges.
These shifts are not always tied to singular events — they often play out over weeks, gradually appearing in trendlines and momentum slopes on the chart.
Volume Signals and Breakout Zones
Another powerful layer on the FTSE chart comes from volume. Sudden surges in trading volume can precede breakouts or major directional moves. When plotted alongside price action, volume often acts as a confirmation tool, indicating conviction behind a move or lack thereof.
In recent months, multiple sessions have displayed volume spikes near major chart zones — whether at resistance levels or during reversals from local bottoms. These moments, while subtle, often mark critical pivots in the broader price structure.
From Local Lows to Record Highs
The current shape of the FTSE chart tells a compelling story of recovery and resilience. After periods of economic uncertainty and muted price action, the index has recently crossed significant resistance zones and ventured into all-time high territory.
This journey is mapped visually through higher lows, upward-sloping channels, and well-defined breakout points. The chart acts as a living canvas of this evolution — a testament to both corporate performance and broader economic recovery across the UK and beyond.
A Broader Reflection of Sentiment
While data points like GDP growth, inflation, or employment rates carry their own weight, the FTSE chart often reveals how such data is digested by the market. It becomes a real-time mood board for macro perception.
From euphoric rallies to cautious consolidation, the chart captures the market’s internal dialogue without the need for interpretation. The shape of the trend, the pace of the move, and the context of volume combine to offer a pure form of sentiment analysis.
The FTSE chart stands as one of the most powerful visual tools in the financial landscape. Its real-time nature, historical scope, and technical clarity make it more than a graphic — it becomes a reflection of how markets think, react, and evolve. Whether viewed over hours or months, its lines, gaps, and curves tell a continuous, unfolding story of the UK’s corporate landscape and global market dynamics.
0 notes
Text
Stocks making the biggest moves midday: TLN, IVZ, NFLX, COIN
Here are some of the names making big moves in midday trading: Talen Energy — Shares popped more than 24%. Talen said it has signed agreements to acquire Moxie Freedom Energy Center in Pennsylvania and the Guernsey Power Station in Ohio, a pair of combined-cycle gas-fired plants. The deal comes out to $3.5 billion after adjusting for estimated tax benefits. Shares of data center power plays…
#biggest#Breaking News: Economy#Breaking News: Markets#business news#COIN#Constellation Energy Corp#Economy#Invesco Ltd#IVZ#making#Market Insider#Markets#midday#moves#NASDAQ 100 Index#NFLX#PowerShares QQQ Trust#Regions Financial Corp#regwall-marketmovers#Stock markets#Stocks#Talen Energy Corp#TLN#Vistra Corp
0 notes
Text
FTSE 100 Today Live Focuses On Infrastructure and Service Flows
The FTSE 100 today live captured consistent updates from organisations engaged in national and regional transport. Rail, freight, and air logistics groups shared timetable notifications, confirming service continuity across major delivery and passenger routes.
Announcements from system operators highlighted standard equipment use, driver availability, and route access. Public records pointed to operational health in metro networks, cargo lanes, and delivery hubs. No adjustments to shipment routing or load limits were reported during the session.
Collaborative updates from port authorities and aviation groups ensured continued function across terminals, supporting the sector’s steady presence on the index.
Utilities Sector Maintains Normal Operations
The utilities segment of FTSE 100 today live showed flat positioning. Electricity grids, water supply, and distribution services functioned without recorded incident. Companies in this category maintained consistent output, confirming uninterrupted access across urban and rural zones.
Routine statements focused on infrastructure status, inspection timelines, and emergency maintenance readiness. Weather reports and seasonal usage data were acknowledged, but overall segment behaviour remained aligned with previous updates.
Grid balance, pipe integrity, and facility uptime were key focus areas across daily communications. There were no deviations from existing protocols, and all timelines remained as earlier declared.
Consumer Goods Activity Remains Stable
Consumer product manufacturers and supply managers indicated measured activity. FTSE 100 today live reflected limited movement in listed entities within the segment. Delivery frequency, in-store availability, and sourcing logistics remained unchanged from recent cycles.
Reports included details on storage, cold chain reliability, and retail centre distribution health. Manufacturing units operated at expected levels, and cross-regional transport for packaged goods stayed within known volumes.
Public-facing brands issued short statements confirming routine dispatch rates and standard packaging workflows. Price markings and shelf rotation schedules followed weekly structures with no modification.
Construction and Engineering Stay Balanced
Infrastructure-related companies showed no abnormal variation during the day. Updates came from contractors, service engineers, and structural component suppliers. Roadwork, pipeline expansion, and site inspection reports pointed to a balanced project flow.
No safety disruptions or supply interruptions were reported. Workforce documentation and site clearance communications confirmed continuation of groundwork and equipment staging. Reports from public infrastructure councils aligned with project status statements shared by listed entities.
Data Services Maintain Regular Pace
Companies focused on secure data services, software hosting, and network stability presented reports consistent with previous sessions. This group of firms in FTSE 100 today live did not deviate from usual performance.
No access disturbances or system capacity issues were identified in issued communications. Patch cycles, uptime logs, and customer support volumes followed predefined structures. Data centre functions, cloud backup integrity, and compliance checks contributed to the sector’s stable tone.
0 notes
Text
TSX Top Gainers: Daily Chart Leaders on the Canadian Stock Exchange
Explore the latest updates on the tsx top gainers, showcasing stocks with strong upward momentum on the TSX. Stay in tune with market-driven performance shifts and keep track of dynamic daily movements shaping the Canadian stock exchange.
#TSX#StockMarketCanada#TSXToday#MarketMovers#TSXGainers#CanadianStocks#TSXUpdate#StockPerformance#TSXStocks#StockTrends#TSXLive
0 notes
Text
Fear of Selling Isn’t Strategy
Holding out for a dream number might cost you real opportunities now.
0 notes
Text
Discover Sector Trends within the FTS100 Index Landscape
Explore performance snapshots from the fts100 index, showcasing market direction and movements across leading UK-listed firms. The page offers a data-driven approach to tracking changes across sectors, all without using speculative tone or promotional language—ideal for staying aligned with core index-level developments.
#FTS100Index#UKStockMarket#FTSE100Updates#MarketMovements#FTSEWatch#UKEquities#StockTrendsUK#FTSESnapshot#UKIndexTracker#FTSEOverview
0 notes
Text

Crafting Success: Building Your Winning Trading Strategy.
#forextrading#tradingstrategy#fxmarket#marketanalysis#riskmanagement#moneymanagement#marketmovement#tradingtips#tikable
0 notes
Text
Stocks making the biggest moves midday: Block, SolarEdge, Cleveland-Cliffs, Verizon and more
Check out the companies making the biggest moves midday: Bruker — The lab instrument and tools maker shed 12% after the company issued weaker-than-expected guidance for the second quarter. The company expects to earn between 32 cents and 34 cents per share on revenue ranging from $795 million to $798 million. Analysts polled by FactSet expected a profit of 42 cents per share on revenue of $813.3…
#Alkermes Plc#Arrowhead Pharmaceuticals Inc#Block Inc#Breaking News: Markets#Bruker Corp#Business#business news#Cleveland-Cliffs Inc#Dollar Tree Inc#Economy#EQT Corp#Invesco Ltd#Market Insider#Markets#Pinterest Inc#regwall-marketmovers#Sarepta Therapeutics Inc#Solaredge Technologies Inc#Stock markets#Verizon Communications Inc
0 notes
Text
Overview Of The FTSE 100 And Its Role In The UK Market
Highlights:
The FTSE 100 reflects the performance of large companies listed on the London Stock Exchange.
It includes firms from sectors such as energy, finance, healthcare, and consumer goods.
The index plays a significant role in representing economic trends across various industries.
The FTSE 100 represents a diverse selection of the largest companies listed on the London Stock Exchange, covering sectors like energy, consumer services, industrial goods, and financial services. This index acts as a benchmark for evaluating corporate activity within the broader UK economy. Many constituents operate internationally, offering global exposure while maintaining their primary listing in the UK. This composition allows the FTSE 100 to serve as a cross-sector overview of major business operations.
Historical Context and Structure
The FTSE 100 was established to provide a transparent view of the most capitalised companies in the UK market. It includes businesses from various industries, and their combined performance forms the basis for the index level. Each company’s weight within the index is determined by its market capitalisation, with updates made periodically. Movement in the index reflects aggregated price changes of these top-tier firms rather than individual share actions.
Sector Representation and Business Scope
The companies within the FTSE 100 span across key areas of the economy. Prominent names include multinational firms in pharmaceuticals, telecommunications, food production, and energy. These businesses often have operations across multiple continents, which broadens the index’s scope beyond the domestic market. The variety of sectors represented helps provide a stable framework for observing activity across the UK’s most influential corporate groups.
Impact of Economic Trends on the Index
Macroeconomic conditions, currency fluctuations, and commodity markets are among the factors influencing the FTSE 100. As a result of its international reach, movements in global demand and supply chains can contribute to daily and long-term changes in the index. Currency shifts, particularly involving the British pound, can also influence how companies report earnings, especially those with significant foreign revenue streams.
Role in Financial Reporting and Benchmarking
The FTSE 100 serves as a commonly referenced gauge in financial summaries and market commentaries. Its performance is often viewed as a reflection of how the broader business environment is evolving. Corporations included in the index regularly disclose updates, which collectively influence shifts in the index level. The index’s movements are monitored during trading hours and provide a standard reference point in end-of-day financial recaps.
Periodic Rebalancing and Eligibility Criteria
Changes to the composition of the FTSE 100 occur through scheduled reviews. Firms that meet size thresholds may enter or exit the index depending on their standing. This process ensures the list remains representative of the most prominent companies by market capitalisation. Adjustments are handled in a structured manner, preserving consistency and alignment with eligibility rules.
Importance in Broader Market Metrics
While the FTSE 100 focuses on the largest UK-listed firms, it often correlates with other market indicators to shape a fuller picture of business activity. Movements in the index are commonly examined alongside other benchmarks in Europe and internationally. Its influence extends beyond domestic boundaries due to the global presence of many of its constituents. The broad mix of companies means the index can reflect developments across multiple sectors simultaneously.
#FTSE100#LondonStockExchange#UKMarkets#StockIndexUpdate#GlobalBusinessTrends#MarketMovers#SectorSnapshot#EconomicTrends#CorporatePerformance#FinancialOverview
0 notes
Text

Discover Hidden Market Potential with Rits Capital
Unlock insights that others miss. Decode the trends. Read the signals.
Your smart investment journey starts here. 𝐂𝐨𝐧𝐭���𝐜𝐭 𝐮𝐬 for more inquiries: +91 9911090800
𝐕𝐢𝐬𝐢𝐭: https://ritscapital.com/
𝐃𝐢𝐬𝐜𝐥𝐚𝐢𝐦𝐞𝐫: This is for educational purposes only.
#RitsCapital#HiddenGems#SmartInvesting#MarketMoves#BuySellStrategy#UnlistedShares#FinancialFreedom#MAGA#MakeAssetsGrowAgain#RiseWithRits
0 notes
Text
The Niufo Chronicle: Strategy's $765M Bitcoin Buy Amid Legal Turbulence

Strategy (formerly MicroStrategy) just can't stop buying Bitcoin – even as legal troubles brew. The company announced the acquisition of 7,390 BTC for a staggering $764.9 million on May 19, averaging just under $103,500 per coin.
💼 The Legal Drama Unfolds A class-action lawsuit has been filed against Strategy executives in the Eastern District of Virginia. The suit alleges that company officials, including executive chairman Michael Saylor, made misleading statements about "the anticipated profitability of our Bitcoin-focused investment strategy" and failed to disclose risks associated with Bitcoin's volatility.
📈 By The Numbers
Current holdings: 576,230 BTC
Total investment: $40.18 billion
Average purchase price: $69,726 per coin
Current value: $59.2+ billion
Unrealized gain: $19.2 billion (47%)
Bitcoin current price: $102,615 (up 20.3% over last month)
🔄 The Ripple Effect Strategy's Bitcoin treasury approach has created a trend:
AsiaStrategy (formerly Top Win): Shares surged 60%+ after announcing Bitcoin strategy
Metaplanet: Now holds more Bitcoin than El Salvador
A Bahrain-based catering company: Adopted similar strategy despite modest $24.2M market cap
For cryptocurrency enthusiasts and traders on platforms like Niufo, these institutional moves represent significant market signals worth monitoring. The growing corporate adoption continues despite legal challenges, suggesting institutional confidence in Bitcoin's long-term value proposition.
Explore cryptocurrency trading opportunities: https://www.niufo.com/
0 notes