#Renko Chart
Explore tagged Tumblr posts
Visit Tumblr Blog
Explore Tumblr blogs with no restrictions, modern design and the best experience.
Last Seen Tumblr Blogs


Fun Fact
The most popular pages on Tumblr are about Minecraft, GIFs, and David J. Peterson.
Text
"Triple Brick Indicator: Advanced Trend and Volatility Analysis for Smarter Trading"
The Triple Brick Indicator is a technical analysis tool that filters price movements using Renko-style bricks. It highlights trends by smoothing out market noise and helps traders identify significant price reversals, trend strength, and breakout points.
0 notes
Text
you know charting the progression of maribel's faces over time you really see her lose her hinges

uwu baby

a little smug because she knows something that you don't. that's fine

[Mlle Not Appearing In This Image]

confused

fin de siecle romance protagonist

"you are listening to me, right?"
to, abruptly

"i can see god now"

"i know what's happening in that other world and you will listen to me about it"

"i am confident in social situations"
rainbow-colored septentrion isn't so smug on its own:

but add in the renko, and you'll realize that they've almost exactly flipped their ghostly field club demeanors:

anyway. excited to get a new CD whenever that happens. something wrong with her.
76 notes
·
View notes
Text

I don't do a lot of shipping, but I realized I haven't done a post in months that isn't LostWord related, so here's my shipping chart with my boring shipping picks. My explanation for some of these:
Maribel / Renko: Don't know a single thing about the Sealing Club characters, but I believe it when people call that couple mega-turbo-super-canon
Hisami / Zanmu: Hisami for sure has feelings, this is more about wanting Zanmu to reciprocate / not wanting it to be 1-sided
Grassroots Polycule: I've always liked Wakasagihime X Kagerou, but I've started to like the idea of it being a polycule. The polycule dynamic is "introvert Sekibanki being adopted by extroverted Wakasagihime and Kagerou." I definitely prefer it over Kogasa X Sekibanki which doesn't work for me because canon Sekibanki hides her youkai nature, Kogasa is a fairly public youkai and they're both pretty active in the Human Village. I feel like their relationship would be strained by disagreements about how they'd hang out in the village / around humans. That'd be less of an issue with the Polycule, since they would only hang out outside of the Village (no gossip unless someone decides to trail Sekibanki all the way to Misty Lake, which won't happen). TBH I'd probably put Kogasa X Sekibanki as Past Fling if I ever remade this chart.
Depends How I'm Feeling: I just cannot settle on a Reimu ship. Reimu X Marisa should be the best option, but Reimu X Sanae amuses me (the idea of Kanako, Suwako, Yukari and Kasen having to be in-laws sounds hilarious) while Reimu X Akyuu has that tragic aspect (IIRC Akyuu's memory relates to youkai, so I imagine her future incarnations would have a lot of memories working with Reimu since she exterminates youkai. Future incarnations would know they were close, but they would not be able to recall the most intimate memories that had nothing to do with youkai. Basically, the ship is about future Children of Miare being cursed with incomplete memories of Reimu forever).
I Only See Them As Friends: It's mostly self-explanatory. Just adding that I respect others that ship these, even if I don't ship them myself.
(Not On This List) All The Ships I Hate: I didn't include them here, but I'm against pretty much every "Dating Your Boss" ship. So Eiki/Komachi, Youmu/Yuyuko, Ran/Yukari, Aya/Megumu, Sakuya/Remilia etc.
Some (dis)honorable mentions that aren't just "Dating Your Boss Is Bad" are the old school Tenshi ships that make her into a masochist (so Tenshi X Yuuka or Yukari) and also Reisen X Junko (because 99% of the time it's just "lol wouldn't it be hilarious to have Junko stalking / harassing Reisen?")
Also, Reimu X Mamizou and Sannyo X Mamizou are totally missing from the list. Sannyo X Mamizou would probably be my definitive Mamizou ship (they're both old, experienced and wise in different ways. Also, they'd totally smoke weed together). Reimu X Mamizou would be with the other Reimu ships and the appeal is similar to Reimu X Sanae but with shapeshifting shenanigans (I wanna see Reimu react to Mamizou turning into a copy of her).
13 notes
·
View notes
Text
Renko Charts: Clarity Over Chaos in Trading
Traders often liken the stock market to a rollercoaster 🎢—thrilling, yes, but challenging to find clarity when everything feels turbulent. This was Sarah’s experience before she discovered Renko charts. As a day trader with a penchant for the erratic nature of cryptocurrency, Sarah frequently found herself stuck deciphering candlestick charts, only to exit trades prematurely due to “false”…
0 notes
Text
Renko EMA Robot EA v9.1 MT4 + Presets (Works on Build 1441+) | Forex Robot | MT4 Expert Advisor @ https://thetradelovers.com/product/renko-ema-robot-ea-v9-1-mt4/ #forexexpertadvisor #forexrobots #mt4indicators #mt4expertadvisor #RenkoEMARobotEAMT4
0 notes
Text
Renko EMA Robot EA v9.1 MT4 + Presets (Works on Build 1441+) | Forex Robot | MT4 Expert Advisor @ https://thetradelovers.gumroad.com/l/RenkoEMARobotEAMT4 #forexexpertadvisor #forexrobots #mt4robots #mt4expertadvisor #ForexIndicators #mt4indicators #forexsystem #forexmt4software #RenkoEMARobotEAMT4
0 notes
Text
Unlocking the Power of NinjaTrader 8 Indicators for Smarter Trading

When it comes to effective trading, having the right tools can make all the difference. NinjaTrader 8 indicators are among the most powerful tools available to traders today, offering enhanced market insights and precise signals to improve decision-making. Whether you’re a beginner or a seasoned trader, understanding and using NinjaTrader indicators effectively can significantly boost your trading performance.
What Are NinjaTrader 8 Indicators?
NinjaTrader indicators are custom-built tools that work within the NinjaTrader platform, designed to analyze market data and provide signals about price trends, momentum, volatility, and potential entry or exit points. NinjaTrader 8, the latest version of the platform, offers improved capabilities, faster processing, and more flexibility for developing and using indicators compared to its predecessors.
These indicators can range from simple moving averages and RSI (Relative Strength Index) to more advanced, proprietary indicators tailored for specific trading strategies. NinjaTrader 8 indicators allow traders to customize their charts and trading systems to better fit their style and goals.
Benefits of Using NinjaTrader 8 Indicators
Improved Accuracy
NinjaTrader indicators help filter out market noise, providing clearer signals. This precision allows traders to identify trends earlier and react quicker, reducing the chances of false entries or exits.
Customization
With NinjaTrader 8’s advanced architecture, indicators are highly customizable. Traders can adjust parameters, combine different indicators, or even develop their own to suit their unique strategies.
Versatility Across Markets
NinjaTrader indicators work seamlessly across multiple asset classes, including stocks, futures, forex, and cryptocurrencies. This versatility means traders can maintain consistency in their analysis regardless of their trade market.
Automation and Strategy Integration
Many NinjaTrader indicators integrate directly with the platform’s automated strategy builder. This feature allows traders to automate trades based on indicator signals, removing emotion from the trading process and enabling faster execution.
Popular Types of NinjaTrader indicators
Trend Indicators: Tools like moving averages, supertrends, and ADX help identify the direction and strength of price trends.
Momentum Indicators: Indicators such as RSI, Stochastics, and MACD measure the speed and magnitude of price movements.
Volatility Indicators: ATR (Average True Range) and Bollinger Bands help assess market volatility and manage risk.
Custom Renko Indicators: Specialized tools designed for Renko chart users that filter noise and provide clear trend signals.
Why Choose NinjaTrader Indicators?
NinjaTrader indicators are favored because they combine ease of use with powerful analytical features. The platform supports a large community of developers, meaning a wide range of free and paid indicators are available. NinjaTrader’s active user base also shares ideas, scripts, and improvements, keeping the ecosystem dynamic and innovative.
Using NinjaTrader 8 indicators can provide an edge by helping traders make informed decisions with real-time data and signals. Whether you want to identify breakout points, confirm trend reversals, or gauge momentum, these indicators can be invaluable in your trading toolkit.
Source: https://trandingdailynews.com/unlocking-the-power-of-ninjatrader-8-indicators-for-smarter-trading
0 notes
Text
Gold's Monthly, Weekly, H4, and Renko charts' Elliott Wave Analysis and Trades Taken last week. 05-24
youtube
View On WordPress
0 notes
Text
벽돌형 캔들 – 가격의 본질을 드러내는 구조, 노이즈를 제거한 추세 판별법
뉴스, 지표, 감정, 타이밍까지. 하지만 그 모든 걸 내려놓고 ‘진짜 방향’만을 보고 싶다면? 그 해답은 바로 **벽돌형 캔들(Renko Chart)**이다.
이 구조는 가격이 일정 폭 이상 움직일 때만 ‘벽돌’을 추가해 시간이 아닌 가격 중심의 차트를 제공한다.
1.구조 개념
• 전통적 봉차트는 일정 시간마다 캔들 생성
• 벽돌형 차트는 가격이 일정 폭(예: 1%) 이상 움직일 때만 벽돌 생성
• 상승 벽돌과 하락 벽돌로 시각화 → 추세 판별에 최적
• 시간의 개입을 배제 → 시장의 본질적인 방향성 강조
2.왜 Renko인가?
1. 노이즈 제거
• 작은 흔들림, 틱 단위 잡음 제거
• 추세만 남기고 불확실성 배제
추세 지속 구조 포착
• 상승 벽돌 3개 이상 → 상승 흐름 지속 가능성
• 색상 전환(예: 흰색→검정색) → 추세 전환 신호
리스크 관리
• 전환 봉을 기준으로 ���절/익절 전략 세팅
• 평균 벽돌 수 기준 진입 타이밍 계산 가능
3.실전 전략
진입 기준
• 상승 벽돌 2개 이상 연속 생성 시 매수 고려
• 하락 벽돌 전환 + 거래량 증가 시 숏 진입 신호
손절 기준
• 반대색 벽돌 전환 시 손절
• MACD·RSI 반전 병합 분석으로 조건 강화
익절 기준
• 피보나치 138.2%
• 전일 고점 또는 최근 지지선 기준 청산
4.실제 적용 예시
• BTC, 기준 브릭: 2%
• 상승 벽돌 3개 연속 발생
• RSI 54, MACD 상승 → 매수 진입 → 6일간 11.4% 상승
• 4번째 벽돌에서 MACD 수렴 → 일부 청산
• 5번째 벽돌 반전 → 전량 청산
5.병합 전략 추천
• Renko + RSI: 과매도 영역에서 상승 벽돌 생성 → 반등 타이밍
• Renko + 볼린저밴드: 수축 후 첫 벽돌 생성 → 방향성 시그널
• Renko + MACD: 벽돌 색상 전환 시 MACD ��시 분석
6.장점 요약
• 가격 기반 차트 → 직관적 추세 분석
• 소음 제거 → 트레이더 피로도 감소
• 반복 패턴에 강함 → 백테스트 효율성 우수
7.유의사항
• 브릭 사이즈 설정 중요 (추천: 1~2%)
• 갭 발생 시 왜곡 가능 → 거래량과 병합 필요
• 보조지표와 함께 사용할 것
링크 벽돌형 캔들 기반 가격 추세 분석 도구 확인: https://www.cp-club.co.kr/?src=tumblr_renko01
결론
복잡한 정보를 내려놓고 시장의 방향성만 보고 싶다면 벽돌형 캔들은 가장 직관적인 해답이다.
노이즈를 걷어낸 후 남는 건 진짜 가격의 흐름이고, 그 흐름을 먼저 보는 자가 ��레이딩의 본질을 꿰뚫는 트레이더다.
0 notes
Text
April 20th, 2025 - Arcaea
upscores on a few old FTR charts like DRG (FTR-9, MAX-29 -> MAX-13) and Feels So Right feat. Renko (FTR-9, MAX-12 -> MAX-11) ! also GIVE ME BACK MY 0.01 PTT ALREADY STUPID ATTRAQTIA


0 notes
Text
youtube
The Blueprint of Out Performers. A monthly Deep DiveIn
this video, we discuss the process of studying the outperformers in order to gain insight from their observations. It is intended to develop an objective method for identifying outperformers. Based on the analysis, some momentum setups on noiseless charts are discussed.
1 note
·
View note
Text
Finding the Ideal Trading Platform in Australia: Stocks, Crypto, and Beyond
Introduction
The rapid evolution of financial technology has changed the way Australians access and interact with global markets. From buying local stocks to trading volatile cryptocurrencies, individuals are increasingly taking control of their financial futures through intuitive and feature-rich platforms.
But not all trading platforms are created equal. Your choice should depend on what you want to trade, how often, and what level of control and information you require.
What to Expect from a Modern Trading Platform
A modern trading platform should combine accessibility, speed, depth, and security. At its core, the platform should offer Forex Platform seamless trade execution, detailed market insights, and the flexibility to manage a variety of instruments.
Characteristics of an Ideal Trading Platform
1. Multi-Asset Support
The best platforms allow you to trade:
ASX-listed equities
Global shares and ETFs
Forex pairs (major, minor, exotic)
Cryptocurrencies and digital tokens
Commodities (e.g., gold, oil)
2. Real-Time Data and Market Depth
Professional traders depend on up-to-the-second pricing and order book depth to make strategic decisions. Your platform should include:
Live charting with technical overlays
Market depth indicators
Customizable watchlists
Volume tracking tools
3. Powerful Charting and Technical Analysis
Advanced traders use a wide array of analytical tools. Look for platforms offering:
Multiple chart types (candlestick, Heikin Ashi, Renko)
Dozens of indicators and overlays
Drawing tools and backtesting features
4. Risk Management Tools
No trader should operate without safeguards. Platforms must offer:
Margin and leverage calculators
Stop-loss, take-profit, and trailing stop options
Automated risk controls based on capital allocation
5. Mobile and Web Integration
Trading should be seamless across all your devices. Leading platforms synchronize data and sessions across:
Desktop software
Web browsers
iOS and Android apps
6. Security and Fund Protection
Protecting your capital and data is essential. Trustworthy platforms provide:
SSL encryption
Two-step verification
Insurance coverage for stored funds (in some cases)
7. Account Management and Reporting
Good platforms provide clear visibility into your account with:
Detailed trading logs
Tax reporting tools
Performance metrics
Exportable statements
Final Words
Your trading platform is your closest partner in the financial markets. It needs to perform under pressure, adapt to your strategy, and provide both protection and insight. With the right choice, you can trade with confidence, clarity, and control in any market condition.
Take your time, assess multiple options, and always start with a demo if possible. A well-suited platform can unlock not just profits—but your full trading potential.
1 note
·
View note
Text
Finding the Ideal Trading Platform in Australia: Stocks, Crypto, and Beyond
Introduction
The rapid evolution of financial technology has changed the way Australians access and interact with global markets. From buying local stocks to trading volatile cryptocurrencies, individuals are increasingly taking control of their financial futures through intuitive and feature-rich platforms.
But not all trading platforms are created equal. Your choice should depend on what you want to trade, how often, and what level of control and information you require.
What to Expect from a Modern Trading Platform
A modern trading platform should combine accessibility, speed, depth, and security. At its core, the platform should offer australian forex market seamless trade execution, detailed market insights, and the flexibility to manage a variety of instruments.
Characteristics of an Ideal Trading Platform
1. Multi-Asset Support
The best platforms allow you to trade:
ASX-listed equities
Global shares and ETFs
Forex pairs (major, minor, exotic)
Cryptocurrencies and digital tokens
Commodities (e.g., gold, oil)
2. Real-Time Data and Market Depth
Professional traders depend on up-to-the-second pricing and order book depth to make strategic decisions. Your platform should include:
Live charting with technical overlays
Market depth indicators
Customizable watchlists
Volume tracking tools
3. Powerful Charting and Technical Analysis
Advanced traders use a wide array of analytical tools. Look for platforms offering:
Multiple chart types (candlestick, Heikin Ashi, Renko)
Dozens of indicators and overlays
Drawing tools and backtesting features
4. Risk Management Tools
No trader should operate without safeguards. Platforms must offer:
Margin and leverage calculators
Stop-loss, take-profit, and trailing stop options
Automated risk controls based on capital allocation
5. Mobile and Web Integration
Trading should be seamless across all your devices. Leading platforms synchronize data and sessions across:
Desktop software
Web browsers
iOS and Android apps
6. Security and Fund Protection
Protecting your capital and data is essential. Trustworthy platforms provide:
SSL encryption
Two-step verification
Insurance coverage for stored funds (in some cases)
7. Account Management and Reporting
Good platforms provide clear visibility into your account with:
Detailed trading logs
Tax reporting tools
Performance metrics
Exportable statements
Final Words
Your trading platform is your closest partner in the financial markets. It needs to perform under pressure, adapt to your strategy, and provide both protection and insight. With the right choice, you can trade with confidence, clarity, and control in any market condition.
Take your time, assess multiple options, and always start with a demo if possible. A well-suited platform can unlock not just profits—but your full trading potential.
0 notes
Text
Mastering Support and Resistance with Noiseless Charts: The Power of Anchor Columns
Support and resistance levels are essential tools in the arsenal of every trader and investor. These levels act as psychological and technical barriers, often signaling where price movement may slow, stall, or reverse. The ability to identify them accurately and logically enhances decision-making and strengthens trade setups.
One powerful way to gain clarity on these levels is through the use of Noiseless Charts—specifically Point & Figure (P&F) and Renko charts. These charting styles strip away market noise, offering a cleaner and more structured view of price action.
The Origin of Support and Resistance
A highly effective method for identifying support and resistance zones is to analyze the origin of momentum moves—sharp, directional price shifts that typically mark the beginning of a trend. These origin points serve as logical areas where price may return, pause, or reverse in the future.
On Point & Figure charts, these momentum moves are objectively defined, making it easier to spot key market levels with consistency. Platforms like TradePoint and Zone Web incorporate a unique concept known as the Anchor Column, which plays a vital role in this process.
What is an Anchor Column?
An Anchor Column in Point & Figure charting refers to any column of X’s (bullish) or O’s (bearish) containing 15 or more boxes. This indicates a strong, decisive move in one direction—an objective marker of momentum.
These anchor columns serve as reference points for support and resistance because they reflect significant buying or selling activity. When prices revisit the levels formed by an anchor column, traders can watch closely for potential reactions—continuations, consolidations, or reversals.
Why It Matters
Objectivity: Using a rule-based definition (15+ boxes) eliminates guesswork.
Clarity: Noiseless charts remove distractions, focusing on pure price movement.
Actionable Insight: Anchor Columns help traders identify high-probability zones with confidence.
Find Full Blog: Anchor Column Support & Resistance through Noiseless Charts
0 notes
Text
Best Crypto Charts for Traders in 2025 📊📈
Crypto traders know that reading price movements is key to making informed decisions. Whether you're a beginner or a seasoned trader, using the best crypto charts in 2025 can help you analyze trends, predict market shifts, and optimize your strategy.
🔍 What Are Crypto Charts?
Crypto charts are visual tools that display cryptocurrency price movements over time. They help traders identify trends, spot potential entry/exit points, and refine their trading strategies.
Among the different chart types, candlestick charts are the most popular due to their detailed price representation. Let’s explore some of the best charting platforms available for 2025.
📊 Best Crypto Charting Tools for 2025
🔥 TradingView – The Market Leader
One of the most popular platforms, TradingView offers both free and premium plans, supporting crypto, stocks, forex, and more. It provides customizable charts with 12+ formats and an active trading community to share strategies.
⚡ Bitbo – Bitcoin Specialists
For those focused on Bitcoin trading, Bitbo delivers 90+ Bitcoin price projection & on-chain charts, along with custom alerts and premium analysis tools.
📉 Coinigy – Advanced Crypto Trading
Coinigy is a powerful option that connects to 45+ exchanges, including DeFi platforms. It features AES 256-bit encryption for security and is ideal for portfolio tracking & trade execution.
📈 GoCharting – Multi-Asset Support
GoCharting offers 15+ chart formats, including candlestick, OHLC, and Renko. It’s great for traders involved in US & Indian markets, with extra features like paper trading & an educational academy.
🔄 CryptoView – Integrated Trading & Analytics
CryptoView is designed for serious traders, powered by TradingView charts. It supports multi-screen setups, portfolio sharing, and enterprise-grade security with API encryption.
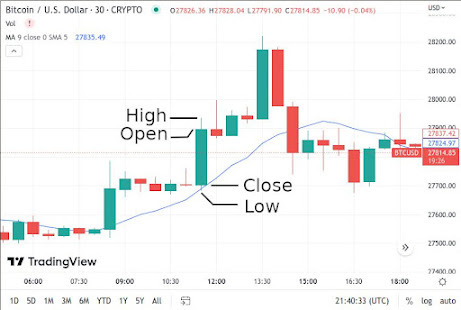
📖 How to Read Crypto Candlestick Charts
Candlestick charts are the most widely used crypto chart format because they show detailed price changes over a specific timeframe.
Each candlestick consists of:
Open price – the starting value of a crypto asset
High price – the peak value within the timeframe
Low price – the lowest value in that period
Close price – the final value before a new candlestick begins
📊 Understanding Candlestick Colors
🟢 Green Candle = Price closed higher than it opened (Bullish)
🔴 Red Candle = Price closed lower than it opened (Bearish)
📏 Analyzing Wick & Body Lengths
Long bodies → Strong trend (bullish or bearish)
Short bodies → Possible market indecision
Long wicks → Price volatility
Short wicks → Price stability
📌 Recognizing Crypto Chart Patterns
Bullish Patterns (Uptrend Signals)
Bullish Engulfing → Large green candle overtakes a smaller red candle
Rising Three → Three small red candles followed by a large green candle
Bullish Harami → Small green candle inside a larger red candle
Bearish Patterns (Downtrend Signals)
Bearish Engulfing → Large red candle overtakes a smaller green candle
Shooting Star → Long upper wick, small lower body (indicating reversal)
Bearish Harami → Small red candle inside a larger green candle
🛠 Alternative Crypto Analysis Methods
Besides candlestick charts, traders also use: ✅ Fundamental Analysis – Evaluates a crypto project’s whitepaper, team, partnerships, and market adoption ✅ On-Chain Analysis – Uses blockchain data to assess market sentiment and investor behavior ✅ Sentiment Analysis – Tracks social media trends & market psychology
🚀 Final Thoughts
Mastering crypto charts and analysis is crucial for making smarter trading decisions. Whether you use TradingView, Bitbo, Coinigy, GoCharting, or CryptoView, selecting the right charting tool can help you track trends and develop winning strategies.
What’s your go-to crypto charting tool? Let’s discuss! ⬇️💬
0 notes
Text
EA Scalp Renko v2.3 MT4 (Works on Build 1431+) | Forex Robot | MT4 Expert Advisor @ https://thetradelovers.com/product/ea-scalp-renko-v2-3-mt4/ #forexexpertadvisor #forexrobots #mt4indicators #mt4expertadvisor #EAScalpRenkoMT4
0 notes