#analyticstool
Explore tagged Tumblr posts
Visit Tumblr Blog
Explore Tumblr blogs with no restrictions, modern design and the best experience.
Last Seen Tumblr Blogs


Fun Fact
Tumblr has 411 employees.
Text
How to Set Up a Facebook Analytics Dashboard: A Step-by-Step Guide
Facebook analytics is a crucial tool for tracking your social media performance, understanding audience behavior, and optimizing your marketing strategy. By setting up a Facebook Analytics dashboard, you can monitor key performance indicators (KPIs) in one place, making data-driven decisions easier than ever.
In this step-by-step guide, we’ll walk you through how to set up a Facebook Analytics dashboard efficiently to measure engagement, conversions, and overall campaign performance.
Why You Need a Facebook Analytics Dashboard
Having a dedicated Facebook Analytics dashboard helps you:
Track Key Metrics: Monitor likes, shares, comments, and engagement rates.
Measure Ad Performance: Assess the effectiveness of Facebook Ads campaigns.
Understand Audience Behavior: Identify trends and patterns in audience interactions.
Improve Content Strategy: Optimize posts based on performance insights.
Step-by-Step Guide to Setting Up a Facebook Analytics Dashboard
Step 1: Access Meta Business Suite
Facebook Analytics was officially retired in 2021, but you can still track performance using Meta Business Suite. This platform integrates insights across Facebook and Instagram to give a comprehensive view of your performance.
To access it:
Go to Meta Business Suite.
Log in with your Facebook Business Manager account.
Select the page you want to analyze.
Step 2: Navigate to Insights
Once inside Meta Business Suite:
Click on “Insights” from the left menu.
You’ll see an overview of metrics such as Reach, Engagement, and Followers.
Click on “Custom Insights” to personalize your dashboard.
Step 3: Choose Your Key Metrics
Depending on your business goals, select the relevant metrics, such as:
Page Likes & Follows – Track your audience growth.
Post Engagement – Measure likes, shares, comments, and reactions.
Reach & Impressions – Understand how far your content is spreading.
Ad Performance – Analyze conversions and click-through rates (CTR).
Demographics – Know your audience’s age, gender, and location.
Step 4: Customize Your Dashboard
Click on “Create Report” in the Insights section.
Select the metrics you want to display.
Arrange them in a visually appealing way for easy tracking.
Set date ranges (last 7 days, last 30 days, custom period) to monitor trends over time.
Step 5: Set Up Automated Reports
To save time and ensure consistent tracking:
Click on “Export” in the top right corner.
Choose the format (CSV or PDF).
Schedule reports to be sent to your email weekly or monthly.
Step 6: Integrate with Google Data Studio (Optional)
For advanced reporting, integrate Facebook Insights with Google Data Studio:
Use third-party connectors like Supermetrics or Google Sheets.
Pull data from Facebook and visualize it with charts and graphs.
Share interactive dashboards with your team for better collaboration.
Best Practices for Facebook Analytics Dashboard
Regularly Review Data: Check insights weekly to spot trends and make quick adjustments.
Compare Performance Over Time: Look at historical data to understand growth patterns.
Use A/B Testing: Experiment with different content types and measure their performance.
Align Metrics with Goals: Focus on KPIs that directly impact your business objectives.
Conclusion
Setting up a Facebook Analytics dashboard is essential for tracking social media success and making informed marketing decisions. By following this step-by-step guide, you can create a customized dashboard tailored to your business needs. Start analyzing your Facebook performance today and optimize your strategy for better engagement and conversions!
#whatsdash#marketing reporting#facebookreport#smmreportingtool#facebookreportingtool#reporting tool#analyticstool#facebookanalyticstool#whatsdashtool
0 notes
Text
How to Interpret Google Analytics Correctly?
Google Analytics 4 introduces major changes with a user-focused approach, enhancing metrics like sessions, user engagement, and conversions. Track key activities, create custom reports, and improve business performance. Here is a detailed blog titled How to Interpret Google Analytics Correctly?
#GoogleAnalytics4#DigitalMarketing#UserEngagement#BusinessGrowth#WebAnalytics#DataDriven#MarketingStrategy#UserExperience#ConversionOptimization#SEO#AnalyticsTools
5 notes
·
View notes
Text
How to Become a Data Scientist: A Step-by-Step Guide for Beginners
To become a data scientist, start by building a strong foundation in statistics, Python, and data analysis. Learn key tools like SQL, machine learning, and data visualization. Gaining hands-on experience through projects and certifications helps beginners transition into this high-demand, rewarding career. Read More..
0 notes
Text

SQL and Power BI
Upgrade your skills with MITSDE’s live training in SQL and Power BI—complete the program in just 36 hours! Take charge of your future and unlock new career opportunities.
Apply today!
0 notes
Text
Why R Still Matters in the Data-Driven World of 2025
A Brief History of R
R, a language and environment for statistical computing and graphics, was conceived in the early 1990s by Ross Ihaka and Robert Gentleman at the University of Auckland, New Zealand. It was designed as a free and open-source alternative to expensive statistical software, democratizing data analysis and visualization. Over the years, R has evolved into a powerful tool embraced by data scientists, statisticians, and analysts worldwide. Its community-driven development model has resulted in a vast ecosystem of packages that enhance its core capabilities.

Why learn R
How R Differs from Python or Excel
While Python, Excel, and R are all popular tools for data manipulation and analysis, they serve different niches:
Python is a general-purpose programming language with extensive libraries for machine learning and data manipulation, such as NumPy, pandas, and TensorFlow. It is known for its versatility and readability.
Excel is a spreadsheet software that provides a user-friendly interface for organizing and analyzing data. It is ideal for small to medium-sized datasets and is widely used in business settings.
R, however, is specifically designed for statistical computing. Its syntax and functions are tailored for data analysis tasks. R excels in advanced statistical modeling, making it a go-to choice for statisticians and researchers.
Key Features of R for Statistical Computing
R offers a range of features that make it indispensable for statistical analysis:
Comprehensive Statistical Techniques: R provides a wide array of statistical tests, models, and data mining techniques directly out of the box.
Data Visualization: With packages like ggplot2, R allows users to create sophisticated and interactive graphics that help in data exploration and presentation.
Extensibility: R's package ecosystem is vast, with over 18,000 packages available on CRAN (Comprehensive R Archive Network), ensuring there is a tool for almost every statistical task.
Reproducibility: R Markdown and R scripts facilitate the documentation of analysis steps, ensuring that results can be reproduced and verified.
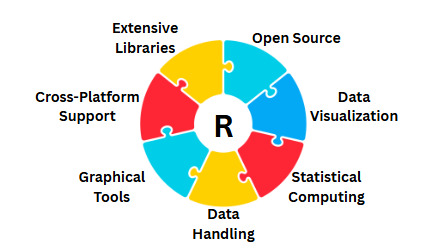
Feature of R
Where R Is Used Today
R's application spans a variety of fields, highlighting its versatility and robustness:
Academia: R is a staple in academic research, used for teaching statistics and research methods across disciplines.
Government: Agencies such as the U.S. Census Bureau leverage R for data analysis and reporting.
Healthcare: R is employed for bioinformatics, epidemiological research, and clinical trial data analysis.
Finance: Financial analysts use R for risk assessment, portfolio management, and predictive modeling.
Research Labs: R is a trusted tool in scientific research for data exploration and hypothesis testing.
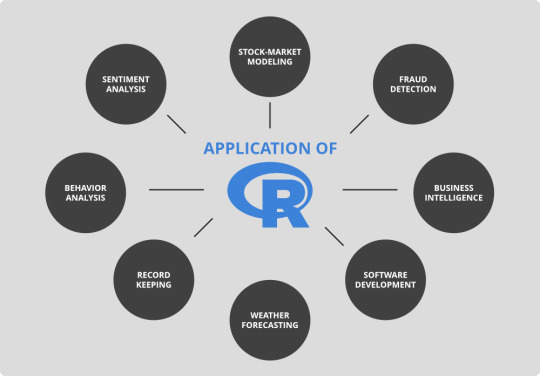
Application of R Language
Real-World Hook: WHO and Pharma Companies
The World Health Organization (WHO) and pharmaceutical companies rely heavily on R for public health insights. During the COVID-19 pandemic, R was utilized for modeling the spread of the virus, analyzing vaccine efficacy, and tracking public health interventions. Pharmaceutical companies use R for drug discovery, clinical trial analysis, and regulatory submissions, underscoring its critical role in advancing healthcare outcomes.
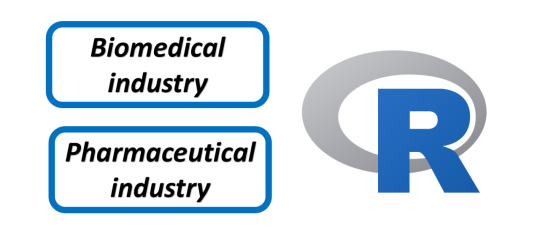
Real World Application
FAQs
1. Is R difficult to learn for beginners?
R can have a steeper learning curve compared to Excel, but numerous online resources and communities can help beginners get started. Its powerful features make the initial effort worthwhile.
2. Can R handle large datasets efficiently?
While R is not inherently optimized for big data, packages like data.table and connections to databases or big data platforms like Hadoop can enhance its capability to handle large datasets.
3. How does R ensure the reproducibility of results?
R Markdown and version-controlled scripts promote reproducibility by documenting each step of the analysis, allowing others to replicate the results seamlessly.
4. Are there any industries where R should not be used?
R is less suited for real-time analytics or applications requiring high-speed computation, such as gaming or streaming services. However, for statistical analysis, it's highly effective.
5. What resources are available for learning R?
There are numerous free resources, including the R documentation, online courses on platforms like Coursera and edX, and community forums like RStudio Community and Stack Overflow.
Home
instagram
youtube
#RProgramming#DataDrivenWorld#StatsWithR#DataScience2025#AnalyticsTools#OpenSourceStats#RvsPython#TechForGood#ResearchWithR#SunshineDigitalServices#Instagram#Youtube
0 notes
Text
What is Google Analytics? Explained
Have you ever wondered how websites track where visitors come from, what they do, or how long they stay? Google Analytics lets you see it all. In this video, we break down:
• What Google Analytics actually is and how it works • How it tracks user interactions with web pages and mobile apps • Key features like real‑time data, session insights, acquisition reporting, and goal tracking • The difference between metrics (e.g., sessions, pageviews, bounce rate) and dimensions (e.g., device, location, source) • Why GA4 the new, event‑based version gives you deeper insights, cross‑device tracking, and machine learning predictions
If you're a website owner, marketer, blogger, or small business owner looking to understand your audience and make smarter decisions—this video is your starting point
Master AI-Powered Digital Marketing at Digital Brolly Join Hyderabad’s most advanced AI-based Digital Marketing Training in Telugu & English – perfect for job seekers, professionals, students, and business owners.
Why Choose Us? ✅ First-ever AI Marketing Course in Telugu ✅ 35+ Modules | 600+ Topics | 3 Trainers | 7 Mentors ✅ Real-time Projects & Live Paid Campaigns using AI ✅ 100% Placement Support + Internship Until You’re Placed ✅ Soft Skills + Resume Building + Profile Marketing ✅ Daily Lab Practice & One-on-One Mentoring
🎓 Get real work experience in just 3–4 months with full offline support + video access
✨ Digital Marketing Antey Digital Brolly ✨
📞 Call: 81869 44555 📞 Call: 96 96 96 3446
🌐 Visit: digitalbrolly.com 📧 Email: [email protected]
Institute Address:
3rd Floor, Dr Atmaram Estates, beside Sri Bhramaramba Theatre, Metro Pillar No: A689, Near JNTU Metro Station, Nizampet X Roads, Hyderabad, Telangana 500072
#GoogleAnalytics#DigitalBrolly#Hyderabad#Jntu#AIMarketing#GA4#WebAnalytics#DigitalMarketing#DataDrivenMarketing#MarketingStrategy#DigitalInsights#OnlineMarketing#AnalyticsTools#CustomerJourney#ConversionTracking#BusinessGrowth#MarketingTips#GrowWithData#SmartMarketing#MarketingAnalytics#WebsiteOptimization#DataForBusiness#ROI#WebsiteTraffic#TrafficAnalysis#SEOAnalytics#UserBehavior#ContentPerformance#MarTech#DataScience
0 notes
Text
Custom Dashboards to Visualize KPIs & Metrics That Matter
Today’s leaders don’t just want data; they want clarity. That’s where custom data dashboards for business insights come in.
Using Power BI dashboard development, Awelion builds solutions that put your KPIs front and center. Our clients benefit from insightful views that align with their exact business model.
Our Google Data Studio experts and Tableau and Power BI consultants ensure each dashboard delivers maximum value. We offer end-to-end data visualization services for every industry, from healthcare to retail.
As part of our data reporting services in India, we also help you schedule reports and manage large datasets efficiently. We are proud to be among the best data analytics companies in Ahmedabad for innovation and performance.
0 notes
Text

Top Tools for Data Visualization
Want to turn complex data into clear visuals? Start learning tools that professionals use every day!
✅ Tableau – Build dashboards & reports
✅ Power BI – Make business data simple
✅ Infogram – Create beautiful charts in minutes
✅ Google Data Studio – Easy to share & collaborate
📊 Data visualization is key to success in today’s data-driven world!
👉 Learn these tools with real-time projects and expert guidance.
✅ Why Choose Us?
✔️ 100% practical training
✔️ Real-time projects & case studies
✔️ Expert mentors with industry experience
✔️ Certification & job assistance
✔️ Easy-to-understand Telugu + English mix classes
📍 Institute Address:
3rd Floor, Dr. Atmaram Estates, Metro Pillar No. A690, Beside Siri Pearls & Jewellery, near JNTU Metro Station, Hyder Nagar, Vasantha Nagar, Hyderabad, Telangana – 500072
📞 Contact: +91 9948801222 📧 Email: [email protected] 🌐 Website: https://dataanalyticsmasters.in
#DataVisualization#PowerBI#Tableau#GoogleDataStudio#Infogram#DataTools#DashboardDesign#VisualAnalytics#BusinessIntelligence#DataAnalyticsCourse#AnalyticsTools#LearnPowerBI#TableauTraining#ExcelToPowerBI#DataStorytelling#TechSkills#DataAnalyticsMasters#VisualizationTools#CareerInAnalytics#UpSkillNow
0 notes
Text
Who Delivers Better ROI? Freelance Data Analyst vs. Data Scientist

Are you deciding between hiring a freelance data analyst or a data scientist? 🤔
This deep-dive breaks down ROI across both roles—comparing costs, efficiency, project types, and long-term value.
💡 Learn: 🔹 When a data analyst gives faster results 🔹 Why data scientists are key for predictive modeling 🔹 What startups vs. enterprises should prioritize 🔹 How ROI shifts between reporting vs. automation
If you’re investing in freelance data talent, this guide will help you choose smarter, spend better, and scale faster.
📚 Read the full blog → 👉 Freelance Data Analyst or Data Scientist: Who Delivers Better ROI?
#DataAnalytics#FreelanceLife#DataScience#ROI#BusinessIntelligence#HiringTips#AnalyticsTools#StartupTips#FreelanceEconomy#PangaeaX
0 notes
Text

The demand for skilled Data Analytics professionals is on the rise there, especially in the vibrant Indian digital economy! So where should a novice begin with so many tools lining up in front of them?
Our new blog article, "Top Data Analytics Tools for Beginners in India," clears the noise and sheds light on the essential tools one needs to get their hands on: from Microsoft Excel, SQL, Tableau/Power BI, Python (Pandas), or all of the mentioned, these would form the key foundation as you attempt to fast-track your career.
Discover:
Why these tools matter to employers today.
What each of these tools really achieves from a real-world angle.
How learning them can turn you into an employable candidate.
Don't be left behind in the data revolution; arm yourself with the skills that count!
#DataAnalyticsIndia#LearnDataAnalytics#AnalyticsTools#CareerInData#DataAnalyticsForBeginners#BeginnerFriendly#Ahmedabad#TechSkills#DataScienceIndia#JobReady#TCCIComputerCoaching
0 notes
Text
Embedded Analytics and Reporting Tools in USA
Embedded analytics is transforming how organizations access, analyze, and utilize data. By integrating insights directly into existing applications, businesses can make real-time, data-driven decisions seamlessly.

#EmbeddedAnalytics#BusinessIntelligence#DataVisualization#AnalyticsTools#ReportingSolutions#RealTimeInsights#DataDrivenDecisions#AIVHUB#AnalyticsPlatform
0 notes
Text
What is a Data-Driven Framework? Benefits, Use Cases, and How to Build One
A data-driven framework is a testing or decision-making approach that uses external data to guide operations, especially in software testing and business analytics. It enhances flexibility, scalability, and reusability by separating test scripts from test data. This approach is widely used in automation, marketing strategies, and performance optimization Read More...
0 notes
Text

Diagram View in Power Query Online lets you visually explore and manage your data transformation steps and dependencies. It's great for understanding the flow and structure of your queries. Have you tried it yet? What do you like or wish it had?
#PowerQuery#DataTransformation#MicrosoftFabric#PowerBI#DataPrep#DiagramView#DataModeling#AnalyticsTools
0 notes
Text
What is Google Analytics? Explained
Have you ever wondered how websites track where visitors come from, what they do, or how long they stay? Google Analytics lets you see it all. In this video, we break down:
• What Google Analytics actually is and how it works • How it tracks user interactions with web pages and mobile apps • Key features like real‑time data, session insights, acquisition reporting, and goal tracking • The difference between metrics (e.g., sessions, pageviews, bounce rate) and dimensions (e.g., device, location, source) • Why GA4 the new, event‑based version gives you deeper insights, cross‑device tracking, and machine learning predictions
If you're a website owner, marketer, blogger, or small business owner looking to understand your audience and make smarter decisions—this video is your starting point
Master AI-Powered Digital Marketing at Digital Brolly Join Hyderabad’s most advanced AI-based Digital Marketing Training in Telugu & English – perfect for job seekers, professionals, students, and business owners.
Why Choose Us? ✅ First-ever AI Marketing Course in Telugu ✅ 35+ Modules | 600+ Topics | 3 Trainers | 7 Mentors ✅ Real-time Projects & Live Paid Campaigns using AI ✅ 100% Placement Support + Internship Until You’re Placed ✅ Soft Skills + Resume Building + Profile Marketing ✅ Daily Lab Practice & One-on-One Mentoring
🎓 Get real work experience in just 3–4 months with full offline support + video access
✨ Digital Marketing Antey Digital Brolly ✨
📞 Call: 81869 44555 📞 Call: 96 96 96 3446
🌐 Visit: digitalbrolly.com 📧 Email: [email protected]
Institute Address:
3rd Floor, Dr Atmaram Estates, beside Sri Bhramaramba Theatre, Metro Pillar No: A689, Near JNTU Metro Station, Nizampet X Roads, Hyderabad, Telangana 500072
#GoogleAnalytics#DigitalBrolly#Hyderabad#Jntu#AIMarketing#GA4#WebAnalytics#DigitalMarketing#DataDrivenMarketing#MarketingStrategy#DigitalInsights#OnlineMarketing#AnalyticsTools#CustomerJourney#ConversionTracking#BusinessGrowth#MarketingTips#GrowWithData#SmartMarketing#MarketingAnalytics#WebsiteOptimization#DataForBusiness#ROI#WebsiteTraffic#TrafficAnalysis#SEOAnalytics#UserBehavior#ContentPerformance#MarTech#DataScience
0 notes
Text
Can Quick Analytics integrate data from multiple formats like PDFs, CSVs, and Excel into one cohesive analytics report?
Quick Analytics can absolutely integrate data from multiple formats like PDFs, CSVs, and Excel into one cohesive analytics report. Their platform is designed to simplify complex data workflows by pulling information from various sources and unifying it into visually intuitive dashboards and reports. Whether you're working with spreadsheets or document-based data, Quick Analytics helps streamline the process, saving both time and effort.
For more info, check out: Quick Analytics
#DataAnalytics#QuickAnalytics#BusinessIntelligence#DataIntegration#Excel#CSV#PDF#AnalyticsTools#DataVisualization#DigitalTransformation
0 notes
Text
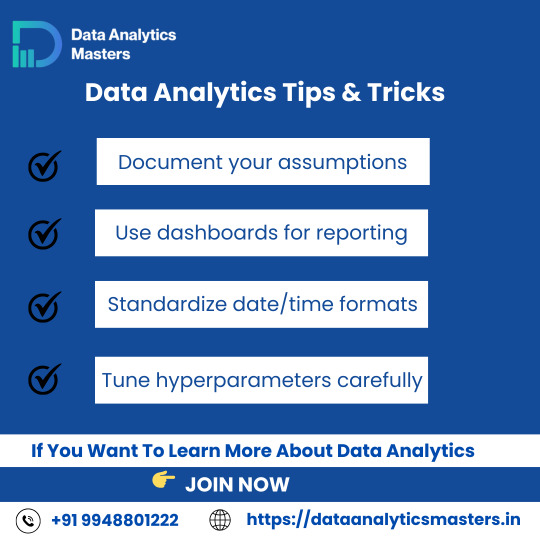
🚀 Data Analytics Tips & Tricks
Master data analytics with these 4 essential tips:
✅ Document your assumptions
✅ Use dashboards for reporting
✅ Standardize date/time formats
✅ Tune hyperparameters carefully
📊 Master the art of data analytics with practical, real-world tips,
Perfect for beginners, students, and professionals looking to advance in data analytics.
👉 Ready to start your journey?
📞 +91 9948801222
🌐 www.dataanalyticsmasters.in 📍 Location: Hyderabad
#DataAnalytics#AnalyticsTips#LearnDataAnalytics#DataDriven#AnalyticsTools#BusinessIntelligence#BigData#DataScienceIndia#AnalyticsTraining#UpSkillToday#HyperparameterTuning#ReportingDashboards#CareerInAnalytics#HyderabadTech#DataAnalyticsMasters
0 notes