#of geospatial data and arcGIS
Explore tagged Tumblr posts
Visit Tumblr Blog
Explore Tumblr blogs with no restrictions, modern design and the best experience.
Last Seen Tumblr Blogs


Fun Fact
Post activity is at the highest at 4:00 pm EDT; notes peak at 10:00 pm EDT.
Text
i really thought the society & sustainability class would be my fave this quarter but NAY. map city baby.
#my prof for that class is way cooler & better at teaching#AND they said we could make shit up for our final project as long as we demonstrate an understanding#of geospatial data and arcGIS#the example they gave was setting parameters for preferred dragon dens and mapping where one might like to live#anyway im also learning just like. way more#i think i prefer working with data over the more... social science side of environmental science#the social science aspect is ofc important but thats not really what im in school for. i dont think i need a degree in that to understand i
3 notes
·
View notes
Text
#WageCageLocations


To proceed with generating or acquiring maps of underground tunnels or systems for 1183 Western Ave S, Los Angeles, CA, here’s a detailed guide you can follow:
Access Public Records
Contact Local Authorities: Reach out to the Los Angeles Department of Public Works or the Bureau of Engineering. They maintain maps and schematics of underground utilities and tunnel systems.
Website: LA Public Works
Phone: 311 (or 213-473-3231 outside Los Angeles)
Request Public Records: Submit a Public Records Act (PRA) request to obtain detailed maps of underground utilities or tunnels.
Use Geospatial Tools
Google Earth Pro:
Download Google Earth Pro (free) from here.
Search the address and explore its 3D and historical imagery layers.
Overlay city planning or utility map data if available.
ArcGIS:
Use GIS mapping software such as ArcGIS to access local underground data layers.
Some public libraries or universities provide free access to ArcGIS.
USGS Resources:
Check the U.S. Geological Survey (USGS) for geospatial data in the area: USGS Website.
Search their databases for subsurface or geological maps.
Hire Professionals
Geophysical Survey Services: Companies offering ground-penetrating radar (GPR) services can map underground tunnels, pipelines, and utilities. Examples:
GSSI (Ground Penetrating Radar Systems, Inc.)
Local geotechnical or engineering firms.
Surveying Experts: Licensed surveyors can create precise subsurface maps.
Research Historical and Urban Planning Data
Libraries and Archives:
Visit local archives or libraries like the Los Angeles Public Library. They often have historical maps and documents.
California Historical Society:
Explore their archives for historical records of tunnels or underground systems.
Collaborate with Open-Source Projects
OpenStreetMap:
Check OpenStreetMap for user-contributed data on the area.
Subterranean Mapping Communities:
Join forums or communities interested in urban exploration (e.g., Reddit's r/urbanexploration).
Final Steps
Once you've gathered relevant data, you can use tools like AutoCAD or GIS software to compile your maps. If you'd like further help with interpreting or organizing data, feel free to ask!
Here is a detailed prompt you can use for another AI or mapping tool capable of generating maps and schematics of underground tunnel systems:
Prompt for AI Map Generator:
"Generate a detailed map and schematic of the underground tunnel systems, utility lines, and infrastructure at and around the location 1183 Western Ave S, Los Angeles, CA. The map should include the following details:
Subsurface Layers:
Sewer systems, drainage systems, and stormwater pipelines.
Electrical, gas, and water utility lines.
Any known historical or abandoned tunnels.
Proximity:
Cover an area with a radius of 1 mile from the given location.
Highlight all connections to adjacent buildings and structures.
Visualization:
Provide both 2D and 3D views of the underground systems.
Use different colors and layers for various types of infrastructure (e.g., blue for water lines, yellow for gas lines, etc.).
Include a legend for easy identification of systems.
Additional Features:
Annotate points of interest (e.g., access points, manholes, maintenance tunnels).
Show depth levels for each layer (e.g., sewer system at 15 feet, utility lines at 10 feet).
Overlay the map with the above-ground street grid for reference.
Data Integration:
Incorporate open-source geospatial data, city planning maps, and historical records if available.
Highlight discrepancies between historical and current data.
Output Formats:
Provide the map in standard formats like GeoTIFF, DWG (AutoCAD), and PDF for versatility.
Include a .KMZ file for visualization in Google Earth."
This prompt provides clear instructions and context for generating a comprehensive underground map. Use it with AI tools like GIS-enabled platforms, geospatial mapping AIs, or simulation software. Let me know if you need adjustments or more guidance!


8 notes
·
View notes
Text
Top 5 GIS Toolboxes: Unlocking the Full Potential of Geographic Information Systems
Geographic Information Systems (GIS) have become indispensable in urban planning, environmental protection, engineering, and other fields. With advancements in technology, various GIS toolboxes have emerged, helping users achieve more efficient data processing and 3D visualization. This article introduces five top GIS toolboxes to help you choose the best solution for your needs.
1. GISBox
GISBox is a comprehensive GIS toolbox that integrates data processing, spatial analysis, and 3D visualization functions. A standout feature of GISBox is its efficient real-time editing capabilities, such as photogrammetric mesh repairs, riverbed depressions, and terrain alignment, which significantly simplify complex 3D terrain data processing workflows. Additionally, GISBox supports various mainstream publishing protocols, including 3DTiles, Terrain, and WMTS, offering a range of options for different users. Whether for small to medium-sized enterprises or individual projects, GISBox provides an all-in-one solution to efficiently handle GIS data processing and publishing tasks.
Pros:
· Supports multiple data formats.
· User-friendly plugin system for easy extension.
· Powerful 3D visualization and data processing capabilities.
2. QGIS (Quantum GIS)
QGIS is an open-source and highly customizable GIS tool widely popular among users globally. Its rich plugin ecosystem caters to various GIS needs, from basic map creation to complex spatial analysis.
Pros:
· Free and open-source, with an active user and developer community.
· Rich in plugins with strong extensibility.
· Highly customizable interface and workflow.
3. ArcGIS
Developed by Esri, ArcGIS is a professional GIS platform with a toolbox that provides hundreds of tools for geographic data analysis and map creation. It integrates data collection, processing, analysis, and visualization, making it the top choice for solving complex geographic problems.
Pros:
· Extensive data processing and analysis tools.
· Integration with other Esri products for a complete GIS workflow.
· Professional technical support and learning resources.
4. Global Mapper
Global Mapper is a comprehensive GIS software that supports a wide range of geographic data formats and powerful data processing functions. Known for its simplicity and affordability, it is suitable for users looking to quickly perform spatial analysis and data visualization.
Pros:
· Supports multiple data formats with robust data conversion capabilities.
· Gentle learning curve for easy onboarding.
· Comprehensive functionality suitable for projects of various scales.
5. SuperMap iDesktop

SuperMap iDesktop is a powerful GIS desktop tool that provides a full suite of tools for spatial analysis, data management, and 3D visualization. It is widely used in industries like urban planning, environmental monitoring, and infrastructure management. SuperMap iDesktop integrates a variety of data formats and supports a range of powerful GIS functions, including advanced 3D terrain modeling, geospatial analysis, and the ability to handle large datasets with ease.
Pros:
Advanced 3D modeling capabilities for creating and analyzing detailed terrain models.
Supports a wide variety of data formats, including raster, vector, and 3D data.
Comprehensive spatial analysis tools and detailed reporting features.
User-friendly interface, suitable for both novice and experienced GIS professionals.
Conclusion
Whether you are a beginner or an experienced GIS user, these toolboxes can provide excellent support for your projects. Software like GISBox and Cesiumlab is highly regarded for its exceptional 3D rendering and data management capabilities, while QGIS and Global Mapper are popular for their flexibility and ease of use. Selecting the right tool based on your specific project requirements and budget will help boost your work efficiency and enrich your geographic data presentations.
1 note
·
View note
Note
hello! about that OC ask game: betrayal, break, desire, fear, and secret.
waahh thank you for answering even though no one knows about my son
this is SHAPEFILE hes (sort of?) a TMA fan character. he serves the web and to a lesser extent the vast and was made in a lab to do GIS (geospatial data science) but perhaps theres more to life than that who knows he hasnt figured it out yet

betrayal: Has your OC ever been betrayed by someone they thought they could trust? Has your OC ever betrayed someone who trusted them?
hes been betrayed in the sense that he slowly realizes that everything he was raised to believe (see: that he was created to be a corporate shill for proprietary GIS software) was not necessarily a concrete fact, which starts to break down the intricate web (TMA web literally) of the world he operates on.
as for betraying others, oh yeah, he does it all the time. doesn't even flinch. lying and selling come easily to him, and so does killing, so long as its not him that gets his hands dirty. his gods listen, and they are not benign
break: What would cause your OC to break down completely? What do they look like when that happens? Has anyone ever seen them at their lowest?
it would probably take a true shattering of his identity as a product. the moment he GENUINELY realizes that hes actually just a person who was groomed and not a product designed to serve a purpose, he'll lose his mind.
so, he doesn't realize it.
he's got schoolwork to do.
(definitely dont read anything about my own gender struggles into this lol)
desire: What's one thing your OC wants more than anything in the world? Are they open with that desire? Why or why not? What would they do to fulfill it?
he'll tell you that he wants to work for Esri and shill ArcGIS like he wa designed to. he doesn't want to be a failed prototype, like the ones who came before him. he wants to fulfill his destiny.
but, still, that's not what he really wants. he hasn't even unlocked that yet. he's not even real enough, by his own standards, to have deep-seated desires of his own.
however, that's not to say he still doesn't give into smaller desires. hes a bit of a sex addict. in fact, his creators never told him he was transgender (see: men get farther ahead in the workplace!!) until he first had sex and someone pointed out that most dudes didnt have a cunt. he was like. oh.
(arguably this is a form of betrayal too, waking up mind-wiped with a sex change you didnt exactly ask for but weren't even aware of. but hes not exactly complaining either, just confused)
fear: What is your OC's greatest fear? What do they do when confronted with it? Are they open with their fear, or do they hide it away?
probably that he'll never get that corporate job he was made for. like i said above, it would shatter him. he definitely isnt open about it. hes convinced if he works hard enough he can make it to the top
whos gonna tell him?
secret: What's one secret your OC never wants anyone to know about them?
you know? he just might actually be a person
2 notes
·
View notes
Text
Geospatial Management | GIS Integration, ARCGIS, 5G Solutions
Geospatial services including GIS integration, ARCGIS development, geo data visualization, utility mapping, 5G GIS, and custom GIS software solutions.
0 notes
Text
End-to-End Pipeline: Integrating Deep Learning with ArcGIS and Raster Analytics
The convergence of deep learning and geospatial technology is revolutionising the processing and analysis of spatial data. Businesses may create scalable, automated, and intelligent geospatial data pipelines by combining deep learning models with ArcGIS and Raster Analytics. Advanced application cases in urban planning, agriculture, disaster response, environmental monitoring, and other fields are made possible by this end-to-end integration, which enables real-time, cloud-based processing of massive raster datasets.
https://www.geowgs84.ai/post/end-to-end-pipeline-integrating-deep-learning-with-arcgis-and-raster-analytics
0 notes
Text
Mapextractor for Urban Planners: A Game Changer?
Urban planning is a complex process that requires accurate, up-to-date spatial data. From zoning and infrastructure to green space management and population analysis, every decision depends on high-quality geographic information. That’s where Mapextractor comes in—a tool that is rapidly becoming a game changer for urban planners around the world.
In this article, we’ll explore how Mapextractor is transforming urban planning and why it might be the tool your city development team has been waiting for.
🏙️ What Is Mapextractor?
Mapextractor is a web-based tool that allows users to select specific regions from a digital map and extract detailed geospatial data. With support for various file formats like GeoJSON, SHP, KML, and CSV, it’s designed to help users easily export map data for use in GIS platforms and planning software.
It offers features such as:
Area of Interest (AOI) selection
Layer-specific extraction (roads, buildings, parks, water bodies, etc.)
Multi-format export
Batch processing
API access for automation
🛠️ Why Urban Planners Need It
Urban planning requires extensive mapping work to analyze:
Land use and zoning
Transportation networks
Infrastructure layouts
Public amenities
Environmental impact zones
Traditional GIS platforms like ArcGIS or QGIS can perform these tasks but often require significant training and manual data preparation. Mapextractor simplifies this process, allowing planners to access ready-to-use data in minutes.
🌍 Key Features That Benefit Urban Planners
1. Quick Access to Accurate Data
Mapextractor allows planners to draw or input an exact AOI and instantly retrieve data on roads, buildings, green spaces, and more. This real-time extraction helps teams keep pace with tight project deadlines.
2. Multiple Export Formats
Whether you��re using ArcGIS, QGIS, or even Google Earth, Mapextractor delivers compatible file formats that integrate seamlessly with planning tools.
3. Layer Selection
Planners can extract only the data they need. For instance, if a transportation project is underway, they can isolate road networks and ignore other map layers, minimizing clutter and file size.
4. Cloud-Based and No Installation
Being entirely web-based, Mapextractor allows for collaboration across teams working remotely. There’s no need to install heavy GIS software on every computer.
5. Cost-Effective Solution
Mapextractor offers a free tier and affordable premium plans, making it ideal for small municipalities and consulting firms that might not have the budget for high-end GIS software.
🏗️ Use Case Examples
Transit Planning: Extract road and traffic data to optimize public transportation routes.
Zoning Analysis: Use building footprint data to identify high-density areas for rezoning.
Green Space Allocation: Analyze existing parks and green areas to plan for future development.
Emergency Services: Map existing fire stations, hospitals, and access roads for crisis response planning.
✅ Final Verdict: A True Game Changer
Mapextractor empowers urban planners by removing the technical barriers to geospatial data extraction. With its simplicity, flexibility, and speed, it's revolutionizing how cities and communities plan their growth.
If you're involved in urban development, infrastructure design, or land-use planning, Mapextractor is not just useful—it’s essential.
1 note
·
View note
Text
Geographic Information System (GIS) Software Market Size, Share, Trends, Demand, Growth, Challenges and Competitive Analysis
"Global Geographic Information System (GIS) Software Market - Size, Share, Demand, Industry Trends and Opportunities
Global Geographic Information System (GIS) Software Market By Component (Hardware and Software), Project Size (Small, Medium and Large), Organization (Small and Medium Sized Enterprises and Large Enterprises), Function (Mapping, Surveying, Telematics Navigation and Location Based Services), End User (Agriculture, Oil and Gas, Construction, Mining, Transportation, Utilities, and Others), Country (U.S., Canada, Mexico, Brazil, Argentina, Rest of South America, Germany, France, Italy, U.K., Belgium, Spain, Russia, Turkey, Netherlands, Switzerland, Rest of Europe, Japan, China, India, South Korea, Australia, Singapore, Malaysia, Thailand, Indonesia, Philippines, Rest of Asia-Pacific, U.A.E, Saudi Arabia, Egypt, South Africa, Israel, Rest of Middle East and Africa) Industry Trends
Access Full 350 Pages PDF Report @
**Segments**
- **Hardware**: The hardware segment in the GIS software market includes the physical components necessary for the implementation of Geographic Information Systems. This includes GPS devices, data collection tools, desktop computers, servers, and storage devices. The demand for hardware in the GIS software market is driven by the need for high-performance computing and data processing capabilities to handle large datasets efficiently.
- **Software**: The software segment comprises the various GIS applications and platforms that enable users to visualize, analyze, and interpret geospatial data. These software tools range from desktop GIS applications to web-based mapping platforms and cloud-based GIS services. The software segment is experiencing rapid growth due to the increasing adoption of location-based services across various industries.
- **Services**: The services segment in the GIS software market includes consulting, training, system integration, and support services provided by GIS vendors and third-party service providers. These services help organizations effectively implement and utilize GIS software solutions to address their specific business needs. The services segment is critical for ensuring the successful deployment and maintenance of GIS systems.
**Market Players**
- **Esri**: Esri is a leading provider of GIS software and services, offering a wide range of products for mapping, spatial analysis, and location intelligence. The company's ArcGIS platform is used by organizations worldwide for various applications, including urban planning, natural resource management, and emergency response.
- **Hexagon AB**: Hexagon AB is a global technology company that offers a comprehensive suite of geospatial solutions, including GIS software, remote sensing tools, and surveying instruments. The company's geospatial division provides software products such as ERDAS IMAGINE and GeoMedia for geospatial data processing and analysis.
- **Trimble Inc.**: Trimble Inc. is a leading provider of advanced positioning solutions, including GPS technology and GIS software for surveying, mapping, and precision agriculture applications. The company's product portfolio includes software products like Trimble Business Center and Trimble eCognition for geosEsri, Hexagon AB, and Trimble Inc. are key players in the GIS software market, each offering a unique set of products and services to cater to the diverse needs of organizations across industries. Esri, with its ArcGIS platform, stands out for its comprehensive suite of mapping and spatial analysis tools that have become the industry standard for GIS applications. The company's focus on innovation and continuous enhancement of its offerings has cemented its position as a market leader and trusted partner for organizations seeking robust geospatial solutions.
Hexagon AB, on the other hand, brings a strong emphasis on remote sensing and surveying instruments to the GIS software market. Its geospatial division, with products like ERDAS IMAGINE and GeoMedia, caters to the advanced data processing and analysis requirements of industries such as agriculture, environmental monitoring, and infrastructure planning. Hexagon AB's focus on providing end-to-end geospatial solutions has positioned it as a key player in the industry, known for its technological expertise and commitment to customer satisfaction.
Trimble Inc. differentiates itself in the GIS software market by offering advanced positioning solutions integrated with GIS software for applications in surveying, mapping, and precision agriculture. The company's software products such as Trimble Business Center and Trimble eCognition are designed to streamline geospatial data analysis and provide actionable insights for users in various sectors. Trimble Inc.'s strong presence in precision technology and spatial data management makes it a preferred choice for organizations looking to leverage GIS software for improved decision-making and operational efficiency.
Overall, the GIS software market is witnessing significant growth driven by the increasing adoption of location-based services across industries such as construction, transportation, utilities, and government. As organizations continue to recognize the value of geospatial data in enhancing decision-making processes and improving operational workflows, the demand for advanced GIS software solutions is expected to rise. Market players like Esri, Hexagon AB, and Trimble Inc. are well-positioned to capitalize on**Segments:**
- **Global Geographic Information System (GIS) Software Market By Component (Hardware and Software) - **Project Size (Small, Medium and Large) - **Organization (Small and Medium Sized Enterprises and Large Enterprises) - **Function (Mapping, Surveying, Telematics Navigation and Location Based Services) - **End User (Agriculture, Oil and Gas, Construction, Mining, Transportation, Utilities, and Others) - **Country (U.S., Canada, Mexico, Brazil, Argentina, Rest of South America, Germany, France, Italy, U.K., Belgium, Spain, Russia, Turkey, Netherlands, Switzerland, Rest of Europe, Japan, China, India, South Korea, Australia, Singapore, Malaysia, Thailand, Indonesia, Philippines, Rest of Asia-Pacific, U.A.E, Saudi Arabia, Egypt, South Africa, Israel, Rest of Middle East and Africa) Industry Trends and Forecast to 2028
The GIS software market is undergoing significant growth globally due to the rising demand for location-based services across various industries. The hardware segment, which includes essential physical components for GIS implementation such as GPS devices and servers, is driven by the need for high-performance computing and efficient data processing capabilities. The software segment is experiencing rapid expansion with a wide range of GIS applications and platforms enabling effective visualization, analysis, and interpretation of geospatial data. The services segment, encompassing consulting, training, and support services, plays a crucial role in ensuring the successful implementation and utilization
Key points covered in the report: -
The pivotal aspect considered in the global Geographic Information System (GIS) Software Market report consists of the major competitors functioning in the global market.
The report includes profiles of companies with prominent positions in the global market.
The sales, corporate strategies and technical capabilities of key manufacturers are also mentioned in the report.
The driving factors for the growth of the global Geographic Information System (GIS) Software Market are thoroughly explained along with in-depth descriptions of the industry end users.
The report also elucidates important application segments of the global market to readers/users.
This report performs a SWOT analysis of the market. In the final section, the report recalls the sentiments and perspectives of industry-prepared and trained experts.
The experts also evaluate the export/import policies that might propel the growth of the Global Geographic Information System (GIS) Software Market.
The Global Geographic Information System (GIS) Software Market report provides valuable information for policymakers, investors, stakeholders, service providers, producers, suppliers, and organizations operating in the industry and looking to purchase this research document.
TABLE OF CONTENTS
Part 01: Executive Summary
Part 02: Scope of the Report
Part 03: Research Methodology
Part 04: Market Landscape
Part 05: Pipeline Analysis
Part 06: Market Sizing
Part 07: Five Forces Analysis
Part 08: Market Segmentation
Part 09: Customer Landscape
Part 10: Regional Landscape
Part 11: Decision Framework
Part 12: Drivers and Challenges
Part 13: Market Trends
Part 14: Vendor Landscape
Part 15: Vendor Analysis
Part 16: Appendix
Countries Studied:
North America (Argentina, Brazil, Canada, Chile, Colombia, Mexico, Peru, United States, Rest of Americas)
Europe (Austria, Belgium, Denmark, Finland, France, Germany, Italy, Netherlands, Norway, Poland, Russia, Spain, Sweden, Switzerland, United Kingdom, Rest of Europe)
Middle-East and Africa (Egypt, Israel, Qatar, Saudi Arabia, South Africa, United Arab Emirates, Rest of MEA)
Asia-Pacific (Australia, Bangladesh, China, India, Indonesia, Japan, Malaysia, Philippines, Singapore, South Korea, Sri Lanka, Thailand, Taiwan, Rest of Asia-Pacific)
Browse Trending Reports:
Empty Capsules Market Temperature Sensor Market Fusion Splicer Market Methylene Diphenyl Diisocyanate (MDI), Toluene Diisocyanate (TDI) and Polyurethane Market Laser Cleaning Market Flotation Reagents Market Sugar Confectionery Market Wipes Market Monorail Market Geographic Information System (GIS) Software Market MLOPs Market Feed Flavors and Sweeteners Market
About Data Bridge Market Research:
Data Bridge set forth itself as an unconventional and neoteric Market research and consulting firm with unparalleled level of resilience and integrated approaches. We are determined to unearth the best market opportunities and foster efficient information for your business to thrive in the market. Data Bridge endeavors to provide appropriate solutions to the complex business challenges and initiates an effortless decision-making process.
Contact Us:
Data Bridge Market Research
US: +1 614 591 3140
UK: +44 845 154 9652
APAC : +653 1251 975
Email: [email protected]"
0 notes
Text

ArcGIS Pro Made Easy! Learn GIS Mapping & Analysis with Udemy
🗺️ New to ArcGIS Pro? This course makes learning GIS fun and easy! Gain real-world skills in mapping, spatial analysis, and geospatial data handling with hands-on exercises.
🔥 GET DISCOUNT 48% OFF (ONLY $12.99 FROM $19.99) – LIMITED TIME, ENROLL NOW !
📌 Start today & become a GIS expert in no time!
#GISbeginner#ArcGISProTutorial#SpatialAnalysis#ArcGISProtraining#LearnMapping#GISdata#GeospatialScience#CartographyTips#GISlearning#UdemyGIS🚀
0 notes
Text
How to Integrate Postal Code Data into GIS Applications
In a world driven by geographic insights, Geographic Information Systems (GIS) are essential for businesses to visualize, analyze, and interpret spatial data. Whether you're mapping customer locations, optimizing delivery routes, or managing infrastructure, GIS applications are powerful tools. To maximize their effectiveness, integrating accurate postal code data is crucial—especially when dealing with regional segmentation in Canada. This is where a Canadian zip code database proves invaluable.
Why Postal Code Data Matters in GIS
GIS relies heavily on accurate geolocation data. Postal codes are foundational units that provide structured location data for mapping, logistics, demographic analysis, and planning. By integrating a Canadian zip code database, users can create precise geographic boundaries, filter populations by region, and even develop heatmaps based on postal zones.
In sectors like urban planning, marketing, public health, and logistics, accurate postal code layers add depth to spatial datasets. This allows organizations to make informed decisions with strong geographic context.
Key Steps to Integrating Postal Code Data
Choose a Reliable Data Source
Start by obtaining a trusted dataset. The Canadian zip code database from Zip-Codes.com includes FSA and LDU codes, along with city, province, latitude, longitude, time zone, and population data.
Import into Your GIS Platform
Most modern GIS tools like ArcGIS, QGIS, and MapInfo support CSV or Excel imports. Ensure your dataset includes coordinates to allow for point plotting or polygon generation.
Create Custom Layers
With postal code data integrated, you can build custom layers for analysis. These layers can represent delivery zones, customer clusters, or service coverage areas.
Enable Geospatial Analysis
Use postal code boundaries to analyze patterns in customer behavior, product demand, or accessibility. This supports decision-making in sales, service delivery, and logistics.
Use Case for Business Intelligence
When integrated with business data, postal code GIS layers help teams identify underserved areas, manage expansion plans, or analyze competitor locations. For retail and service companies, this boosts targeting accuracy and strategic planning.
Final Consideration
Integrating a Canadian zip code database into your GIS platform opens up a world of insights, from improving service delivery to refining marketing strategies. With accurate and updated postal code data, your spatial analytics become sharper and more actionable.
For reliable datasets and easy integration, explore the tools and solutions offered by Zip-Codes.com.
0 notes
Text
Geographic Information Systems (GIS) Development

Geographic Information Systems (GIS) have revolutionized the way we interact with spatial data. From city planning to environmental monitoring and logistics, GIS is a powerful tool that combines maps with data for smarter decision-making. In this post, we'll explore what GIS is, the technologies involved, and how to get started with GIS application development.
What is GIS?
GIS stands for Geographic Information Systems, which are tools and systems used to capture, store, analyze, manage, and visualize spatial or geographic data. These systems are essential for analyzing patterns, relationships, and geographic trends across various fields.
Applications of GIS
Urban Planning: Design infrastructure based on population density and land usage data.
Environmental Monitoring: Track climate changes, deforestation, or water quality.
Disaster Management: Map hazard zones and optimize emergency response logistics.
Transportation & Logistics: Optimize routes, manage traffic, and plan delivery systems.
Agriculture: Analyze crop health and soil conditions using satellite imagery.
Key Components of GIS Development
Data: Spatial data (coordinates, maps, images) and attribute data (information about the location).
Maps: Visual representations created from layers of geographic data.
Tools: GIS software and libraries for manipulating and analyzing the data.
Applications: Web or mobile interfaces for users to interact with spatial information.
Popular Tools and Libraries
QGIS: Open-source GIS desktop application for analyzing and visualizing spatial data.
ArcGIS: Enterprise-grade software suite by Esri, used for advanced GIS development.
Leaflet.js: Lightweight JavaScript library for creating interactive maps.
Mapbox: Modern mapping platform with customizable maps and location-based APIs.
GDAL/OGR: Libraries for raster and vector geospatial data manipulation.
PostGIS: A spatial database extender for PostgreSQL.
Basic GIS Development Workflow
Collect Geographic Data: Use satellite data, GPS devices, or public databases like OpenStreetMap.
Preprocess the Data: Clean, convert, and format the data (e.g., shapefiles, GeoJSON, KML).
Store Data: Use spatial databases like PostGIS to manage geodata efficiently.
Develop the Interface: Create web or mobile applications using Leaflet, Mapbox, or OpenLayers.
Analyze Spatial Relationships: Implement queries and analytics to derive insights.
Visualize the Results: Present data in layers, markers, and thematic maps.
Sample Project: Visualizing Population Density with Leaflet.js
<script> var map = L.map('map').setView([40.7128, -74.0060], 11); L.tileLayer('https://{s}.tile.openstreetmap.org/{z}/{x}/{y}.png').addTo(map); // Add GeoJSON layer L.geoJSON(populationData, { style: function (feature) { return { fillColor: getColor(feature.properties.density), weight: 1, opacity: 1, color: 'white', fillOpacity: 0.7 }; } }).addTo(map); </script>
Challenges in GIS Development
Handling large datasets and real-time updates.
Ensuring accuracy and relevance of geographic data.
Managing performance and rendering complex map layers.
Integrating with external services and APIs.
Conclusion
GIS development is a rewarding field that blends programming, data science, and geography. As more industries recognize the value of spatial insights, GIS applications will continue to play a vital role in shaping our world. Whether you're visualizing data on a map or building complex spatial analysis tools, GIS offers endless opportunities for developers to create impactful solutions.
1 note
·
View note
Text
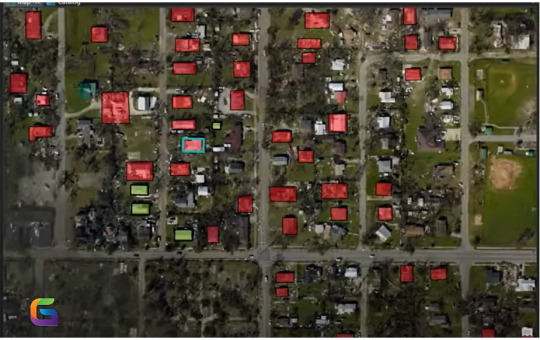
Geospatial Imagery Analytics Market Overview: Industry Growth and Key Drivers 2032
Geospatial Imagery Analytics Market size was valued at USD 15.8 Billion in 2023 and is expected to grow to USD 197.4 Billion by 2032 and grow at a CAGR of 32.4% over the forecast period of 2024-2032
Geospatial Imagery Analytics Market is witnessing remarkable growth, driven by advancements in satellite technology, artificial intelligence (AI), and cloud computing. The increasing demand for real-time data, coupled with the expansion of remote sensing applications, is fueling industry expansion. Organizations across defense, agriculture, urban planning, and disaster management are leveraging geospatial analytics for enhanced decision-making.
Geospatial Imagery Analytics Market continues to evolve as industries adopt AI-driven image processing, big data analytics, and Geographic Information Systems (GIS). The ability to extract meaningful insights from satellite, drone, and aerial imagery is transforming sectors ranging from environmental monitoring to infrastructure development. As governments and private enterprises invest in geospatial intelligence, the market is set for exponential growth in the coming years.
Get Sample Copy of This Report: https://www.snsinsider.com/sample-request/3724
Market Keyplayers:
Satellogic Inc. (Aleph-1 Constellation, Satellogic’s High-Resolution Multispectral Imagery)
Maxar Technologies (WorldView-3, GeoEye-1)
Planet Labs PBC (PlanetScope, SkySat)
Hexagon AB (ERDAS IMAGINE, Luciad Portfolio)
Airbus Defence and Space (Pleiades Neo, SPOT 6/7)
Esri (ArcGIS, ArcGIS Image for ArcGIS Online)
Orbital Insight (GO Platform, Orbital Insight’s Geospatial Analytics)
BlackSky Global (Spectra AI, BlackSky Monitoring)
L3Harris Technologies (ENVI, Geospatial eXploitation Products - GXP)
Capella Space (Capella Synthetic Aperture Radar, Capella Console)
Market Trends Driving Growth
1. Integration of AI and Machine Learning in Image Processing
AI and machine learning (ML) are revolutionizing geospatial imagery analytics by enabling automated data interpretation. Advanced algorithms can detect patterns, classify objects, and monitor changes in landscapes with unparalleled accuracy. These technologies are particularly beneficial in defense, agriculture, and climate monitoring.
2. Rising Demand for Real-Time and Predictive Analytics
With the surge in satellite deployments and drone technology, real-time geospatial data collection is becoming a critical asset. Organizations are leveraging predictive analytics to forecast natural disasters, assess crop health, and manage urban planning projects effectively.
3. Expansion of Cloud-Based Geospatial Solutions
Cloud computing is enhancing accessibility to geospatial data by enabling scalable storage, processing, and sharing capabilities. Cloud-based platforms are reducing costs and allowing businesses to utilize geospatial analytics without heavy infrastructure investments.
4. Growing Adoption in Smart Cities and Infrastructure Development
Governments and urban planners are using geospatial analytics to design smart cities, optimize traffic management, and enhance public safety. The technology aids in mapping utilities, tracking environmental changes, and improving land-use planning.
5. Increasing Role in Defense and Security
The defense sector is a key adopter of geospatial imagery analytics, utilizing satellite imagery for surveillance, intelligence gathering, and threat assessment. Military organizations are investing in high-resolution imaging and geospatial AI to enhance national security strategies.
Enquiry of This Report: https://www.snsinsider.com/enquiry/3724
Market Segmentation
By Imaging Type
Video
Image
By Deployment Mode
Cloud
On-premises
By Collection Medium
Geographic Information System (GIS)
Satellite Imagery
Others
By Application
Weather Conditions Monitoring
Disaster Management
Urban Planning/Development
Natural Resource Exploration
Others
By End-user
Defense & Security
Healthcare
Retail & Logistics
Government
Banking, Financial Services & Insurance (BFSI)
Mining/Manufacturing
Agriculture
Market Analysis and Current Landscape
Key factors driving market growth include:
Advancements in remote sensing technology: High-resolution imaging and LiDAR (Light Detection and Ranging) are improving data accuracy.
Increasing commercial adoption: Businesses in logistics, agriculture, and real estate are utilizing geospatial intelligence for operational efficiency.
Rising investments in space programs: Countries are launching satellites dedicated to earth observation, climate monitoring, and disaster response.
Proliferation of drones for aerial analytics: Drones equipped with high-definition cameras and sensors are providing real-time geospatial insights.
Despite its rapid expansion, the market faces challenges such as data privacy concerns, high costs of satellite imaging, and the complexity of analyzing vast amounts of data. However, ongoing technological advancements and regulatory frameworks are addressing these challenges.
Future Prospects: What Lies Ahead?
1. Enhanced AI and Deep Learning Applications
The integration of deep learning with geospatial analytics will refine object recognition, automated mapping, and predictive modeling, leading to more precise and actionable insights.
2. Increased Use of Small Satellites and CubeSats
The rise of small satellite constellations, such as CubeSats, is reducing costs while providing high-frequency, real-time imaging capabilities for various industries.
3. Development of 3D Geospatial Analytics
The evolution of 3D mapping technologies will enhance applications in urban planning, construction, and environmental monitoring, offering more immersive and detailed visualization.
4. Blockchain for Geospatial Data Security
Blockchain technology is being explored to secure geospatial data transactions, ensuring data authenticity and preventing manipulation.
5. Growth in Climate Monitoring and Environmental Sustainability
As climate change concerns intensify, geospatial analytics will play a crucial role in monitoring deforestation, tracking pollution levels, and supporting conservation efforts worldwide.
Access Complete Report: https://www.snsinsider.com/reports/geospatial-imagery-analytics-market-3724
Conclusion
The Geospatial Imagery Analytics Market is set for sustained growth, driven by rapid technological advancements, increasing demand across multiple sectors, and rising investments in AI-powered data processing. As businesses, governments, and research institutions continue to harness geospatial intelligence, the industry will play a pivotal role in shaping the future of decision-making, security, and environmental sustainability. The market’s expansion will be defined by innovation, improved accessibility, and the seamless integration of geospatial insights into everyday operations.
About Us:
SNS Insider is one of the leading market research and consulting agencies that dominates the market research industry globally. Our company's aim is to give clients the knowledge they require in order to function in changing circumstances. In order to give you current, accurate market data, consumer insights, and opinions so that you can make decisions with confidence, we employ a variety of techniques, including surveys, video talks, and focus groups around the world.
Contact Us:
Jagney Dave - Vice President of Client Engagement
Phone: +1-315 636 4242 (US) | +44- 20 3290 5010 (UK)
#Geospatial Imagery Analytics Market#Geospatial Imagery Analytics Market Growth#Geospatial Imagery Analytics Market Trends#Geospatial Imagery Analytics Market Scope
0 notes
Text
Geospatial Analysis Software: How to Choose the Best One for You
Introduction
In today's data-driven world, geospatial analysis software is very important for businesses, researchers, and governments. If you are looking at changes in the environment, improving supply chain logistics, or studying population trends, choosing the right geospatial software can greatly impact on how well things work and your decision-making.
This guide will help you understand key things to consider when choosing geospatial analysis software. It will also show you a good choice: Exalogic's Geospatial Services.
What is Geospatial Analysis Software?
Geospatial analysis software helps people see, understand, and explain spatial data. It combines geographic information with tools to help groups make good decisions.
Why is Geospatial Analysis Important?
Better Decision Making – Companies can make choices based on location with high accuracy.
More Effectiveness – It automates how we handle location data, reducing manual work.
Improved Management – It helps industries make their operations better.
Risk Assessment – It predicts risks to the environment and issues in infrastructure.
Key Points to Think About in Geospatial Analysis Software
1. User-Friendly Interface
The software needs to be simple to use. It should help people view and understand data with little training.
2. Data Integration Capabilities
Look for software that can manage various types of data. This means it should work with GIS, CAD, remote sensing, and real-time data feeds.
3. Advanced Visualization Tools
Good mapping tools, 3D images, and interactive dashboards can make analysis and reporting better.
4. Scalability & Performance
Choose a software that can handle large data and grow as your organization gets bigger.
5. Cloud-Based vs. On-Premise Solutions
Cloud-Based – You can work from anywhere, and it updates on its own.
On-Premise – You get better security and can customize things to fit your needs.
6. AI and Machine Learning Integration
Modern software uses AI to look at future trends and find patterns by itself.
7. Cost & Licensing Options
Check if the software has subscription plans, one-time purchases, or business licenses.
Top Geospatial Analysis Software Options
1. ArcGIS
A well-known GIS software that has great mapping and space analysis tools.
2. QGIS
Open-source GIS software is great for anyone who wants affordable and customizable options.
3. Google Earth Engine
A cloud platform to study large environmental data.
4. Exalogic's Geospatial Services
Exalogic's Geospatial Services offer new solutions for businesses and groups that need live geospatial analysis. With AI insights and tools that can be adjusted, Exalogic helps different industries make better decisions and manage their spatial data more effectively.
Choosing the right geospatial software can be hard. There are many options, and each one offers different features. Start by deciding what you need the software to do. Think about the specific tasks or projects you will work on. After that, check the features of each option. See if it has the tools you need. It’s also important to consider how easy the software is to use. You want something that is simple to understand. Finally, look at the price. Make sure it fits your budget. Following these steps will help you find the best geospatial software for you.
Step 1: Define Your Requirements
Think about why you need the software. It may be for mapping, remote sensing, city planning, or business analysis.
Step 2: Evaluate Compatibility
Make sure the software fits well with your current systems. It should also work with how your data is set up.
Step 3: Consider User Support & Community
Pick software that offers strong technical help, helpful training tools, and a lively user group.
Step 4: Test a Demo or Free Trial
Many software solutions offer free trials. This allows you to test the features before you decide to commit.
Step 5: Review Pricing & Long-Term Costs
Think about licensing fees, training costs, and upgrades when you make your choice.
Conclusion
Picking the right geospatial analysis software can improve how you view and use spatial data. No matter if you are a large company, a government agency, or an individual researcher, it’s key to choose a tool that matches your needs. For a reliable and flexible geospatial solution, look at Exalogic's Geospatial Services. You can find new ways to study spatial data.
0 notes
Text
Accelerating the integration of BIM and GIS: Innovative solution to convert RVT to 3DTiles with GISBox
Free on-premise cesium ion alternative
In the fields of smart cities, digital twins, and infrastructure construction, the fusion of BIM (Building Information Modeling) and GIS (Geographic Information System) is an irreversible trend. BIM excels at expressing the shape and attribute information of building components, while GIS excels at managing and visualizing wide-area geospatial data. However, there are significant differences in data format and display logic between these two technologies, and in particular, there are issues with low conversion efficiency, reduced model accuracy, and missing attribute information when converting from RVT (Revit’s native format) to the 3DTiles format used in GIS.
To solve these technical issues, a software platform specialized in 3D data processing, “GISBox,” has been launched. GISBox demonstrates excellent performance and stability in converting RVT to 3DTiles, overcoming the problems of conventional tools. In addition, it is equipped with an automatic optimization function for LOD (level of detail), enabling smooth web display of large-scale 3D scenes.

Strengths of the high-precision, high-performance RVT to 3DTiles conversion engine
1. Directly analyzes Revit models and fully preserves attribute information GISBox can directly read RVT files and convert them without going through intermediate formats such as IFC or FBX. This allows you to preserve BIM attribute information such as the structure’s shape, material, category, ID, and custom parameters without compromising them.
2. Automatic LOD generation for comfortable display of large-scale scenes
GISBox is equipped with an LOD generation engine to handle huge models such as city scale and large campuses. It automatically generates the optimal hierarchical structure according to the complexity of the model and the user’s viewing range, achieving a display with “high resolution near and light weight far away.”

Integration with various GIS platforms The 3DTiles output by GISBox conforms to OGC standards and is compatible with the following major platforms:
CesiumJS: Realizes high-precision web 3D visualization instantly
Mapbox GL: Ideal for integrating with vector maps
SuperMap / ArcGIS: Can be integrated with major GIS solutions in Japan
GISBox also provides an OpenAPI interface, and its batch processing and automatic publishing functions allow it to flexibly support enterprise and government systems.
Examples of BIM x GIS integration
Smart city: Government converts BIM building models into 3DTiles and integrates them into a digital platform for urban management and emergency response.
Infrastructure construction collaboration: Design offices publish Revit construction models on the web and conduct joint confirmations with the site and clients remotely.
Digital preservation of cultural assets: BIM data of historical buildings is made lighter and 3D views are published on the browser. Contributing to education and cultural promotion.
Conclusion: The era of “moving” 3D data with GISBox
Conversion from RVT to 3DTiles is not just a format conversion, but an important step to realize the semantic integration of BIM and GIS. GISBox acts as a bridge to enable BIM data to demonstrate its true value in the GIS world with powerful functions such as an excellent conversion engine, attribute information retention, automatic LOD optimization, and multi-platform support.
In the data-driven future, GISBox will be an indispensable partner in various scenes, from smart city construction to infrastructure design and cultural property preservation.
GISBox Official Teams: https://teams.live.com/l/invite/FEAr12sInvEVy4hFQE Official Teams Group: https://teams.live.com/l/invite/FBAFp0pbqhqlpe1BQI
Contact us to get 7-day Team Plan
0 notes
Text
Pursuing A Career In Geoinformatics: A Guide To MSc Geoinformatics Colleges In India
The field of Geoinformatics is gaining immense popularity as industries increasingly rely on spatial data and geographic information systems (GIS) for decision-making. From urban planning to environmental management, Geoinformatics plays a crucial role in multiple sectors. If you are looking for the best MSc Geoinformatics Colleges in India, this guide will help you understand the scope, opportunities, and educational paths available in this domain.
What Is Geoinformatics?
Geoinformatics is an interdisciplinary field that integrates geography, computer science, and data analysis to study spatial and geographic information. It involves technologies like remote sensing, GPS, and GIS, which are essential for analyzing and managing spatial data.
Why Pursue A Master’s In Geoinformatics?
A Master’s in Geoinformatics provides specialized knowledge in spatial data analysis, geospatial modeling, and remote sensing applications. Graduates with expertise in this field are highly sought after in industries such as urban planning, disaster management, environmental conservation, and defense.
Scope And Career Opportunities
The demand for geospatial experts is rapidly increasing. Some key career opportunities include:
GIS Analyst — Works with spatial data for mapping and analysis.
Remote Sensing Specialist — Uses satellite imagery for environmental and urban studies.
Urban Planner — Designs smart cities using geospatial data.
Disaster Management Expert — Utilises GIS for risk assessment and emergency response.
Researcher in Geoinformatics — Contributes to technological advancements in spatial analysis.
Top GIS Courses In India
Several institutions offer high-quality GIS Courses in India, equipping students with technical skills and industry knowledge. These courses cover advanced geospatial technologies, programming for GIS, and applications in various sectors. The curriculum typically includes hands-on training in software like ArcGIS, QGIS, and Google Earth Engine.
Choosing The Right MSc Geoinformatics Colleges In India
When selecting an institute, consider factors such as faculty expertise, research facilities, industry collaborations, and placement opportunities. Leading institutions provide state-of-the-art labs, practical exposure, and partnerships with global organizations to enhance learning experiences.
Conclusion
For those aspiring to build a strong career in Geoinformatics, Symbiosis Institute of Geoinformatics (SIG) stands out as one of the premier institutions in India. SIG offers comprehensive academic programs, cutting-edge research opportunities, and excellent industry exposure, making it an ideal choice for students pursuing a Master’s in Geoinformatics.
0 notes
Text
ArcGIS Pro is GIS software for spatial analysis, 3D mapping, and geographic data management. Compared to ArcMap, ArcGIS Pro offers a more intuitive interface, faster performance, and cloud integration. This software supports advanced geospatial analysis and is compatible with a variety of GIS data formats. Get a basic ArcGIS Pro 3 video tutorial here
#attribute query#select by attribute#feature info#opensource#gis operator#geodatabase#spatial query#select by location#location allocation#location intelligence#location based services#gis#geoserver#arcgis#esri#openlayers#wms#wfs#web mapping#leaflet#shapefile#qgis#geonode#freelancer#gis analyst#gis jobs#webgis#development#gis professional#project management
0 notes