#presented data analysis
Explore tagged Tumblr posts
Visit Tumblr Blog
Explore Tumblr blogs with no restrictions, modern design and the best experience.
Last Seen Tumblr Blogs


Fun Fact
Post activity is at the highest at 4:00 pm EDT; notes peak at 10:00 pm EDT.
Text
So I just won a competition for my research project…
MOM DAD IM A REAL SCIENTIST!!
#pretty crazy but yeah#we were doing a country wide data analysis on breast cancer incidence rates and ambient air pollution#multiple linear regression and what not#I wrote a manuscript and everything it was so cool!#now we present at nationals and have 0 chance of winning#but wtv#the process was more than satisfying!#studyblr#not studyspo#stem academia
55 notes
·
View notes
Text
the thing about my stupid thesis is that i love my lesbian boss slash thesis advisor and ive been working on this project for two years and i care about it and find it interesting and theoretically this work as the basis for my chance to demonstrate what ive joyfully and enthusiastically learned across the last four years should be a rewarding exciting opportunity but i was overly ambitious with my thesis proposal and feel this constant pressure to be inventive and incisive due to my deliberately interdisciplinary training on top of regular old academic pressure and the impossibility of pleasing aforementioned lesbian boss thesis advisor and ive also invested such a personal emotional degree into it that criticism is kind of terrifying and unbearable and also i really dont know anything about statistics and then my shit got rocked by the fires effectively throwing everything in my system out of whack in ways i can barely identify
#and i have to get enough done to present at a conference in 6 weeks. ahhh#and its stupid because i dug myself this hole and i refuse to climb out of it. Like i keep complaining that my friends doing much more#conventional research in established labs have it way easier but lesbian boss keeps reminding me that i dont have to be doing something new#and that with our data there are a number of much easier analyses i could do except i wouldnt be satisfied with that. because this is my#chance to intervene in flawed modes of scientific knowledge production this is my opportunity for experimental methodology that questions#sedimented epistemes also if im being honest i know that the easier analyses exist but i cant really imagine them because i have realized#scientific analysis doesnt come easily to me i have much more a head for theory. and also? the thesis class at this school is run like shit
9 notes
·
View notes
Text
okay alright okay I can get through my workload tonight I absolutely can do it I am going to get through all of these assignments and it will be fine!
#I have: two discussion posts. an annotation assignment. notes to make for a group project. data analysis. and some additional research.#tomorrow I've gotta do a reference interview and then do some more research.#and then I have some presentation slides and a draft final.#okay I got this it's cool it's fine!#megs vs mlis
52 notes
·
View notes
Text
i want to watch mash and i want to watch yesterdays fortnite friday and todays "what went wrong with fortnight friday" but i have a scholarship application due monday, a lab report and assignment due tuesday, a 40-minute oral presentation on wednesday, and another assignment on thursday. and also dentist on monday + 4 hours of teaching (paid) + 4 hours of tutoring (volunteer) + a concert on wednesday + pancake breakfast on thursday. on top of classes. so. no watching things for me until friday i guess </3
#i speak#application will take an hour max so thats what im finishing rn#assignment is mostly done and is also an hour max (im still stuck on that ugly ass polynomial so im letting one of my friends do it first)#lab report is half done? my data analysis is weird but once i get that fixed it should be finishable tonight tbh#presentation is. maybeee half done. my goal today is to get everything on the slides. tomorrow is for cleaning it up#and assignment 2 wont be that bad because ive already gotten a quarter done#oh and also we have no car
2 notes
·
View notes
Text
Rant under the cut
The next two weeks after USamerican thanksgiving is gonna be hell for me I hate how horrible I feel
#hell weeks truly#finals + PRESENTATIONS#projects#I’m fucked in that one class about data analysis it makes me wanna cry#I don’t have have that weekend in the beginning of December because I’ll be traveling#rawr#there’s like not butteflies in my stomach but like acid#how#rant#personal#I’ll make it through though don’t worry (me @myslef)
2 notes
·
View notes
Text
YGHHHHFHF interviews are a joke
#‘tell me about a time that you had to explain a complex technical problem to someone with little technical background’ no. fuck uou#i don’t Have an experience like this. unless we’re considering my incomprehensible rambles on here which i don’t think count as explaining#the problem is that i incorporate the arts into my engineering assignments and conversations all the time ex flute experiment for data#analysis class. and i have to explain what’s going on there bc most ppl in engineering do not know these things. but there aren’t really any#opportunities to do the opposite w arts ppl like no humanities class is giving me an assignment that lets me just go on abt coding or logic#gates or breadboards or whatever#personal#the engineering chronicles#also ‘why are manhole covers round’ ?????#this wasn’t a real interview ftr. just a practice one that im drafting answers to rn. but#edit okay just made up some bullsht abt a presentation to my honors class on coding. it’s not totally bullshit because i did actually plan#to give a presentation on this (assignment was to pick smth you know a lot abt that most ppl in the room wouldn’t and just talk abt it) but#ended up not having to bc it was a super informal thing that we wound up moving on after a class period but they don’t need to know that so.
2 notes
·
View notes
Text
Centreoftheselights just shared the new 2024 AO3 stats.
In less than two days their post has already received 16 MILLION views and 80 THOUSAND retweets/quote tweets, with every comment I've seen taking the data at face value and using it to draw conclusions, much to my horror.
While OP did change the title of the "new works" column to "works gained" so that they're at least not blatantly lying now (the bare minimum), the wording is still very misleading. More importantly though they continue to use the same extremely flawed methodology and continue to bury and obfuscate those flaws and what the data actually represents. Nowhere on the chart or the details provided on the main page does it even say that only publicly available works are counted... and that's not even the biggest problem!
This data is, yet again, garbage and absolutely should not be used to determine the current size and popularity of a fandom (inarguably the main reason for it existing).
AO3 Ship Stats: Year In Bad Data
You may have seen this AO3 Year In Review.
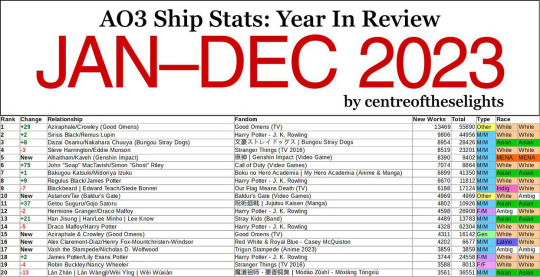
It hasn’t crossed my tumblr dash but it sure is circulating on twitter with 3.5M views, 10K likes, 17K retweets and counting. Normally this would be great! I love data and charts and comparisons!
Except this data is GARBAGE and belongs in the TRASH.
I first noticed something fishy when I realized that Steve/Bucky – the 5th largest ship on AO3 by total fic count – wasn’t on this Top 100 list anywhere. I know Marvel’s popularity has fallen in recent years, but not that much. Especially considering some of the other ships that made it on the list. You mean to tell me a femslash HP ship (Mary MacDonald/Lily Potter) in which one half of the pairing was so minor I had to look up her name because she was only mentioned once in a single flashback scene beat fandom juggernaut Stucky? I call bullshit.
Now obviously jumping to conclusions based on gut instinct alone is horrible practice... but it is a good place to start. So let’s look at the actual numbers and discover why this entire dataset sits on a throne of lies.
Here are the results of filtering the Steve/Bucky tag for all works created between Jan 1, 2023 and Dec 31, 2023:

Not only would that place Steve/Bucky at #23 on this list, if the other counts are correct (hint: they're not), it’s also well above the 1520-new-work cutoff of the #100 spot. So how the fuck is it not on the list? Let’s check out the author’s FAQ to see if there’s some important factor we’re missing.
The first thing you’ll probably notice in the FAQ is that the data is being scraped from publicly available works. That means anything privated and only accessible to logged-in users isn’t counted. This is Sin #1. Already the data is inaccurate because we’re not actually counting all of the published fics, but the bots needed to do data collection on this scale can't easily scrape privated fics so I kinda get it. We’ll roll with this for now and see if it at least makes the numbers make more sense:

Nope. Logging out only reduced the total by a couple hundred. Even if one were to choose the most restrictive possible definition of "new works" and filter out all crossovers and incomplete fics, Steve/Bucky would still have a yearly total of 2,305. Yet the list claims their total is somewhere below 1,500? What the fuck is going on here?
Let’s look at another ship for comparison. This time one that’s very recent and popular enough to make it on the list so we have an actual reference value for comparison: Nick/Charlie (Heartstopper). According to the list, this ship sits at #34 this year with a total of 2630 new works. But what’s AO3 say?

Off by a hundred or so but the values are much closer at least!
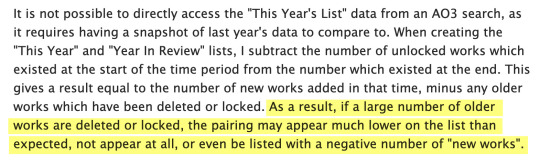
If we dig further into the FAQ though we discover Sin #2 (and the most egregious): the counting method. The yearly fic counts are NOT determined by filtering for a certain time period, they’re determined by simply taking a snapshot of the total number of fics in a ship tag at the end of the year and subtracting the previous end-of-year total. For example, if you check a ship tag on Jan 1, 2023 and it has 10,000 fics and check it again on Jan 1, 2024 and it now has 12,000 fics, the difference (2,000) would be the number of "new works" on this chart.
At first glance this subtraction method might seem like a perfectly valid way to count fics, and it’s certainly the easiest way, but it can and did have major consequences to the point of making the entire dataset functionally meaningless. Why? If any older works are deleted or privated, every single one of those will be subtracted from the current year fic count. And to make the problem even worse, beginning at the end of last year there was a big scare about AI scraping fics from AO3, which caused hundreds, if not thousands, of users to lock down their fics or delete them.
The magnitude of this fuck up may not be immediately obvious so let’s look at an example to see how this works in practice.
Say we have two ships. Ship A is more than a decade old with a large fanbase. Ship B is only a couple years old but gaining traction. On Jan 1, 2023, Ship A had a catalog of 50,000 fics and ship B had 5,000. Both ships have 3,000 new works published in 2023. However, 4% of the older works in each fandom were either privated or deleted during that same time (this percentage is was just chosen to make the math easy but it’s close to reality).
Ship A: 50,000 x 4% = 2,000 removed works Ship B: 5,000 x 4% = 200 removed works
Ship A: 3,000 - 2,000 = 1,000 "new" works Ship B: 3,000 - 200 = 2,800 "new" works
This gives Ship A a net gain of 1,000 and Ship B a net gain of 2,800 despite both fandoms producing the exact same number of new works that year. And neither one of these reported counts are the actual new works count (3,000). THIS explains the drastic difference in ranking between a ship like Steve/Bucky and Nick/Charlie.
How is this a useful measure of anything? You can't draw any conclusions about the current size and popularity of a fandom based on this data.
With this system, not only is the reported "new works" count incorrect, the older, larger fandom will always be punished and it’s count disproportionately reduced simply for the sin of being an older, larger fandom. This example doesn’t even take into account that people are going to be way more likely to delete an old fic they're no longer proud of in a fandom they no longer care about than a fic that was just written, so the deletion percentage for the older fandom should theoretically be even larger in comparison.
And if that wasn't bad enough, the author of this "study" KNEW the data was tainted and chose to present it as meaningful anyway. You will only find this if you click through to the FAQ and read about the author’s methodology, something 99.99% of people will NOT do (and even those who do may not understand the true significance of this problem):

The author may try to argue their post states that the tags "which had the greatest gain in total public fanworks” are shown on the chart, which makes it not a lie, but a error on the viewer’s part in not interpreting their data correctly. This is bullshit. Their chart CLEARLY titles the fic count column “New Works” which it explicitly is NOT, by their own admission! It should be titled “Net Gain in Works” or something similar.
Even if it were correctly titled though, the general public would not understand the difference, would interpret the numbers as new works anyway (because net gain is functionally meaningless as we've just discovered), and would base conclusions on their incorrect assumptions. There’s no getting around that… other than doing the counts correctly in the first place. This would be a much larger task but I strongly believe you shouldn’t take on a project like this if you can’t do it right.
To sum up, just because someone put a lot of work into gathering data and making a nice color-coded chart, doesn’t mean the data is GOOD or VALUABLE.
#please keep spreading this post#and for the love of god please do not spread these 'studies'#every time someone trusts their data and uses it in any kind of fandom analysis I die a little bit inside#16 MILLION VIEWS!#it should be illegal to spread misinformation to that many people#I will not rest until OP learns how to collect and present data correctly#ao3#ao3 stats#fandom
4K notes
·
View notes
Text
"Digitization in progress": Yuu, Touko, Reference rooms, and keeping secrets
The student council floor plan shown at the beginning of Vol. 2 of the Bloom Into You manga. Note how the reference room, which is close to the door has a note “digitization in progress,” implying that the records in this room are being digitized. Sorry for the blurriness but it was hard to photograph this on my phone. Last year, I bought volume 2 of Bloom Into You, a yuri romance manga series…

View On WordPress
#anime-manga comparison#asexuality#Be gay do crime#Bloom Into You#Bloom Into You: Regarding Saeki Sayaka#data analysis#files#kissing#LGBTQ+#No Archivist Present#paperwork#recordkeeping#reference#repositories#yuri
0 notes
Text
when i was in elementary school i used to ask my teachers for extra homework. and i think as an adult my bosses can smell that on me because they really think im superwoman or a renaissance man or something
#when did i become a data analysis expert lmfaooo like why im over here looking at numbers and making presentations#it is fun tho like one thing bout me imma observe that pattern honey#i just have no formal training in this shit 😭 like what does over-index mean#that’s a new one i learned the other day actually HAHA#hashtag Value Add#🔮
1 note
·
View note
Text
CHAPTER 4: PAANO ISULAT ANG PRESENTATION, ANALYSIS AND INTERPRETATION OF DATA (WITH SAMPLE)
FOLLOW ME: Tiktok Facebook Instagram … source
0 notes
Text
Graphy.app Data Visualization Made Easy (and Fast!)
Stop struggling with data! Graphy.app makes creating beautiful, impactful graphs a breeze. See how easy it is!" #datavisualization #graphs #dataanalysis #graphyapp #productivity #businesstools #analytics
Don't forget to like, comment, and subscribe for more AI content!
#impactful graphs a breeze. See how easy it is!"#datavisualization#graphs#dataanalysis#graphyapp#productivity#businesstools#analytics#Don't forget to like#comment#and subscribe for more AI content!#“data visualization”#“graph maker”#“create graphs”#“data analysis tools”#“chart maker”#“easy data visualization”#“online graph maker”#“ai graph generator”#“data visualization software”#“business graph maker”#“data reporting tools”#“interactive graph maker”#“data dashboard tools”#“graph creation online”#“data presentation tools”#“google sheets graph integration”#“notion graph integration”#“business intelligence tools”#“analytics software”
0 notes
Text


#Best Clinical SAS Training Institute in Hyderabad#Unicode Healthcare Services stands out as the top Clinical SAS training institute in Ameerpet#Hyderabad. Our comprehensive program is tailored to provide a deep understanding of Clinical SAS and its various features. The curriculum i#analytics#reporting#and graphical presentations#catering to both beginners and advanced learners.#Why Choose Unicode Healthcare Services for Clinical SAS Training?#Our team of expert instructors#with over 7 years of experience in the Pharmaceutical and Healthcare industries#ensures that students gain practical knowledge along with theoretical concepts. Using real-world examples and hands-on projects#we prepare our learners to effectively use Clinical SAS in various professional scenarios.#About Clinical SAS Training#Clinical SAS is a powerful statistical analysis system widely used in the Pharmaceutical and Healthcare industries to analyze and manage cl#and reporting.#The program includes both classroom lectures and live project work#ensuring students gain practical exposure. By completing the training#participants will be proficient in data handling#creating reports#and graphical presentations.#Course Curriculum Highlights#Our Clinical SAS course begins with the fundamentals of SAS programming#including:#Data types#variables#and expressions#Data manipulation using SAS procedures#Techniques for creating graphs and reports#Automation using SAS macros#The course also delves into advanced topics like CDISC standards
1 note
·
View note
Text
Jatan Shah Skill Nation | Microsoft Certified Excel Expert.
Hi, I am Jatan Shah, a Microsoft Certified Trainer & a Microsoft Certified Excel Expert. I help working professionals master analytical skills with ease & consult for top corporate brands to make them more Data Analysis & Presentation Efficient.
#Excel Expert#Microsoft Certified#Data Analysis#Presentation Efficient#jatan shah#jatan shah reviews#jatan shah skill nation reviews#jatan shah skill nation#skill nation student reviews#skill nation reviews
0 notes
Text
in lue of getting paid money for services rendered to Vees. What if Baxter was paid in bodies sometimes? Those low earners Val, Vox and Velvette didn't see need to keep around? Baxter is always in need of fresh subjects for his experiments to test out new implants, his creations and the like on.
#data analysis;; headcanons#he can be very morally flexible if presented with room to further his work.
0 notes
Text
I was thinking of starting a tournament where I pit the old lesson plans I've written here against each other to see which one is the most popular/beloved.
If this starts getting positive feedback, I'll begin planning three logistics.
#poll#It's a good way to keep posting without having to write anything new#and most of you aren't going way back in my history to see the old stuff anyway#plus tournaments are fun#and if I can figure out how to capture the data from these posts then i can present the results for my data analysis portfolio
1 note
·
View note
Text
still heartbroken no one in my course uses R for data analysis
#like we had to make a presentation about our data analysis#and none of them used r#only. me.#r is and will always be my beloved#simply because i am not familiar with other programs lol#i could switch to python. but. hmmmm#i dont think that would be better. it just would be different
1 note
·
View note