#python with datascience
Explore tagged Tumblr posts
Visit Tumblr Blog
Explore Tumblr blogs with no restrictions, modern design and the best experience.
Last Seen Tumblr Blogs


Fun Fact
Tumblr has a 66 index score for customer satisfaction in the US.
Text
Upgrade Your Skills. Anytime. Anywhere. Join Our Online & Offline Tech Courses and Step Into the Future of Innovation!
#python course in trichy#python course in chathiram bus stand#data analysis#python with datascience#software testing#education#best python course in trichy#student#technology#trichy
0 notes
Text

Hey everyone! enjoying my (two) week break of uni, so I've been lazy and playing games. Today, working on Python, I'm just doing repetition of learning the basics; Variables, Data types, Logic statements, etc. Hope everyone has a good week!
#codeblr#coding#python#university#uni life#studying#datascience#data analytics#data analysis#studyblr#student life#study motivation#study blog#student
78 notes
·
View notes
Text
Cardinal-O-Mat Data Science
Soooo I wanted to learn something data sciency. And I stumbled over David Kriesel's Wahl-O-Mat analyses and wanted to do the same but different. I, like you maybe, have stumbled over the cardinal-o-mat. Logical conclusion: Let's do data science without mama (I'm so sorry!) but with the cardinal-o-mat! (Of course, I also have done this with the Wahl-O-Mat.)
The Cluster Heatmap
Here we have a cluster heatmap. (Isn't she pretty? Actually not so much, there's a lot of grey there...)

On the right side, you can see the names of the cardinals, and on the bottom, you can see the names of the theses. (I was too lazy to make them look pretty.) Red means disagree, blue means agree (for colorblindness reasons). Grey means either that the cardinal was explicitly neutral to the question or that there was simply no data on his position regarding the thesis in the cardinal-o-mat.
The theses are as follows (in order of appearance in the cardinal-o-mat):
I'll spare you and not list all the cardinals' names.
female_deacons: Women should be admitted to the diaconate.
same_sex: Same-sex couples should continue to be allowed to receive blessings outside of liturgical celebrations.
celibacy: Priestly celibacy should become voluntary.
vetus_ordo: The celebration of the Old Latin Mass should remain restricted for the sake of church unity.
vatican_china: The secret agreement between the Vatican and the People's Republic of China on the appointment of bishops should be upheld.
synodal_church: The Catholic Church should be a synodal church in which more emphasis is placed on participation, inclusion and joint decision-making.
climate_change: The Catholic Church should get involved in climate protection because it is committed to God's creation and the protection of the most vulnerable.
humanae_vitae: The Catholic Church should reconsider its position on contraception.
communion_unmarried: Divorced and remarried persons should be admitted to communion in individual cases.
german_synode: The German Synodal Way, aiming at reforming the doctrine of faith and morals, should be regarded positively overall.
covid: Church closures and vaccination recommendations during the Covid-19 pandemic were right.
islam: Interfaith dialogue with Islam is important.
What do we see here?
Roughly speaking, the closer two cardinals or two theses are shown in the map, the more similar they are, and the further apart in the map, the more dissimilar. Because of this closeness of similar cardinals/theses, we get these blocks of blue and red (kinda. I mean, it could be much worse.).
I want to emphasize that I did not sort this by hand. Rather it was sorted by an algorithm with respect to a certain metric (here the Jaccard metric), which measures the "distance" between the cardinals and theses. The method used is (divisive) hierarchical clustering. At each step, a cluster is divided into two subsets such that their distance is maximized. You can see these steps in the lines on the top and left side. This is called a dendrogram.
What do we learn from this?
Damn good question! The amount of things to learn is somewhat limited, if we look at the amount of neutrals and non-opinions, also considering I did not seperate those two.
Since this is a non-serious setting, I think we can reasonably infer that a cardinal that has spoken in favor of a couple of the theses is also generally more open to those he has not voiced an opinion on, and similarly for the conservative ones. If you look at it like this, then it becomes quite clear that the blue, so the generally more open minded cardinals are in the majority. I would have loved to have a cardinal-o-mat for the previous conclave, because I have the hypothesis that there, the conservative cardinals might have had the majority and I would love to test this.
Something I find funny is that one of the theses that is most liked is the synodal_church one, which is about participation and joint decision making. One of the least liked ones is the german_synode one (only one agreement, thx Marx my homie), which tries to do exactly the participation and joint decision making.
I don't know what else we learn from this, I just think that a cluster heatmap is a neat way of visualising the positions of the cardinals wrt to the theses and since it is somewhat sorted, we learn something about their relation with each other.
If you can explain to me why there is this red block in the left bottom corner, please do! I thought it might have something to do with the metric I used but the map always looks similar or worse.
Also, maybe someone can explain to me which metric to use when.
#cardinal-o-mat#cardinalomat#kardinalomat#kardinal-o-mat#conclave#konklave#does this qualify as fanart? probably not. but as i was inspired by conclave (2024) maybe it qualifies as#fan work#data science#datascience#data analysis#conclave 2024#conclave (2024)#conclave 2025#conclave (2025)#python#programming
10 notes
·
View notes
Text
Why Learning Python is the Perfect First Step in Coding
Learning Python is an ideal way to dive into programming. Its simplicity and versatility make it the perfect language for beginners, whether you're looking to develop basic skills or eventually dive into fields like data analysis, web development, or machine learning.
Start by focusing on the fundamentals: learn about variables, data types, conditionals, and loops. These core concepts are the building blocks of programming, and Python’s clear syntax makes them easier to grasp. Interactive platforms like Codecademy, Khan Academy, and freeCodeCamp offer structured, step-by-step lessons that are perfect for beginners, so start there.
Once you’ve got a handle on the basics, apply what you’ve learned by building small projects. For example, try coding a simple calculator, a basic guessing game, or even a text-based story generator. These small projects will help you understand how programming concepts work together, giving you confidence and helping you identify areas where you might need a bit more practice.
When you're ready to move beyond the basics, Python offers many powerful libraries that open up new possibilities. Dive into pandas for data analysis, matplotlib for data visualization, or even Django if you want to explore web development. Each library offers a set of tools that helps you do more complex tasks, and learning them will expand your coding skillset significantly.
Keep practicing, and don't hesitate to look at code written by others to see how they approach problems. Coding is a journey, and with every line you write, you’re gaining valuable skills that will pay off in future projects.
FREE Python and R Programming Course on Data Science, Machine Learning, Data Analysis, and Data Visualization

#learntocode#python for beginners#codingjourney#programmingbasics#web development#datascience#machinelearning#pythonprojects#codingcommunity#python#free course
10 notes
·
View notes
Text
🧠 Just started learning Python?
Here are 3 beginner-friendly Python libraries that will level up your coding game fast! 👇
📦 NumPy → Handle arrays & matrices with ease → Fast numerical computing → Foundation for data science & machine learning
📊 Pandas → Clean and manipulate tabular data → Perfect for spreadsheets, CSVs, and DataFrames → Used in every real-world data science workflow
📈 Matplotlib → Create stunning graphs, charts & histograms → Turn raw data into visual stories → Great for presentations, reports, and dashboards
📍 From TCCI – Tririd Computer Coaching Institute, Bopal Ahmedabad 💡 Learn Python, master data, and build your future in tech!
#Python#PythonLibraries#LearnPython#NumPy#Pandas#Matplotlib#Programming#DataScience#CodingForBeginners#EdTech#TCCI#ComputerClasses#StudyTips#ShortTermCourses#BopalAhmedabad
2 notes
·
View notes
Text

Robotic Process Automation (RPA) enhances business efficiency by automating repetitive tasks, freeing up employees for more strategic work. It improves accuracy, reduces operational costs, and boosts productivity across industries.
#artificialintelligence#ai#machinelearning#aiart#digitalart#technology#art#aiartcommunity#midjourney#datascience#generativeart#innovation#tech#deeplearning#python#midjourneyart#aiartwork#aiartist#programming#robotics#bigdata#artoftheday#coding#aiartists#digitalartist#business#iot#midjourneyai#artwork#stablediffusion
3 notes
·
View notes
Text
Understanding Outliers in Machine Learning and Data Science

In machine learning and data science, an outlier is like a misfit in a dataset. It's a data point that stands out significantly from the rest of the data. Sometimes, these outliers are errors, while other times, they reveal something truly interesting about the data. Either way, handling outliers is a crucial step in the data preprocessing stage. If left unchecked, they can skew your analysis and even mess up your machine learning models.
In this article, we will dive into:
1. What outliers are and why they matter.
2. How to detect and remove outliers using the Interquartile Range (IQR) method.
3. Using the Z-score method for outlier detection and removal.
4. How the Percentile Method and Winsorization techniques can help handle outliers.
This guide will explain each method in simple terms with Python code examples so that even beginners can follow along.
1. What Are Outliers?
An outlier is a data point that lies far outside the range of most other values in your dataset. For example, in a list of incomes, most people might earn between $30,000 and $70,000, but someone earning $5,000,000 would be an outlier.
Why Are Outliers Important?
Outliers can be problematic or insightful:
Problematic Outliers: Errors in data entry, sensor faults, or sampling issues.
Insightful Outliers: They might indicate fraud, unusual trends, or new patterns.
Types of Outliers
1. Univariate Outliers: These are extreme values in a single variable.
Example: A temperature of 300°F in a dataset about room temperatures.
2. Multivariate Outliers: These involve unusual combinations of values in multiple variables.
Example: A person with an unusually high income but a very low age.
3. Contextual Outliers: These depend on the context.
Example: A high temperature in winter might be an outlier, but not in summer.
2. Outlier Detection and Removal Using the IQR Method
The Interquartile Range (IQR) method is one of the simplest ways to detect outliers. It works by identifying the middle 50% of your data and marking anything that falls far outside this range as an outlier.
Steps:
1. Calculate the 25th percentile (Q1) and 75th percentile (Q3) of your data.
2. Compute the IQR:
{IQR} = Q3 - Q1
Q1 - 1.5 \times \text{IQR}
Q3 + 1.5 \times \text{IQR} ] 4. Anything below the lower bound or above the upper bound is an outlier.
Python Example:
import pandas as pd
# Sample dataset
data = {'Values': [12, 14, 18, 22, 25, 28, 32, 95, 100]}
df = pd.DataFrame(data)
# Calculate Q1, Q3, and IQR
Q1 = df['Values'].quantile(0.25)
Q3 = df['Values'].quantile(0.75)
IQR = Q3 - Q1
# Define the bounds
lower_bound = Q1 - 1.5 * IQR
upper_bound = Q3 + 1.5 * IQR
# Identify and remove outliers
outliers = df[(df['Values'] < lower_bound) | (df['Values'] > upper_bound)]
print("Outliers:\n", outliers)
filtered_data = df[(df['Values'] >= lower_bound) & (df['Values'] <= upper_bound)]
print("Filtered Data:\n", filtered_data)
Key Points:
The IQR method is great for univariate datasets.
It works well when the data isn’t skewed or heavily distributed.
3. Outlier Detection and Removal Using the Z-Score Method
The Z-score method measures how far a data point is from the mean, in terms of standard deviations. If a Z-score is greater than a certain threshold (commonly 3 or -3), it is considered an outlier.
Formula:
Z = \frac{(X - \mu)}{\sigma}
is the data point,
is the mean of the dataset,
is the standard deviation.
Python Example:
import numpy as np
# Sample dataset
data = {'Values': [12, 14, 18, 22, 25, 28, 32, 95, 100]}
df = pd.DataFrame(data)
# Calculate mean and standard deviation
mean = df['Values'].mean()
std_dev = df['Values'].std()
# Compute Z-scores
df['Z-Score'] = (df['Values'] - mean) / std_dev
# Identify and remove outliers
threshold = 3
outliers = df[(df['Z-Score'] > threshold) | (df['Z-Score'] < -threshold)]
print("Outliers:\n", outliers)
filtered_data = df[(df['Z-Score'] <= threshold) & (df['Z-Score'] >= -threshold)]
print("Filtered Data:\n", filtered_data)
Key Points:
The Z-score method assumes the data follows a normal distribution.
It may not work well with skewed datasets.
4. Outlier Detection Using the Percentile Method and Winsorization
Percentile Method:
In the percentile method, we define a lower percentile (e.g., 1st percentile) and an upper percentile (e.g., 99th percentile). Any value outside this range is treated as an outlier.
Winsorization:
Winsorization is a technique where outliers are not removed but replaced with the nearest acceptable value.
Python Example:
from scipy.stats.mstats import winsorize
import numpy as np
Sample data
data = [12, 14, 18, 22, 25, 28, 32, 95, 100]
Calculate percentiles
lower_percentile = np.percentile(data, 1)
upper_percentile = np.percentile(data, 99)
Identify outliers
outliers = [x for x in data if x < lower_percentile or x > upper_percentile]
print("Outliers:", outliers)
# Apply Winsorization
winsorized_data = winsorize(data, limits=[0.01, 0.01])
print("Winsorized Data:", list(winsorized_data))
Key Points:
Percentile and Winsorization methods are useful for skewed data.
Winsorization is preferred when data integrity must be preserved.
Final Thoughts
Outliers can be tricky, but understanding how to detect and handle them is a key skill in machine learning and data science. Whether you use the IQR method, Z-score, or Wins
orization, always tailor your approach to the specific dataset you’re working with.
By mastering these techniques, you’ll be able to clean your data effectively and improve the accuracy of your models.
#science#skills#programming#bigdata#books#machinelearning#artificial intelligence#python#machine learning#data centers#outliers#big data#data analysis#data analytics#data scientist#database#datascience#data
4 notes
·
View notes
Text
I made a dorky meme

Uh. Enjoy tumblr
(For the code-challenged: this is like learning how to read via the dictionary)
#coding?#python#sql#javascript#html css#coding#computer#datascience#whatever else will get this seen by just the people that should see it and laugh
19 notes
·
View notes
Text
Predicting Alzheimer's With Machine Learning
Alzheimer's disease is a progressive neurodegenerative disorder that affects millions of people worldwide. Early diagnosis is crucial for managing the disease and potentially slowing its progression. My interest in this area is deeply personal. My great grandmother, Bonnie, passed away from Alzheimer's in 2000, and my grandmother, Jonette, who is Bonnie's daughter, is currently exhibiting symptoms of the disease. This personal connection has motivated me to apply my skills as a data scientist to contribute to the ongoing research in Alzheimer's disease.
Model Creation
The first step in creating the model was to identify relevant features that could potentially influence the onset of Alzheimer's disease. After careful consideration, I chose the following features: Mini-Mental State Examination (MMSE), Clinical Dementia Rating (CDR), Socioeconomic Status (SES), and Normalized Whole Brain Volume (nWBV).
MMSE: This is a commonly used test for cognitive function and mental status. Lower scores on the MMSE can indicate severe cognitive impairment, a common symptom of Alzheimer's.
CDR: This is a numeric scale used to quantify the severity of symptoms of dementia. A higher CDR score can indicate more severe dementia.
SES: Socioeconomic status has been found to influence health outcomes, including cognitive function and dementia.
nWBV: This represents the volume of the brain, adjusted for head size. A decrease in nWBV can be indicative of brain atrophy, a common symptom of Alzheimer's.
After selecting these features, I used a combination of Logistic Regression and Random Forest Classifier models in a Stacking Classifier to predict the onset of Alzheimer's disease. The model was trained on a dataset with these selected features and then tested on a separate dataset to evaluate its performance.
Model Performance
To validate the model's performance, I used a ROC curve plot (below), as well as a cross-validation accuracy scoring mechanism.
The ROC curve (Receiver Operating Characteristic curve) is a plot that illustrates the diagnostic ability of a model as its discrimination threshold is varied. It is great for visualizing the accuracy of binary classification models. The curve is created by plotting the true positive rate (TPR) against the false positive rate (FPR) at various threshold settings.
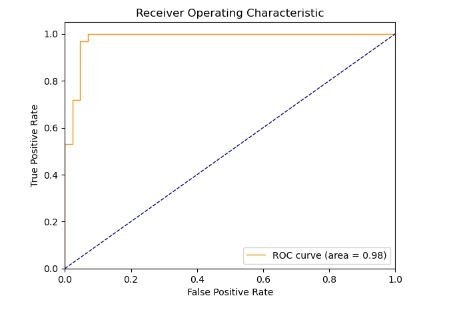
The area under the ROC curve, often referred to as the AUC (Area Under the Curve), provides a measure of the model's ability to distinguish between positive and negative classes. The AUC can be interpreted as the probability that the model will rank a randomly chosen positive instance higher than a randomly chosen negative one.
The AUC value ranges from 0 to 1. An AUC of 0.5 suggests no discrimination (i.e., the model has no ability to distinguish between positive and negative classes), 1 represents perfect discrimination (i.e., the model has perfect ability to distinguish between positive and negative classes), and 0 represents total misclassification.
The model's score of an AUC of 0.98 is excellent. It suggests that the model has a very high ability to distinguish between positive and negative classes.
The model also performed extremely well in another test, which showed the model has a final cross-validation score of 0.953. This high score indicates that the model was able to accurately predict the onset of Alzheimer's disease based on the selected features.
However, it's important to note that while this model can be a useful tool for predicting Alzheimer's disease, it should not be the sole basis for a diagnosis. Doctors should consider all aspects of diagnostic information when making a diagnosis.
Conclusion
The development and application of machine learning models like this one are revolutionizing the medical field. They offer the potential for early diagnosis of neurodegenerative diseases like Alzheimer's, which can significantly improve patient outcomes. However, these models are tools to assist healthcare professionals, not replace them. The human element in medicine, including a comprehensive understanding of the patient's health history and symptoms, remains crucial.
Despite the challenges, the potential of machine learning models in improving early diagnosis leaves me and my family hopeful. As we continue to advance in technology and research, we move closer to a world where diseases like Alzheimer's can be effectively managed, and hopefully, one day, cured.
#alzheimersresearch#alzheimersdisease#dementia#neurology#machinelearning#ai#artificialintelligence#aicommunity#datascience#datascientist#healthcare#medicalresearch#programming#python programming#python#python 3
60 notes
·
View notes
Text
https://www.excellencetechnology.in/chandigarh-center/
#animation#programming#web development#web design#artificial intelligence#machinelearning#data analytics#datascience#python#javaprogramming#java course#digital marketing#seo
2 notes
·
View notes
Text

🎉 JALS Education Presents: 30% OFF on All Tech Courses – Enroll Now!
#data analysis#python course in chathiram bus stand#best python course in trichy#python course in trichy#software testing#python with datascience#education#student#technology#trichy
0 notes
Text
Python for Data Science: From Beginner to Expert – A Complete Guide!
Python has become the go-to language for data science, thanks to its flexibility, powerful libraries, and strong community support. In this video, we’ll explore why Python is the best choice for data scientists and how you can master it—from setting up your environment to advanced machine learning techniques.
🔹 What You'll Learn:
✅ Why Python is essential for data science
✅ Setting up Python and key libraries (NumPy, Pandas, Matplotlib) ✅ Data wrangling, visualization, and transformation
✅ Building machine learning models with Scikit-learn
✅ Best practices to enhance your data science workflow 🚀 Whether you're a beginner or looking to refine your skills, this guide will help you level up in data science with Python. 📌 Don’t forget to like, subscribe, and hit the notification bell for more data science and Python content!
youtube
#python#datascience#machinelearning#ai#bigdata#deeplearning#technology#programming#coding#developer#pythonprogramming#pandas#numpy#matplotlib#datavisualization#ml#analytics#automation#artificialintelligence#datascientist#dataanalytics#Youtube
3 notes
·
View notes
Text
What's the difference between Machine Learning and AI?
Machine Learning and Artificial Intelligence (AI) are often used interchangeably, but they represent distinct concepts within the broader field of data science. Machine Learning refers to algorithms that enable systems to learn from data and make predictions or decisions based on that learning. It's a subset of AI, focusing on statistical techniques and models that allow computers to perform specific tasks without explicit programming.

On the other hand, AI encompasses a broader scope, aiming to simulate human intelligence in machines. It includes Machine Learning as well as other disciplines like natural language processing, computer vision, and robotics, all working towards creating intelligent systems capable of reasoning, problem-solving, and understanding context.
Understanding this distinction is crucial for anyone interested in leveraging data-driven technologies effectively. Whether you're exploring career opportunities, enhancing business strategies, or simply curious about the future of technology, diving deeper into these concepts can provide invaluable insights.
In conclusion, while Machine Learning focuses on algorithms that learn from data to make decisions, Artificial Intelligence encompasses a broader range of technologies aiming to replicate human intelligence. Understanding these distinctions is key to navigating the evolving landscape of data science and technology. For those eager to deepen their knowledge and stay ahead in this dynamic field, exploring further resources and insights on can provide valuable perspectives and opportunities for growth
5 notes
·
View notes
Text
The Growing Importance of Data Science in the Digital Age Data science has emerged as a transformative field, fueling industries across the globe with actionable insights. In today’s data-driven world, organizations are leveraging data to make informed decisions, predict trends, and uncover hidden patterns.
2 notes
·
View notes
Text

We can reduce manual data entry and automate invoices by integrating OCR and AI-powered tools with your accounting system. Platforms like Odoo or QuickBooks streamline invoice generation, approval, and payment tracking with minimal human intervention.
#artificialintelligence#ai#machinelearning#aiart#digitalart#technology#art#aiartcommunity#midjourney#datascience#generativeart#innovation#tech#deeplearning#python#midjourneyart#aiartwork#aiartist#programming#robotics#bigdata#artoftheday#coding#aiartists#digitalartist#business#iot#midjourneyai#artwork#stablediffusion
2 notes
·
View notes