#r programming
Explore tagged Tumblr posts
Visit Tumblr Blog
Explore Tumblr blogs with no restrictions, modern design and the best experience.
Last Seen Tumblr Blogs


Fun Fact
There are dozens of funny blogs to kill time on Tumblr.
Text
Me: *forgets a double quote*
R Studio:

40 notes
·
View notes
Text

Τεμπελιάζοντας. (Not really)
#greek tumblr#greek posts#ελληνικά#ελληνικο ποστ#greek#greek post#ελληνικο tumblr#ελληνικα#ελληνικο ταμπλρ#programming#r programming#data analytics#Spotify
18 notes
·
View notes
Text
Tumblr? I barely know r!!
But I do know enough to print a cool pie chart :3
2 notes
·
View notes
Text
Something you should know about me is that I can go rather far to commit to a bit.
I saw this video recently and was inspired for my capstone project (Statistics Major)
By recently I mean last night at 8pm (20:00) with my presentation of this project at 9:30 am today. However I decided it was too great to pass up so hear I am.
My presentation was on bootstrap stats which is used to increase sample size when otherwise unable to. This is supposed to give more accurate sample statistics.
First things first: Acquiring the Spaghettios A-Z
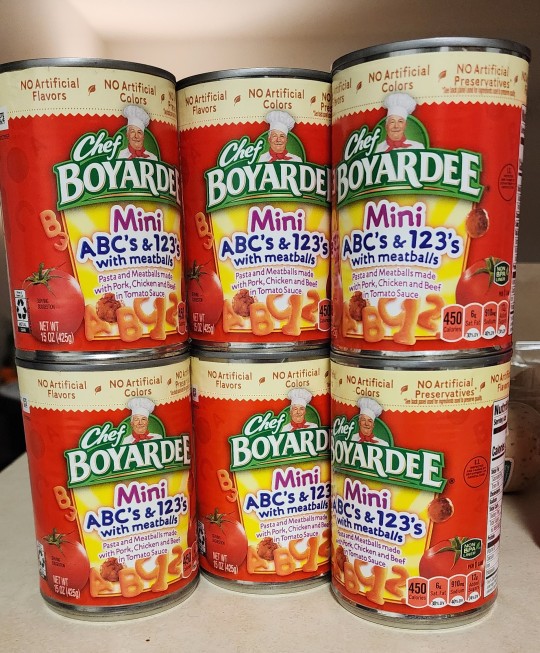
Unfortunately the ones he bought in the video were not in stock so I got these. As you can see these also have numbers. So I had to sort them both alphabetically and remove the meatballs and numbers. This process took about 2 hours with 2 people (me doing 4 cans my partner doing 2)
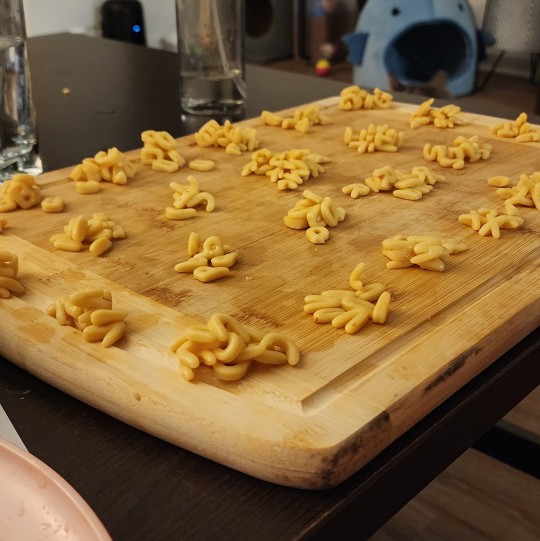
This is what my spreadsheet looked like at the end

I then went online and got the full movie script for Shrek that lacked image descriptions and who said what (aka just the dialog).
Using R studio I found the amount of each letter in the Shrek script.
A 2061, B 431, C 459, D 925, E 3208, F 504, G 691, H 1663, I 1844, J 62, K 535, L 1225, M 717, N 1771, O 2678, P 358, Q 37, R 1511, 2 1600, T 2552, U 1142, V 242, W 779, X 20, Y 1046, Z 9.
I then found the averages for each letter in my 6 cans combined (rounded up). From this I divided the Shrek script by the cans to find how many cans it would take per letter. Then I found the letter with the highest amount of cans needed and thus had my answer (268).
Now I did the bootstrapping. This is basically taking random numbers from my dataset (with replacement) and assigning them to random letters in a new row. I did this and created 3 new datasets. One with 120 entries per letter, one with 1,200, and the last one with 12,000. I then repeated the process that I did with the first can to find the amount of cans needed (256, 268, and 256 respectively).
So from this I can conclude that it would take 256-268 cans to recreate the Shrek script.
#statistics#r#r studio#r programming#spaghettios#bit#silly idea#capstone#bootstrap statistics#Not kidding I finished this 10 minutes before I had to present#I slept a bit last night too#I had nightmares of my data both becoming people and sacks of rice#blame the rice part on my partners mom#then when my alarms went off#I turned off the first the panicking about my sentient data#so yeah#weird#college#student
16 notes
·
View notes
Text
Introduction to R Programming and Consumers Wants in Marketing Analytics
This free online fundamentals of Perl programming course will introduce you to the features of Perl and the basics of programming with it.
Practical Extraction and Report Language (or Perl) is a programming language used for different tasks like extracting information from a text file, printing out a report, or converting a text file into another format.
It is an interpreted language where codes can be run without compilation.
#free course#online courses#online course creation#course#education#online#educate yourself#knowledge#workout#health and wellness#programming#computer science#computer#r programming
1 note
·
View note
Text
I may be horrendous at stats but at least I have the power to make all my graphs bisexual themed so my lecturer is forced to read my garbage while also being involuntarily subscribed to the queer agenda. not sorry :) in fact feeling very devilish about it :)
24 notes
·
View notes
Text
Exploring Data Science Tools: My Adventures with Python, R, and More
Welcome to my data science journey! In this blog post, I'm excited to take you on a captivating adventure through the world of data science tools. We'll explore the significance of choosing the right tools and how they've shaped my path in this thrilling field.
Choosing the right tools in data science is akin to a chef selecting the finest ingredients for a culinary masterpiece. Each tool has its unique flavor and purpose, and understanding their nuances is key to becoming a proficient data scientist.
I. The Quest for the Right Tool
My journey began with confusion and curiosity. The world of data science tools was vast and intimidating. I questioned which programming language would be my trusted companion on this expedition. The importance of selecting the right tool soon became evident.
I embarked on a research quest, delving deep into the features and capabilities of various tools. Python and R emerged as the frontrunners, each with its strengths and applications. These two contenders became the focus of my data science adventures.
II. Python: The Swiss Army Knife of Data Science
Python, often hailed as the Swiss Army Knife of data science, stood out for its versatility and widespread popularity. Its extensive library ecosystem, including NumPy for numerical computing, pandas for data manipulation, and Matplotlib for data visualization, made it a compelling choice.
My first experiences with Python were both thrilling and challenging. I dove into coding, faced syntax errors, and wrestled with data structures. But with each obstacle, I discovered new capabilities and expanded my skill set.
III. R: The Statistical Powerhouse
In the world of statistics, R shines as a powerhouse. Its statistical packages like dplyr for data manipulation and ggplot2 for data visualization are renowned for their efficacy. As I ventured into R, I found myself immersed in a world of statistical analysis and data exploration.
My journey with R included memorable encounters with data sets, where I unearthed hidden insights and crafted beautiful visualizations. The statistical prowess of R truly left an indelible mark on my data science adventure.
IV. Beyond Python and R: Exploring Specialized Tools
While Python and R were my primary companions, I couldn't resist exploring specialized tools and programming languages that catered to specific niches in data science. These tools offered unique features and advantages that added depth to my skill set.

For instance, tools like SQL allowed me to delve into database management and querying, while Scala opened doors to big data analytics. Each tool found its place in my toolkit, serving as a valuable asset in different scenarios.
V. The Learning Curve: Challenges and Rewards
The path I took wasn't without its share of difficulties. Learning Python, R, and specialized tools presented a steep learning curve. Debugging code, grasping complex algorithms, and troubleshooting errors were all part of the process.
However, these challenges brought about incredible rewards. With persistence and dedication, I overcame obstacles, gained a profound understanding of data science, and felt a growing sense of achievement and empowerment.
VI. Leveraging Python and R Together
One of the most exciting revelations in my journey was discovering the synergy between Python and R. These two languages, once considered competitors, complemented each other beautifully.

I began integrating Python and R seamlessly into my data science workflow. Python's data manipulation capabilities combined with R's statistical prowess proved to be a winning combination. Together, they enabled me to tackle diverse data science tasks effectively.
VII. Tips for Beginners
For fellow data science enthusiasts beginning their own journeys, I offer some valuable tips:
Embrace curiosity and stay open to learning.
Work on practical projects while engaging in frequent coding practice.
Explore data science courses and resources to enhance your skills.
Seek guidance from mentors and engage with the data science community.
Remember that the journey is continuous—there's always more to learn and discover.
My adventures with Python, R, and various data science tools have been transformative. I've learned that choosing the right tool for the job is crucial, but versatility and adaptability are equally important traits for a data scientist.
As I summarize my expedition, I emphasize the significance of selecting tools that align with your project requirements and objectives. Each tool has a unique role to play, and mastering them unlocks endless possibilities in the world of data science.
I encourage you to embark on your own tool exploration journey in data science. Embrace the challenges, relish the rewards, and remember that the adventure is ongoing. May your path in data science be as exhilarating and fulfilling as mine has been.
Happy data exploring!
23 notes
·
View notes
Note
Hi Izi! I was wondering if you had any advice/resources for learning R quickly? (It’s something my potential grad school advisor really wants me to know, so I’m in a bit of a pinch!) I’m sorry if you’ve been asked this before—thanks so much for your time and help! Your blog is so wonderful! 💗
Hiya!
And thank you!! I don't have any experience with learning R so I don't have any specific advice for R but I do have a list of resources I made for someone in the past since they requested, you can check it out here >> link to the resource 🖤
Best of luck with your studies! 😖🙌🏾✨
#my asks#resources#r programming#r programmer#programming#coding#studyblr#codeblr#progblr#studying#comp sci#programmer#student#study life#coding resources#coding study
9 notes
·
View notes
Text
Learning About Different Types of Functions in R Programming
Summary: Learn about the different types of functions in R programming, including built-in, user-defined, anonymous, recursive, S3, S4 methods, and higher-order functions. Understand their roles and best practices for efficient coding.
Introduction
Functions in R programming are fundamental building blocks that streamline code and enhance efficiency. They allow you to encapsulate code into reusable chunks, making your scripts more organised and manageable.
Understanding the various types of functions in R programming is crucial for leveraging their full potential, whether you're using built-in, user-defined, or advanced methods like recursive or higher-order functions.
This article aims to provide a comprehensive overview of these different types, their uses, and best practices for implementing them effectively. By the end, you'll have a solid grasp of how to utilise these functions to optimise your R programming projects.
What is a Function in R?
In R programming, a function is a reusable block of code designed to perform a specific task. Functions help organise and modularise code, making it more efficient and easier to manage.
By encapsulating a sequence of operations into a function, you can avoid redundancy, improve readability, and facilitate code maintenance. Functions take inputs, process them, and return outputs, allowing for complex operations to be performed with a simple call.
Basic Structure of a Function in R
The basic structure of a function in R includes several key components:
Function Name: A unique identifier for the function.
Parameters: Variables listed in the function definition that act as placeholders for the values (arguments) the function will receive.
Body: The block of code that executes when the function is called. It contains the operations and logic to process the inputs.
Return Statement: Specifies the output value of the function. If omitted, R returns the result of the last evaluated expression by default.
Here's the general syntax for defining a function in R:

Syntax and Example of a Simple Function
Consider a simple function that calculates the square of a number. This function takes one argument, processes it, and returns the squared value.

In this example:
square_number is the function name.
x is the parameter, representing the input value.
The body of the function calculates x^2 and stores it in the variable result.
The return(result) statement provides the output of the function.
You can call this function with an argument, like so:

This function is a simple yet effective example of how you can leverage functions in R to perform specific tasks efficiently.
Must Read: R Programming vs. Python: A Comparison for Data Science.
Types of Functions in R
In R programming, functions are essential building blocks that allow users to perform operations efficiently and effectively. Understanding the various types of functions available in R helps in leveraging the full power of the language.
This section explores different types of functions in R, including built-in functions, user-defined functions, anonymous functions, recursive functions, S3 and S4 methods, and higher-order functions.
Built-in Functions
R provides a rich set of built-in functions that cater to a wide range of tasks. These functions are pre-defined and come with R, eliminating the need for users to write code for common operations.
Examples include mathematical functions like mean(), median(), and sum(), which perform statistical calculations. For instance, mean(x) calculates the average of numeric values in vector x, while sum(x) returns the total sum of the elements in x.
These functions are highly optimised and offer a quick way to perform standard operations. Users can rely on built-in functions for tasks such as data manipulation, statistical analysis, and basic operations without having to reinvent the wheel. The extensive library of built-in functions streamlines coding and enhances productivity.
User-Defined Functions
User-defined functions are custom functions created by users to address specific needs that built-in functions may not cover. Creating user-defined functions allows for flexibility and reusability in code. To define a function, use the function() keyword. The syntax for creating a user-defined function is as follows:

In this example, my_function takes two arguments, arg1 and arg2, adds them, and returns the result. User-defined functions are particularly useful for encapsulating repetitive tasks or complex operations that require custom logic. They help in making code modular, easier to maintain, and more readable.
Anonymous Functions
Anonymous functions, also known as lambda functions, are functions without a name. They are often used for short, throwaway tasks where defining a full function might be unnecessary. In R, anonymous functions are created using the function() keyword without assigning them to a variable. Here is an example:

In this example, sapply() applies the anonymous function function(x) x^2 to each element in the vector 1:5. The result is a vector containing the squares of the numbers from 1 to 5.
Anonymous functions are useful for concise operations and can be utilised in functions like apply(), lapply(), and sapply() where temporary, one-off computations are needed.
Recursive Functions
Recursive functions are functions that call themselves in order to solve a problem. They are particularly useful for tasks that can be divided into smaller, similar sub-tasks. For example, calculating the factorial of a number can be accomplished using recursion. The following code demonstrates a recursive function for computing factorial:

Here, the factorial() function calls itself with n - 1 until it reaches the base case where n equals 1. Recursive functions can simplify complex problems but may also lead to performance issues if not implemented carefully. They require a clear base case to prevent infinite recursion and potential stack overflow errors.
S3 and S4 Methods
R supports object-oriented programming through the S3 and S4 systems, each offering different approaches to object-oriented design.
S3 Methods: S3 is a more informal and flexible system. Functions in S3 are used to define methods for different classes of objects. For instance:

In this example, print.my_class is a method that prints a custom message for objects of class my_class. S3 methods provide a simple way to extend functionality for different object types.
S4 Methods: S4 is a more formal and rigorous system with strict class definitions and method dispatch. It allows for detailed control over method behaviors. For example:

Here, setClass() defines a class with a numeric slot, and setMethod() defines a method for displaying objects of this class. S4 methods offer enhanced functionality and robustness, making them suitable for complex applications requiring precise object-oriented programming.
Higher-Order Functions
Higher-order functions are functions that take other functions as arguments or return functions as results. These functions enable functional programming techniques and can lead to concise and expressive code. Examples include apply(), lapply(), and sapply().
apply(): Used to apply a function to the rows or columns of a matrix.
lapply(): Applies a function to each element of a list and returns a list.
sapply(): Similar to lapply(), but returns a simplified result.
Higher-order functions enhance code readability and efficiency by abstracting repetitive tasks and leveraging functional programming paradigms.
Best Practices for Writing Functions in R
Writing efficient and readable functions in R is crucial for maintaining clean and effective code. By following best practices, you can ensure that your functions are not only functional but also easy to understand and maintain. Here are some key tips and common pitfalls to avoid.
Tips for Writing Efficient and Readable Functions
Keep Functions Focused: Design functions to perform a single task or operation. This makes your code more modular and easier to test. For example, instead of creating a function that processes data and generates a report, split it into separate functions for processing and reporting.
Use Descriptive Names: Choose function names that clearly indicate their purpose. For instance, use calculate_mean() rather than calc() to convey the function’s role more explicitly.
Avoid Hardcoding Values: Use parameters instead of hardcoded values within functions. This makes your functions more flexible and reusable. For example, instead of using a fixed threshold value within a function, pass it as a parameter.
Common Mistakes to Avoid
Overcomplicating Functions: Avoid writing overly complex functions. If a function becomes too long or convoluted, break it down into smaller, more manageable pieces. Complex functions can be harder to debug and understand.
Neglecting Error Handling: Failing to include error handling can lead to unexpected issues during function execution. Implement checks to handle invalid inputs or edge cases gracefully.
Ignoring Code Consistency: Consistency in coding style helps maintain readability. Follow a consistent format for indentation, naming conventions, and comment style.
Best Practices for Function Documentation
Document Function Purpose: Clearly describe what each function does, its parameters, and its return values. Use comments and documentation strings to provide context and usage examples.
Specify Parameter Types: Indicate the expected data types for each parameter. This helps users understand how to call the function correctly and prevents type-related errors.
Update Documentation Regularly: Keep function documentation up-to-date with any changes made to the function’s logic or parameters. Accurate documentation enhances the usability of your code.
By adhering to these practices, you’ll improve the quality and usability of your R functions, making your codebase more reliable and easier to maintain.
Read Blogs:
Pattern Programming in Python: A Beginner’s Guide.
Understanding the Functional Programming Paradigm.
Frequently Asked Questions
What are the main types of functions in R programming?
In R programming, the main types of functions include built-in functions, user-defined functions, anonymous functions, recursive functions, S3 methods, S4 methods, and higher-order functions. Each serves a specific purpose, from performing basic tasks to handling complex operations.
How do user-defined functions differ from built-in functions in R?
User-defined functions are custom functions created by users to address specific needs, whereas built-in functions come pre-defined with R and handle common tasks. User-defined functions offer flexibility, while built-in functions provide efficiency and convenience for standard operations.
What is a recursive function in R programming?
A recursive function in R calls itself to solve a problem by breaking it down into smaller, similar sub-tasks. It's useful for problems like calculating factorials but requires careful implementation to avoid infinite recursion and performance issues.
Conclusion
Understanding the types of functions in R programming is crucial for optimising your code. From built-in functions that simplify tasks to user-defined functions that offer customisation, each type plays a unique role.
Mastering recursive, anonymous, and higher-order functions further enhances your programming capabilities. Implementing best practices ensures efficient and maintainable code, leveraging R’s full potential for data analysis and complex problem-solving.
#Different Types of Functions in R Programming#Types of Functions in R Programming#r programming#data science
4 notes
·
View notes
Text
2 notes
·
View notes
Text
does anybody know how to annotate a boxplot with ggplot on r????
2 notes
·
View notes
Text
Just so you know if a function in your R package is deprecated and you just. remove the function entirely except to return a message saying it's defunct. and offer no alternative to it. i'm coming for you in your sleep, you have seven days.
2 notes
·
View notes
Text
10 Smart R Programming Tips to become Better R Programmer
Coding is the process by which a programmer converts tasks from human-readable logic to machine-readable language. The reason behind coding being so popular is that there are so many ways to do the same thing that programmers don’t know the right choice anymore.
As a result, each programmer has his/her own style in writing implementations to the same part of an algorithm.
Writing code can sometimes be the most difficult and time-consuming part of any project. If the code is written in such a way that it is hard to change or requires a lot of work for every small update, then the investments will keep on piling up and more and more issues will crop up as the project progresses.
A good and well-written code is reusable, efficient and written cleverly by a smart programmer. This is what differentiates programmers from each other.
So, here are some tips to becoming a SMART coder:
Table of contents:
Writing codes for Programmer, Developer, and Even for A Layman
Knowing how to improve the code
Writing robust code
When to use shortcuts and when not to use
Reduce effort through code reuse
Write planned out code
Active memory management
Remove redundant tasks
Learn to adapt
Peer review
1. Writing Codes for Programmer, Developer, and Even for A Layman
Though codes are primarily written for the machine to understand. They should be structured and well organized for other developers or for any layman to understand. In reality, codes should be written for all the three.
Those who keep this fact in mind are one step ahead of other coders while those who are able to make sure everyone can understand their code are miles ahead than their struggling friends.
Good programmers always document their codes and make use of IDE. I will use R language to explain the concept. Using IDE such as Rstudio makes it easier to write code quickly.
The main advantage available in almost all IDE is the auto-completion feature which suggests the function or command when part of it is written.
IDE is also known to suggest the syntax of the selected functions which saves time. Rstudio IDE environment also displays environment variables alongside with some basic details of each variable.
Documentation is another ability which differentiates good programmers from the rest.
Let’s look at this viewpoint using an example. Say you read the following code:
Code snippet 1
# Code snippet 1
a=16
b=a/2
c=(a+b)/2
Code snippet 2
# Code snippet 2
# store the max memory size
a=16
# taking half of the maximum memory as the minimum memory
b=a/2
# taking mean of maximum and minimum memory as the recommended memory
c=(a+b)/2
Code snippet 3
# Code snippet 3
# store the max memory size
max_mem=16
# taking half of the maximum memory as the minimum memory
min_mem=max_mem/2
# taking mean of maximum and minimum memory as the recommended memory
mean_mem=(max_mem+min_mem)/2
The difference in documentation is highlighted in these three code snippets and this is just a simple demonstration of code understandability.
The first code is difficult to understand. It just sets the values of three variables. There are no comments and the variable names do not explain anything.
The second code snippet explains that ‘a’ is the maximum memory, ‘b’ is the minimum memory and ‘c’ is the mean of the two.
Without the comments in code snippet 2, no one can understand whether the calculation for ‘c’ is correct or not.
The third code is a step further with the variables representing what is stored in them.
The third code is the easiest to understand even though all the three codes perform similar tasks. Moreover, when the variables are used elsewhere, the variables used in the third snippet are self-explanatory and will not require a programmer to search in the code for what they store until an error occurs in the code.
2. Knowing how to Improve
R has multiple ways to achieve a task. Each of the possibilities comes from using more memory, faster execution or different algorithm/logic.
Whenever possible, good programmers make this choice wisely.
R has the feature to execute code in parallel. Lengthy tasks such as fitting models can be executed in parallel, resulting in time-saving. Other tasks can also be executed faster based on the logic and packages used.
As an illustration, the following code snippets reflects the same task, one with sqldf package and another with dplyr package.
These practices are foundational not only for efficient programming, but also for building scalable AI and machine learning solutions.
Using sqldf version
# Using sqldf version
install.packages(“sqldf”)
library(sqldf)
Out_df=sqldf(“select * from table_a left outer join table_b on table_a.var_x=table_b.var_x”)
Using dplyr version
# Using dplyr version
install.packages(“dplyr”)
library(dplyr)
Out_df=left_join(table_a,table_b)
I personally prefer the dplyr version whenever possible. However, there are some differences between the outputs.
The dplyr version will look at all variables with the same name and join using them. If there is more than one such variable, I need to use them by field. Moreover, left join using dplyr will not keep both copies of the variable used to join tables whereas sqldf does.
One advantage of sqldf is that sqldf is not case sensitive and can easily join tables even if the variable names in the two tables are completely different. However, it is slower than dplyr.
3. Writing Robust Code
While writing code, you can make the code simple but situation specific or write a generic code. One such way in which programmers write simple but situation-specific code is by ‘Hard Coding’.
It is the term given to fixing values of variables and is never recommended.
For example, dividing the sum of all salaries in a 50,000-row salary data by 50,000 rather than dividing the sum of that sum with the number of rows may seem to make the same sense but have a different meaning in programming.
If the data changes with the change in the number of rows, the number 50,000 needs to be searched and updated. If the programmer misses making the small change, all the work goes down the drain. On the other hand, the latter approach automatically does the task and is a robust method.
Another popular programming issue quite specific to languages such as R is Code Portability. Codes running on one computer may not work on another because the other computer does not have some packages installed or has outdated packages.
Such cases can be handled by checking for installed packages first and then installing them. These tasks can be collectively called as robust programming and make the code error free.
Using an illustration for checking and installing/updating h2o package.
# If h2o package is already loaded, unload it and uninstall
if (“package:h2o” %in% search()) { detach(“package:h2o”, unload=TRUE) }
# Checking
if (“h2o” %in% rownames(installed.packages())) { remove.packages(“h2o”) }
# Next, we download packages that H2O depends on.
# methods
if (! (“methods” %in% rownames(installed.packages()))) { install.packages(“methods”) }
# statmod
if (! (“statmod” %in% rownames(installed.packages()))) { install.packages(“statmod”) }
# stats
if (! (“stats” %in% rownames(installed.packages()))) { install.packages(“stats”) }
# graphics
if (! (“graphics” %in% rownames(installed.packages()))) { install.packages(“graphics”) }
# Rcurl
if (! (“RCurl” %in% rownames(installed.packages()))) { install.packages(“RCurl”) }
# jsonlite
if (! (“jsonlite” %in% rownames(installed.packages()))) { install.packages(“jsonlite”) }
# tools
if (! (“tools” %in% rownames(installed.packages()))) { install.packages(“tools”) }
# utils
if (! (“utils” %in% rownames(installed.packages()))) { install.packages(“utils”) }
# Finally install and load h2o package
install.packages(“h20”)
library(h2o)
4. When to Use Shortcuts and When Not to
Using shortcuts may be tempting in the pursuit of writing code swiftly but the right practice is to know when to use them.
For instance, shortcut keys are something which is really helpful and can always be used. Using Ctrl+L in windows clears the console output screen, Using Ctrl+Shift+C in windows comments and un-comments all selected lines of code in one go are my favorite shortcuts in Rstudio.
Another shortcut is writing code for fixing code temporarily or writing faulty fixes which are not desired.
Here are some of the examples of faulty fixes.
This code changes a particular column name without checking its existing name
# This code changes a particular column name without checking its existing name
colnames(data_f)[5]=”new_name”
This removes certain columns using a number. This may remove important ones and code may give the error if the number of columns less than 10 in this case.
# This removes certain columns using a number. This may remove important ones and code may give error if the number of columns are less than 10 in this case
data_f=data_f[,1:4,6:10]
This converts a value to numeric without checking if it actually has all numbers. If the value does not contain numbers, it may produce NAs by coercion
# This converts a value to numeric without checking if it actually has all numbers. If the value does not contain numbers, it may produce NAs by coercion
Num_val=”123″
The following converts Num_val to 123 correctly
# The following converts Num_val to 123 correctly
Num_val=as.numeric(Num_val)
char_val=”A_Name”
The following issues a warning and converts Num_val to NA as it is not a number
# The following issues a warning and converts Num_val to NA as it is not a number
char_val=as.numeric(char_val)
5. Reduce Effort Through Code Reuse
When you start writing a code, you don’t need to waste time if a particular piece of logic has already been written for you. Better known as “Code Re-use”, you can always use your own code you previously wrote or even google to reach out the large R community.
Don’t be afraid to search. Looking up for already implemented solutions online is very helpful in learning the methods prevalent for similar situations and the pros and cons associated with them.
Even when it becomes necessary to reinvent the wheel, the existing solutions can serve as a benchmark to test your new solution. An equally important part of writing code is to make your own code reusable.
Here are two snippets which highlight reusability.
Code which needs to be edited before resuing it
# Code which needs to be edited before reusing it
for(i in 1:501) {
df[,i]=as.numeric(df[,i])
}
Code which can be reused with lesser editing
# Code which can be reused with lesser editing
for(i in 1:ncol(df)) {
df[,i]=as.numeric(df[,i])
}
6. Write Planned Out Code
Writing code on the fly may be a cool-to-have skill but not helpful for writing efficient codes. Coding is most efficient when you know what you are writing.
Always plan and write your logic on a piece of paper before implementing it. Inculcating the habit of adding tabs and spaces and basic formatting as you code is another time-saving skill for a good programmer.
For instance, every new ‘if’, ‘for’ or ‘while’ statement can be followed by tabs so that indentation is clearly visible. Although optional, such actions separate out blocks of code and helpful in identifying breakpoints as well as debugging.
A more rigorous but helpful approach is to write code using functions and modules and explaining every section with examples in comments or printing progress inside loops and conditions. Ultimately it all depends on the programmer how he/she chooses to document and log in the code.
7. Active Memory Management
Adding memory handling code is like handling a double-edged sword. It may not be useful for small-scale programs due to a slowdown in execution speed but nevertheless a great skill to have for writing scalable code.
In Rstudio, removing variables and frames when they are no longer required with the rm() function, garbage collection using gc() command and selecting the relevant features and data for proceeding are ways to manage memory.
Adjusting RAM usage with memory.limit() and setting parallel processing are also tasks for managing your memory usage. Remember! Memory management goes hand in hand with data backup.
It only takes a few seconds create and store copies of data. It should be done to ensure that data loss does not occur if backtracking is required.
Have a look at this example snippet which stores the master data and then frees up memory.
# dividing master dataset into train and test with ratio 7:3
library(dplyr)
train<-sample_frac(master_data, 0.7
train_ind<-as.numeric(rownames(train))
test<-master_data[-train_ind,]
# saving backup of master_data and removing unneeded data
write.csv(master_data,”master_data.csv”)
rm(master_data)
rm(train_ind)
gc()<span style="font-family: -apple-system, BlinkMacSystemFont, 'Segoe UI', Roboto, Oxygen-Sans, Ubuntu, Cantarell, 'Helvetica Neue', sans-serif; font-size: 16px; background-color: #ffffff;"> </span>
8. Remove Redundant Tasks
Sometimes programmers do some tasks repeatedly or forget to remove program code without knowing it.
Writing separate iterations for each data manipulation step, leaving libraries loaded even after they are no longer required, not removing features until the last moment, multiple joins and queries,etc. are some examples of redundancy lurking in your code.
While these happen somewhat naturally as more and more changes are made and new logic is added. It is a good practice to look at existing code and adjust your new lines to save runtime.
Redundancy can slow your code so much that removing it can do wonders in execution speed.
# Redundant code
# Takes about 0.5 seconds for iris data
for(i in 1:ncol(df)) {
df[,i]=as.numeric(df[,i])
}
for(i in 1:ncol(df)) {
#storing missing values per column in mis vector
mis[i]=length(which(is.na(df[,i])))
}
#Better implementation (implementations faster than the one below also exist)
#Gives a similar output but takes about 0.3 seconds for iris data - 35% improvement
for(i in 1:ncol(df)) {
df[,i]=as.numeric(df[,i])
#storing missing values per column in mis vector
mis[i]=length(which(is.na(df[,i])))
}
9. Learn to Adapt
No matter how good a programmer you are, you can always be better! This tip is not related to typical coding practices but teamwork. Sharing and understanding codes from peers, Reading codes online (such as from repositories).
setting yourself up to date with books and blogs and learning about new technologies and packages which are released for R are some ways to learn.
Being flexible and adaptive to new methods and keeping yourself up to date with what’s happening in the analytics industry today can help you in avoiding becoming obsolete with old practices.
10. Peer Review
The code you write may be straightforward for you but very complex for everyone else. How will you know that? The only way is to know what others think about it.
Code review is thus the last but not the least in terms of importance for better coding. Ask people to go through your code and be open to suggested edits. You may come across situations when some code you thought is written beautifully can be replaced with more efficient code.
Code review is a process which helps both the coder and reviewer as it is a way of helping each other to improve and move forward.
The Path is Not So Difficult: Conclusion
Becoming a good programmer is no easy feat but becoming better at programming as you progress is possible. Though it will take time, persevering to add strong programming habits will make you a strong member in every team’s arsenal.
These tips are just the beginning and there may be more ways to improve. The knowledge to always keep improving will take you forward and let you taste the sweet results of being a hi-tech programmer.
In the rapidly changing analytics world, staying with the latest tools and techniques is a priority and being good at R programming can be a prime factor towards your progress in your analytics career.
So go out there and make yourself acquainted with the techniques of becoming better at R programming.
This article was originally published at Perceptive Analytics.
Perceptive Analytics partners with businesses to unlock value in data and drive innovation. With two decades of experience, we’ve delivered results for 100+ clients worldwide. Our expertise includes Tableau development services, Chatbot Consulting, and Power BI development services.
0 notes
Text
Introduction to Scratch Programming
Scratch is a block-based programming language that lets children, young adults and digital art beginners create interactive stories, games and cartoons. This Scratch training course introduces the basics of working with sprites, costumes, event blocks and variables to design impressive scripts. We explain how to use coordinates and conditionals in Scratch before showing you how to use iterative drawing and update variables before creating games
#free course#online courses#course#online course creation#online#education#workout#educate yourself#knowledge#health and wellness#r programming#corporate wellness programs
0 notes
Text
they let anyone create functions in r and now I can call my function “lilbitch” and if anyone needs it that’s what they gotta utilise. do programmers enjoy their god complex?
#NDJKDMFLWNXMDKSKLSNCLAOW I love that I can bake a function anything I want!#shoutout to the guy (gender neutral cause I don’t actually know anything about them) who named the functions they created after their cats#if you Rsk me I’m Ruined#r programming
7 notes
·
View notes
Text
The Skills I Acquired on My Path to Becoming a Data Scientist
Data science has emerged as one of the most sought-after fields in recent years, and my journey into this exciting discipline has been nothing short of transformative. As someone with a deep curiosity for extracting insights from data, I was naturally drawn to the world of data science. In this blog post, I will share the skills I acquired on my path to becoming a data scientist, highlighting the importance of a diverse skill set in this field.
The Foundation — Mathematics and Statistics
At the core of data science lies a strong foundation in mathematics and statistics. Concepts such as probability, linear algebra, and statistical inference form the building blocks of data analysis and modeling. Understanding these principles is crucial for making informed decisions and drawing meaningful conclusions from data. Throughout my learning journey, I immersed myself in these mathematical concepts, applying them to real-world problems and honing my analytical skills.
Programming Proficiency
Proficiency in programming languages like Python or R is indispensable for a data scientist. These languages provide the tools and frameworks necessary for data manipulation, analysis, and modeling. I embarked on a journey to learn these languages, starting with the basics and gradually advancing to more complex concepts. Writing efficient and elegant code became second nature to me, enabling me to tackle large datasets and build sophisticated models.
Data Handling and Preprocessing
Working with real-world data is often messy and requires careful handling and preprocessing. This involves techniques such as data cleaning, transformation, and feature engineering. I gained valuable experience in navigating the intricacies of data preprocessing, learning how to deal with missing values, outliers, and inconsistent data formats. These skills allowed me to extract valuable insights from raw data and lay the groundwork for subsequent analysis.
Data Visualization and Communication
Data visualization plays a pivotal role in conveying insights to stakeholders and decision-makers. I realized the power of effective visualizations in telling compelling stories and making complex information accessible. I explored various tools and libraries, such as Matplotlib and Tableau, to create visually appealing and informative visualizations. Sharing these visualizations with others enhanced my ability to communicate data-driven insights effectively.

Machine Learning and Predictive Modeling
Machine learning is a cornerstone of data science, enabling us to build predictive models and make data-driven predictions. I delved into the realm of supervised and unsupervised learning, exploring algorithms such as linear regression, decision trees, and clustering techniques. Through hands-on projects, I gained practical experience in building models, fine-tuning their parameters, and evaluating their performance.
Database Management and SQL
Data science often involves working with large datasets stored in databases. Understanding database management and SQL (Structured Query Language) is essential for extracting valuable information from these repositories. I embarked on a journey to learn SQL, mastering the art of querying databases, joining tables, and aggregating data. These skills allowed me to harness the power of databases and efficiently retrieve the data required for analysis.

Domain Knowledge and Specialization
While technical skills are crucial, domain knowledge adds a unique dimension to data science projects. By specializing in specific industries or domains, data scientists can better understand the context and nuances of the problems they are solving. I explored various domains and acquired specialized knowledge, whether it be healthcare, finance, or marketing. This expertise complemented my technical skills, enabling me to provide insights that were not only data-driven but also tailored to the specific industry.
Soft Skills — Communication and Problem-Solving
In addition to technical skills, soft skills play a vital role in the success of a data scientist. Effective communication allows us to articulate complex ideas and findings to non-technical stakeholders, bridging the gap between data science and business. Problem-solving skills help us navigate challenges and find innovative solutions in a rapidly evolving field. Throughout my journey, I honed these skills, collaborating with teams, presenting findings, and adapting my approach to different audiences.
Continuous Learning and Adaptation
Data science is a field that is constantly evolving, with new tools, technologies, and trends emerging regularly. To stay at the forefront of this ever-changing landscape, continuous learning is essential. I dedicated myself to staying updated by following industry blogs, attending conferences, and participating in courses. This commitment to lifelong learning allowed me to adapt to new challenges, acquire new skills, and remain competitive in the field.
In conclusion, the journey to becoming a data scientist is an exciting and dynamic one, requiring a diverse set of skills. From mathematics and programming to data handling and communication, each skill plays a crucial role in unlocking the potential of data. Aspiring data scientists should embrace this multidimensional nature of the field and embark on their own learning journey. If you want to learn more about Data science, I highly recommend that you contact ACTE Technologies because they offer Data Science courses and job placement opportunities. Experienced teachers can help you learn better. You can find these services both online and offline. Take things step by step and consider enrolling in a course if you’re interested. By acquiring these skills and continuously adapting to new developments, they can make a meaningful impact in the world of data science.
#data science#data visualization#education#information#technology#machine learning#database#sql#predictive analytics#r programming#python#big data#statistics
15 notes
·
View notes