
Don't wanna be here? Send us removal request.
Statistics
We looked inside some of the posts by 201910530 and here's what we found interesting.
Average Info
Notes Per Post
0
Likes Per Post
0
Reblog Per Post
0
Reply Per Post
0
Time Between Posts
4 days
Number of Posts By Type
Text
4
Last Seen Tumblr Blogs


Fun Fact
130K people were victims of a chain letter scam that affected Tumblr in May 2011.
Text
WEEK4
code: #visualiztion seaborn.displot(data["PPINCIMP"].dropna(),kde="False") plt.xlabel("Categories") plt.title("Household Income ") print(data["W1_A1"].describe()) print("XXXXx") print(data["PPETHM"].describe()) print("XXXXx") print(data["PPINCIMP"].describe()) print("XXXXx")
seaborn.catplot(x="W1_A1",y="PPETHM",data=data,kind="bar",ci=None) seaborn.catplot(x="W1_A1",y="PPINCIMP",data=data,kind="bar",ci=None)
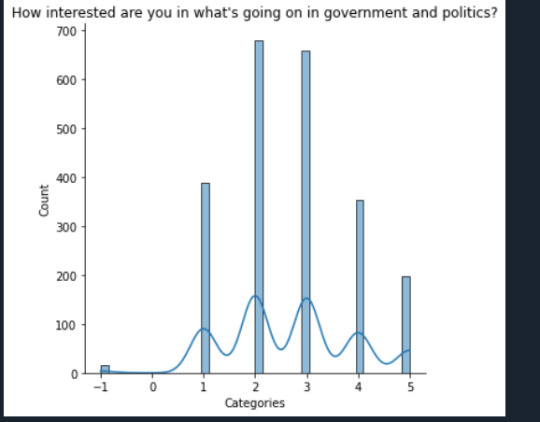
count 2294.000000 mean 2.663906 std 1.213723 min -1.000000 25% 2.000000 50% 3.000000 75% 3.000000 max 5.000000
The majority of people (2) are very interested in politics
----
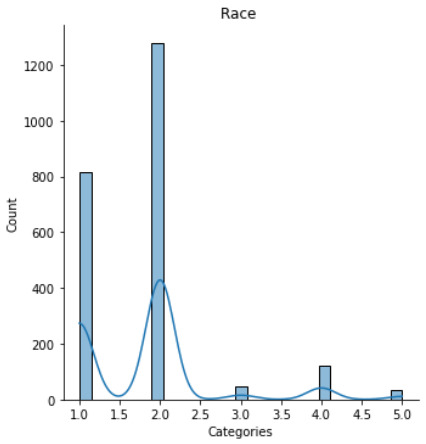
count 2294.000000 mean 1.815606 std 0.827725 min 1.000000 25% 1.000000 50% 2.000000 75% 2.000000 max 5.000000
Black people are the most
----
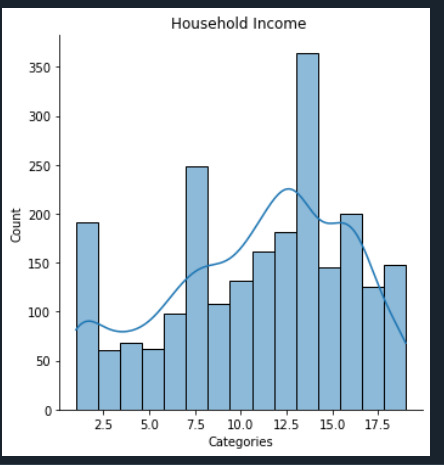
count 2294.000000 mean 10.831299 std 4.938952 min 1.000000 25% 7.000000 50% 12.000000 75% 15.000000 max 19.000000
People with incomes ($ 60,000 to $ 74,999) are the most
----

from the graph the black ppl(5) more Interest in politics than other race
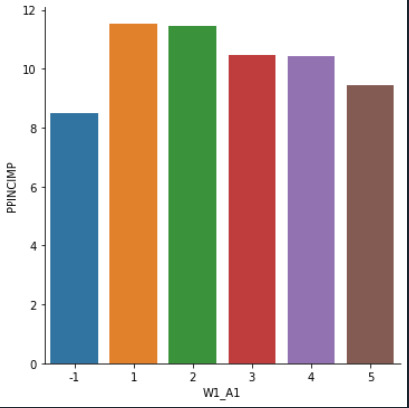
from the graph ppl with more income more Interest in politics than low income ppl
0 notes
Text
WEEK 3


As mentioned in the lessons some data need not be managed My variables do not contain NULL values and they do not contain missing data One of the variables has a value of -1, which means that the participant rejected the answer, which it considered as (NULL) I create a secondary variable by adding two variables (but I see it as illogical)
0 notes
Text
WEEK2
-code:
import pandas as pd import numpy as np data=pd.read_csv("OOL.csv") print("How interested are you in what's going on in government and politics?") print("1:Extremely interested,,2:Very interested,3:Moderately interested,4:Slightly interested,5:Not interested at all") p = data["W1_A1"].value_counts(sort=True,normalize=True) print(p) print(len(data["W1_A1"])) print("########") print("Race") print("1:White, Non-Hispanic,2:Black, Non-Hispanic,3:Other, Non-Hispanic,4:Hispanic,5:2+ Races, Non-Hispanic") p1 = data["PPETHM"].value_counts(sort=True,normalize=True) print(p1) print(len(data["PPETHM"])) print("########") print("Household Income") print("1:Less than $5,000,.....19:$175,000 or more") p2 = data["PPINCIMP"].value_counts(sort=True,normalize=True) print(p2) print(len(data["PPINCIMP"]))
-result(output)
How interested are you in what's going on in government and politics? 1:Extremely interested,,2:Very interested,3:Moderately interested,4:Slightly interested,5:Not interested at all 2 0.295990 3 0.286835 1 0.169573 4 0.154316 5 0.086312 -1 0.006975 Name: W1_A1, dtype: float64 2294 ######## Race 1:White, Non-Hispanic,2:Black, Non-Hispanic,3:Other, Non-Hispanic,4:Hispanic,5:2+ Races, Non-Hispanic 2 0.557105 1 0.354839 4 0.053618 3 0.020052 5 0.014385 Name: PPETHM, dtype: float64 2294 ######## Household Income 1:Less than $5,000,.....19:$175,000 or more 13 0.102441 16 0.087184 12 0.078901 11 0.070619 15 0.063208 8 0.061029 10 0.057541 14 0.056234 1 0.055362 17 0.054490 7 0.047515 9 0.047079 6 0.042720 19 0.037053 4 0.029643 2 0.027899 18 0.027463 5 0.027027 3 0.026591 Name: PPINCIMP, dtype: float64 2294
0 notes
Text
WEEK1
-data set: Outlook on Life Surveys -research question: Is interested are you in what's going on in government and politics associated with Household Income ? Is interested are you in what’s going on in government and politics associated with Race ? -literature review: 1)Are the wealthy classes more interested in politics than the lowest income? Political engagement, it appears, is a privilege for those who aren’t struggling to make ends meet Being politically engaged is a perk of class -- namely, the working class, middle class, and rich.
Being politically engaged is a perk of class -- namely, the working class, middle class, and rich.
Poor Americans tend to work more, leaving little time to debate politics.
references: https://www.theguardian.com/money/us-money-blog/2015/jan/09/poor-americans-are-less-likely-to-vote-and-more-likely-to-distrust-government-study-shows
2)Is interested are you in what’s going on in government and politics associated with Race ? African Americans are overwhelmingly likely (82 percent) to describe their own group as the one that “faces the most discrimination in America today.” Three in five Asian Americans agree that blacks face the most discrimination Latinos support strong forms of affirmative action more than do whites and Asians, but sometimes less than do blacks references: https://www.brookings.edu/articles/american-racial-and-ethnic-politics-in-the-21st-century-a-cautious-look-ahead/
0 notes