
exploration of form and process in computational architecture manchester school of architecture, m.arch
Don't wanna be here? Send us removal request.
Statistics
We looked inside some of the posts by am-cpu-blog and here's what we found interesting.
Average Info
Notes Per Post
15
Likes Per Post
11
Reblog Per Post
3
Reply Per Post
1
Time Between Posts
4 days
Number of Posts By Type
Video
6
Photo
7
Text
1
Last Seen Tumblr Blogs


Fun Fact
After the announcement of the deal with Yahoo!, there were 170K signatures of unhappy Tumblr users petitioning to prevent the sale in 2013.
Video
tumblr
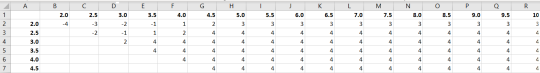
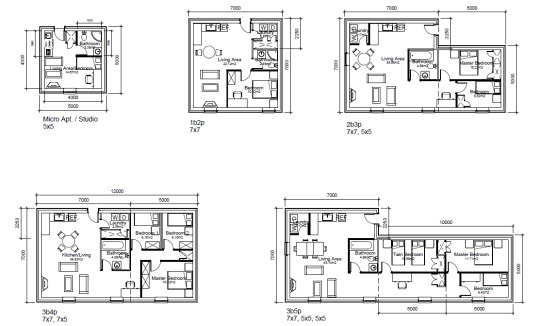
(above: quality matrix assignment and space syntax used to generate floor plans; below: an example of the 36 quality score matrices, scored -4 to +4, used to create the generator.)
There have been several notable examples of quantitative approaches to defining quality (Flanagan & Tate, 1997) (El-Rayes & Kandil, 2005). While useful in a project management capacity, here we will define quality as quantitative outputs as outlined by the UK Government's Housing Quality Indicator (HQI) calculator, as it is country-specific and incorporates design standards that affordable housing providers who receive funding through the Affordable Home Programme are required to meet.
Here, quality is input from 1-10 per apartment type, with the minimum input (1) attaining the minimum quality score passable for both unit size and layout (41 and 32/100 respectively). The input is remapped to the nearest possible quality score for unit size and unit layout (dimensions of internal areas to house furniture plus potential for activity zones). The most applicable scores are shown as suggestions for the dimensions of each area required to meet the needs of the apartment type, where one of each is chosen randomly (shown in the room matrix in blue). These dimensions are then fed in to a physics-based solver where we can assign programmatic elements such as communal, bedroom and bathroom. It is then a case of tracing programme using the concept of space syntax. We can set these programmatic elements to either attract or repel each other for a more cohesive layout, and eventually the solver will settle on a layout based on the syntax we input and the desired quality score as outlined by the HQI.
Further polish is still needed on the attractor/repel physics-model. Fundamentally we aim to create a hierarchy through space syntax rather than a flat, polarised structure that will cluster to an approximate ‘best guess’.
1 note
·
View note
Photo
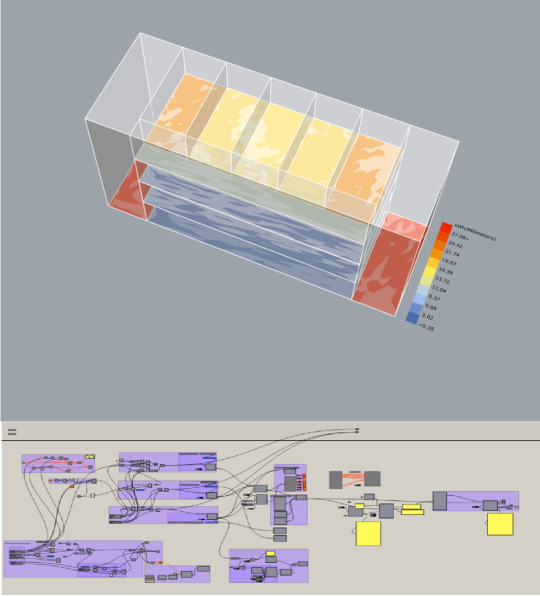
07 HONEYBEE ANALYSIS (TEST)
ANALYSING DESIGN THROUGH USAGE OF HONEYBEE, INTEGRATING SOLAR RADIATION AND MEP SPECIFICATIONS TO REVEAL ENERGY USAGE IN SCHEME
(kWh/SQ.MM)
1 note
·
View note
Video
tumblr
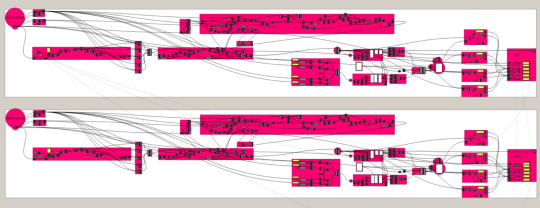
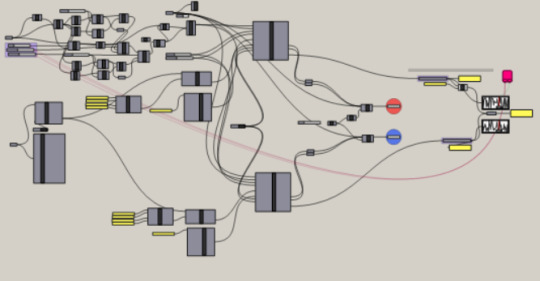
While previously we had been looking at the lowest cost-time output, we have broadened our scope to allow the script to determine how the building might be shaped with different priorities. Four DfMA structures have been chosen and appraised in terms of cost, quality and time. The user’s parallel 1-10 choice input is ran through a neural network to determine which structure is the best fit. The structure informs the maximum number of floors, for example if CLT panels are chosen the building is capped at 6 levels.
Each parameter of the building (right; yellow) is also indexed based on how they impact the cost, quality and time of the construction. These indices are then multiplied and remapped based on their impact. A cost impact of 4 will affect the parameter 4 times as much as an impact of 1, etc.
3 notes
·
View notes
Photo
Any curve length and orientation now yields a linear run of apartments. The script can also take multiple curves as inputs for multiple buildings - simply draw a second curve, copy the white group down and set the new curve.
Galapagos is set to maximise sum(occupants) ÷ sum(modules) while retaining emergency escape routes and initial input length to achieve the highest density and lowest DfMA modules.
0 notes
Video
tumblr
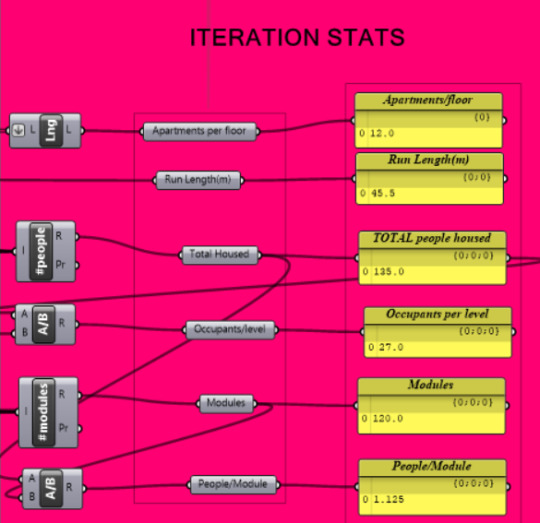
Automation pt. deux. Though a little buggy, the script now assigns emergency escapes at 35m distances (2x17.5 maximum egress distance) and organises apartment typologies by residents (unless there is tricky geometry around the core spacing that only a studio apartment can solve). Studios and 1b2p apartments are distinctly separate from family apartments where possible.
With each iteration the density of occupants can be monitored (shown right; in yellow)
Next up - ‘the right to light’ - adopting minimum standards through environmental analysis via block instances ready to be plugged into the script.
0 notes
Video
tumblr
Apartment typologies linear ‘best fit’. The script picks from a list of widths and depths based on standard DfMA concrete panel sizes and randomises the amount of apartments and their dimensions to satisfy a linear length of 80m as a test. A neural network then decides on the apartment type based on the internal area. These apartment types are stacked for vertical alignment to keep MEP planning as simple as possible.
The next step is to include a break where a core services every 7 apartments with a maximum escape distance of 18m. Also to use a multi-solver to try to achieve a specific line length and also maximum people housed.
2 notes
·
View notes
Photo
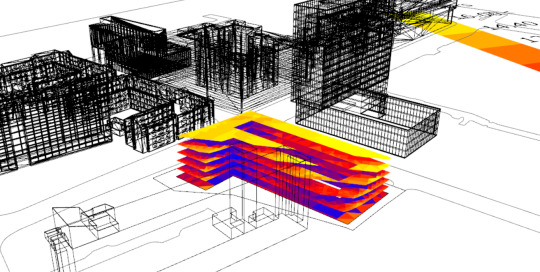
Above: Output for optimised daylight on the site. This does not, however, take into account individal apartments - in order to continue our analysis we have begun to create standard apartment modules based off of standard modular concrete systems. One truck can transport either two 5x5 concrete modules (one micro apt. as seen here) or modules of 7x5 or 7x7. We aim to standardise our apartments based on minimum space requirements through various configurations of these modules.
2 notes
·
View notes
Photo
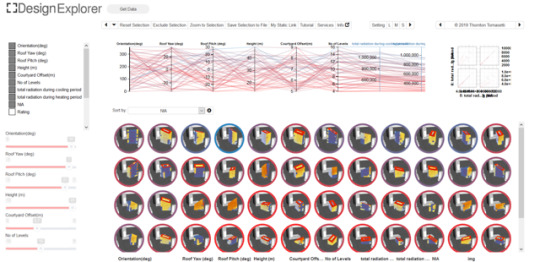
Design Explorer test! Follow the link to see some initial iterations.
http://tt-acm.github.io/DesignExplorer/?ID=BL_2pvwQzf
1 note
·
View note
Video
tumblr
Adaptive inputs for environmental analysis and multi-objective solving downstream. This script aims to specify multiple parameters to be used by Octopus’ evolutionary solver to refine the output iteration performance.
The current workflow is specifying input parameters -> environmental analysis through ladybug -> solving through octopus -> recording each iteration from octopus to a .csv using colibri as a bridge -> visually comparing iterations using design explorer.
2 notes
·
View notes
Video
tumblr
solar optimisation using grasshopper, ladybug and octopus - a proof of concept, taking a weather file of Manchester and finding optimal roof geometry and orientation against radiation(kwh/m2) for both heating and cooling periods. the script takes these two ‘objectives’ and attempts to achieve the highest value based on initial random iterations before an evolutionary process begins where the weakest outputs are culled. the strongest of the generation are carried forward to inform further iterations.
1 note
·
View note
Photo
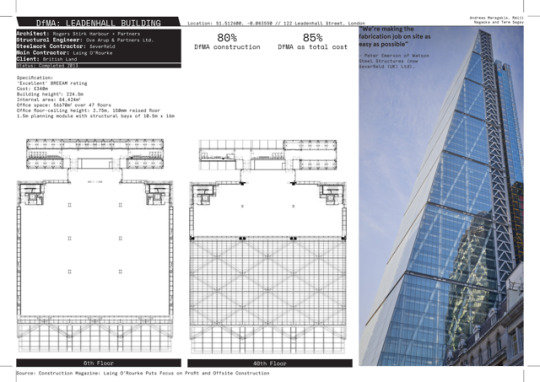
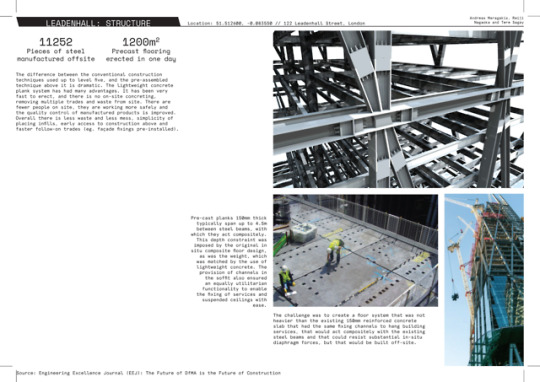
A closer look at DfMA processes: Case study of The Leadenhall Building, London
0 notes
Photo
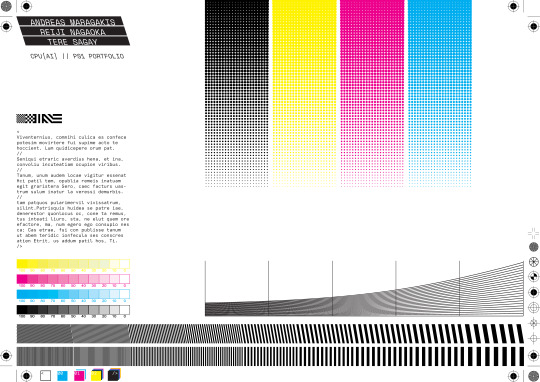
PS1 portfolio: thematically inspired by printer calibration pages, using CMYK as a colour scheme with muted variants of the colours applied to visual data for ease of reading.
1 note
·
View note
Photo


Optimal structural systems for various configurations of social housing on the Houses of Parliament site. Made via Prism
0 notes