
Statistics
We looked inside some of the posts by arbieroo-art and here's what we found interesting.
Average Info
Notes Per Post
38
Likes Per Post
24
Reblog Per Post
13
Reply Per Post
1
Time Between Posts
2 days
Number of Posts By Type
Text
17
Last Seen Tumblr Blogs


Fun Fact
China blocked Tumblr because of pornography and censorship problems in 2013.
Text
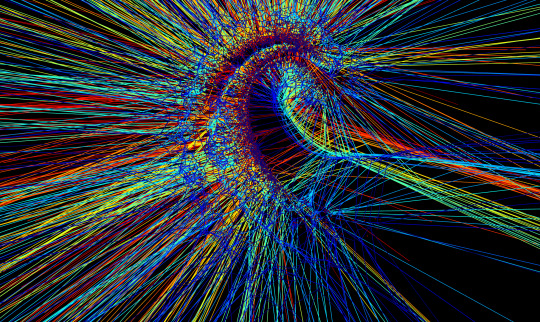
Ikeda Map with Associated Voronoi Diagram
...and a lot of colours!
#art#code art#algoart#algorithmic art#generative art#geometry#chaos#voronoi#voronoi diagram#voronoi cells#Ikeda#Ikeda map
25 notes
·
View notes
Text

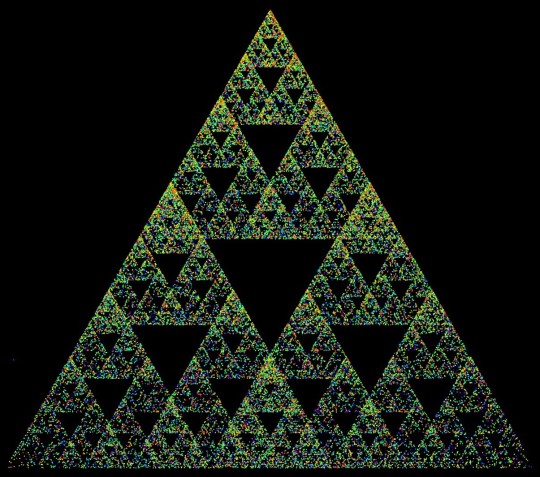
Fractal Generating Random Walk - Negatives & Noise
See the description of this video for basic information:
youtube
The values of divisors in certain ranges have different effects: Exactly 2 gives the Sierpinski triangle, with the empty triangles reaching precisely to the edges of their "parent" triangles. Any value greater than 2 increases the size of the empty triangles (empty triangles now get truncated). Any value greater than 1.5 and less than 2 shrinks the empty triangles so that they do not reach the edges of their parent triangles. Values greater than 1 up to and including 1.5 generate noise. The probability of a point being visited appears to decrease from the centroid out to the edges but the effect weakens as the dividing value increases. If the divisor is exactly 1, the walk does not move! For values less than one but greater than zero, the poles become repellors instead of attractors. The walk will tend to infinity. Dividing by zero will cause the universe to end, so don't do that, please!
All the above assumes that all three poles use the same divisor. If the divisors are not all equal, the the edge opposite each pole behaves as the divisor for that pole would suggest e.g. in this case the top pole has a divisor = 1.5 and the other two poles have -2.5 as their divisor.
1 note
·
View note
Text
youtube
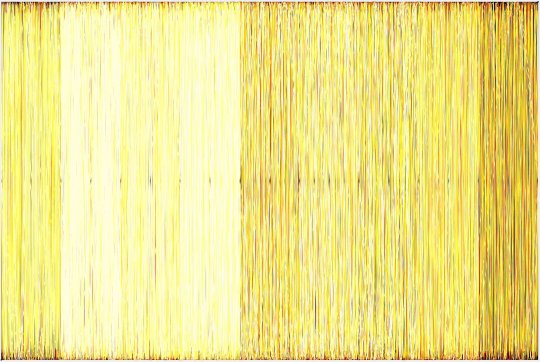
Fence - Pascal's Triangle, Yellow
Constructed from 250 sine curves of equal amplitude but various colours, lengths, frequencies, starting positions and ending positions and following a simple deterministic set of rules, this might be a unique way to paint a fence. The choice of 250 curves was accidental but proved pleasing to me. Whilst the rules are perfectly deterministic, it is acting on a sequence of natural numbers in the range 0-9, inclusive, and in this case those numbers were the first 250 digits of the Pascal triangle.
0 notes
Text
Straight Yellow Fence Constructed from 250 sine curves of equal amplitude but various colours, lengths, frequencies, starting positions and ending positions and following a simple deterministic set of rules, this might be a unique way to paint a fence.
#art#code art#algoart#algorithmic art#generative art#geometry#abstract art#abstract#geometrical art#geometric#geometric art
2 notes
·
View notes
Text

Mouse Map A 1-dimensional map with chaotic solutions for some parameter values. This shows the first circa 10,000 iterations, with value (x) on the vertical access) and "time" (strictly, iteration number, N) on the horizontal access, for a chaotic example. Each point is given a large circular marker, such that markers overlap to the extent that the grey background is almost completely covered and is only visible in rare and small areas. The colour of each marker is determined by a set of RGB triples. The R channels goes from 0 to 1 on the horizontal axis. The G channel goes from 0 to 1 on the vertical axis. The B channel cycles from 0 to 1 in 23 steps, repeatedly, hence not mapping to either axis.
"Mouse map" is another name for the Gauss iterative map, which comes from the pattern formed in the bifurcation diagram for the map. I might illustrate it some time.
0 notes
Text
youtube
The Sacks number spiral plots the natural numbers (including zero) on an Archimedean spiral, such that the square numbers, 1,4,9... occur at each complete revolution. The very small gold dots indicate natural numbers. Here, the natural number solutions of polynomials of the form n^3 + n^2 +n + C are plotted for cases C = 1,2,3...500. Each forms its own spiral and is plotted in its own colour, starting with C = 1 = deep red and ending with C = 500 = bright yellow. Some spirals intersect previous ones and the colour of the newest spiral over-writes the previous colour where this happens.
1 note
·
View note
Text
SierSierpinski OverOverlap Whilst there are three smaller copies of the original each containing three smaller copies of the original and so on, the copies overlap slightly. The image is generated by a kind of random walk. At each step, the position moves toward one of the outermost corners. Which one is chosen randomly with equal probability of each outcome. Usually, the distance moved is half way from the current position to the corner chosen. This gives a perfect Sierpinski triangle. In this case I have changed the fractional distance moved if either of the bottom corners is chosen. Instead of dividing the distance by 2, I divide by 1.6. (It's still divide by 2 for the top corner.) This not only creates the overlap but also a reduced likelihood of the steps appearing as you descend the outer triangle. This reduced likelihood is replicated in each smaller copy of the whole.
#art#code art#algoart#algorithmic art#generative art#geometry#Sierpinski#Sierpinski triangle#fractals#fractal#fractal art
0 notes
Text

Euler Bone Fence
Constructed from 250 sine curves of equal amplitude but various colours, lengths, frequencies, starting positions and ending positions and following a simple deterministic set of rules, this might be a unique way to paint a fence. The choice of 250 curves was accidental but proved pleasing to me. Whilst the rules are perfectly deterministic, it is acting on a sequence of natural numbers in the range 0-9, inclusive, and in this case those numbers were the first 250 digits of Euler's number.
0 notes
Text

The Gauss Map A 1-dimensional map with chaotic solutions for some parameter values. This shows the first circa 1,000 iterations, with value (x) on the vertical access) and "time" (strictly, iteration number, N) on the horizontal access, for a chaotic example. The colour of each marker is determined by a set of RGB triples. The R channel goes from 0 to 1 on the horizontal axis. The G channel cycles from 0 to 1 in 23 steps, repeatedly, hence not mapping to either axis. The B channel goes from 0 to 1 on the vertical axis.
1 note
·
View note
Text

Still from a neighbour counting cellular automaton animation.
1 note
·
View note
Text

Blue Sky Euler Cycle Fence Constructed from 250 sine curves of equal amplitude but various colours, lengths, frequencies, starting positions and ending positions and following a simple deterministic set of rules, this might be a unique way to paint a fence. The choice of 250 curves was accidental but proved pleasing to me. The rules are perfectly deterministic and acting on a sequence of natural numbers in the range 0-9, inclusive. In this case those numbers were the first 250 digits of Euler's number.
1 note
·
View note
Text
The Gauss Map A 1-dimensional map with chaotic solutions for some parameter values. This shows the first circa 1,000 iterations, with value (x) on the vertical access) and "time" (strictly, iteration number, N) on the horizontal access, for a chaotic example. Each point is given a large circular marker, such that markers overlap to the extent that the grey background is almost completely covered and is only visible in rare and small areas. The colour of each marker is determined by a set of RGB triples. The R channel goes from 0 to 1 on the horizontal axis. The G channel cycles from 0 to 1 in 23 steps, repeatedly, hence not mapping to either axis. The B channel goes from 0 to 1 on the vertical axis.
#art#code art#algoart#algorithmic art#generative art#chaos#chaos theory#gauss#gaussmap#strange attractor
1 note
·
View note
Text

Sacks Number Spiral: Cubic The Sacks number spiral plots the natural numbers (including zero) on an Archimedean spiral, such that the square numbers, 1,4,9... occur at each complete revolution. Here, polynomials of the form n^3 + n^2 + n + C are plotted for cases C = 1,2,3...500. Each forms its own spiral and is plotted in its own colour, starting with C = 1 = bright yellow and ending with C = 100 = deep red. Successive spirals intersect previous ones and the colour of the newest spiral over-writes the previous colour where this happens.
#art#code art#algoart#algorithmic art#generative art#geometry#sacks spiral#spirals#maths#chaos#mathematics#math
0 notes
Text

Fence - Pascal Rainbow Cycle
Constructed from 250 sine curves of equal amplitude but various colours, lengths, frequencies, starting positions and ending positions and following a simple deterministic set of rules, this might be a unique way to paint a fence. The choice of 250 curves was accidental but proved pleasing to me. The rules are perfectly deterministic. They are acting on a sequence of natural numbers in the range 0-9, inclusive, and in this case those numbers were the first 250 digits of Pascal's triangle.
0 notes
Text

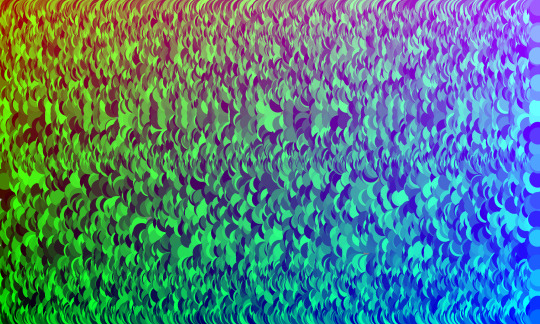
The Gauss Map A 1-dimensional map with chaotic solutions for some parameter values. This shows the first circa 1,000 iterations, with value (x) on the vertical access) and "time" (strictly, iteration number, N) on the horizontal access, for a chaotic example. Each point is given a large circular marker, such that markers overlap to the extent that the grey background is almost completely covered and is only visible in rare and small areas. The colour of each marker is determined by a set of RGB triples. The R channel goes from 0 to 1 on the vertical axis. The G channel cycles from 0 to 1 in 23 steps, repeatedly, hence not mapping to either axis. The B channel goes from 0 to 1 on the horizontal axis.
0 notes
Text

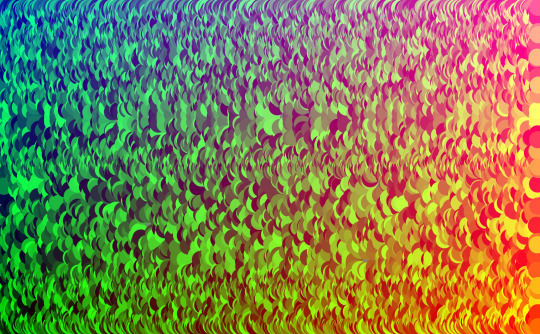
Pile of Rocks III A modification of the Sandpile cellular automaton such that unstable cells avalanche to all neighbouring cells (not just edge-neighbours). I decided, in the absence of knowledge of a better or accepted term, to call this automaton "Rockpiles."
4 notes
·
View notes
Text
The Gauss Map A 1-dimensional map with chaotic solutions for some parameter values. This shows the first circa 1,000 iterations, with value (x) on the vertical access) and "time" (strictly, iteration number, N) on the horizontal access, for a chaotic example. Each point is given a large circular marker, such that markers overlap to the extent that the grey background is almost completely covered and is only visible in rare and small areas. The colour of each marker is determined by a set of RGB triples. The R channel goes from 0 to 1 on the vertical axis. The G channel cycles from 0 to 1 in 23 steps, repeatedly, hence not mapping to either axis. The B channel goes from 0 to 1 on the horizontal axis.
#art#code art#algoart#algorithmic art#generative art#geometry#chaos#chaos theory#maths#math#mathematics#gauss map#geometrical art#geometric art
1 note
·
View note