attentionsurplus
Attention Surplus
The world conveyed through maps
4 posts
Don't wanna be here? Send us removal request.
Last Seen Blogs


Text
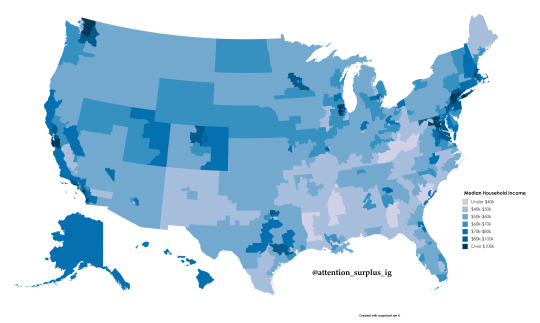
Median household income by congressional district
0 notes
Text
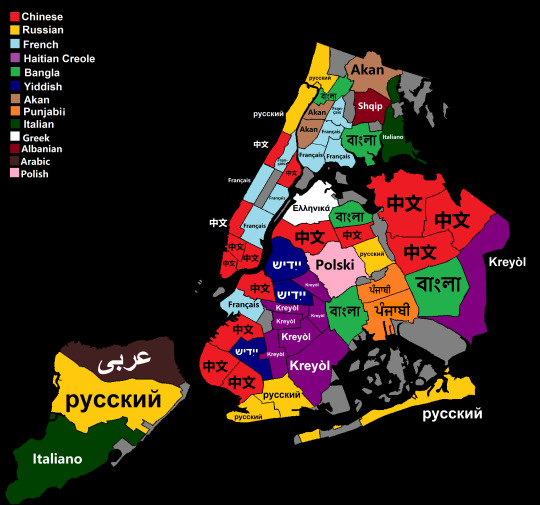
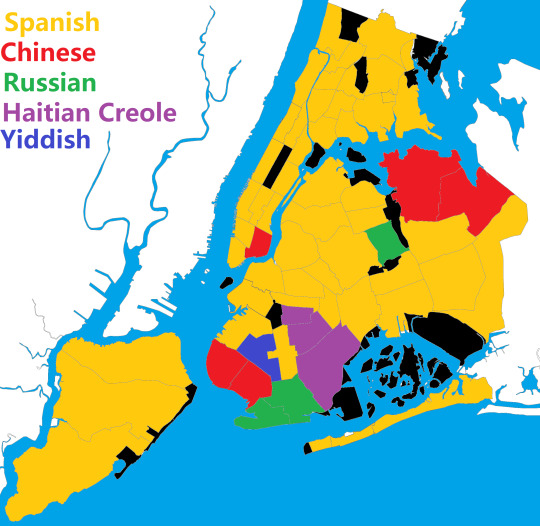
Most spoken language by neighborhood in NYC
We all know New York City is one of the most diverse places in the world, and this map really encapsulates that. Around half of the city's population speaks a language besides English at home, and half of the time that language is Spanish. People from across Latin America are an extremely large and important community in New York, and if either English or Spanish were included on this map, they would've dominated almost everywhere. But this would mask the massive linguistic diversity in the city, and the nearly 2 million New Yorkers who speak another language besides those two.
So I decided to create a map showcasing all the other languages, and I actually wrote in those languages on the map because it looks absolutely gorgeous that way. The divisions on this map are the census's "community districts", all of which include several different neighborhoods and most of which have over 100,000 people.
Again, even though I've excluded English and Spanish, lots of large groups are invisible on the map because so many people are grouped together in the community districts.
Some of the most notable absences are Arabs in Bay Ridge and Little Yemen, Koreans in northeast Queens, Poles in Greenpoint, Pakistanis in Midwood, Bangladeshis in Kensington and Astoria, Nepalis in central Queens, Uzbeks in south Brooklyn, and many others. These are all massive communities that aren't shown because they live in close proximity to even larger ones.
There's also the opposite issue. Some areas have relatively few immigrants (at least by NYC standards), and in others the overwhelming majority of them speak Spanish. In areas like this, the third-biggest linguistic group might be just 2-3% of the population. This is how you might get misled into thinking NYC has a massive Francophone population--most areas where French takes third place either have few immigrants, as in Lower Manhattan, or where the vast majority of immigrants are Latino, as in the Bronx. The former has a sizeable population of wealthy French immigrants, and the latter has quite a few Francophones from West Africa (particularly Senegal), but there are still no French-speaking countries in the top 20 sources on New York's immigrants.
This isn't necessarily a map of immigration. Three of the top ten immigrant groups in NYC are Jamaicans, Trinidadians, and Guyanese, all of whom speak English. As a result, this map doesn't reflect the massive West Indian presence in the city, especially in the north Bronx, central and eastern Brooklyn, and southeast Queens--all the areas where Haitian Creole is widely spoken have an even bigger presence of English-speaking immigrants from the Caribbean. The areas on the map where Punjabi is spoken are also home to many Guyanese and Trinidadians of Indian descent.
Inversely, not all the major groups on this map are immigrants--New York's surprisingly big Yiddish-speaking population comes from Hasidic Jews, who have mostly been in this country for several generations but, being a closed-off community, have hung on to their language. They generally use Yiddish for everyday life, Hebrew for religious purposes, and English to communicate with outsiders.
I'm aware that China has many languages. The language section of the census gives people the options of Mandarin, Fuzhounese, Sichuanese, Cantonese, Hainanese, or simply "Chinese." The majority of respondents chose "Chinese", so for simplicity's sake I decided to combine them all under that name. If I hadn't, this map would have a lot less red on it.
If you're curious, Akan is a language, or some would say a group of languages, that are spoken in most of Ghana, where many immigrants to the Bronx come from.
I made this map around a year ago using a tool from the Census Bureau that allowed you to see how many people spoke a given language in a given area. Unfortunately, that tool required Flash Player, which is no defunct, so I guess you'll have to take my word for it. I promise you it doesn't serve any sort of nefarious agenda of mine to have people believe Bangla is the third-most-spoken language in Community District 12.
If you wanna see something more detailed, check out Jill Hubley's amazing map: https://www.jillhubley.com/project/nyclanguages/
If you're curious about what this map would look like with English and Spanish included, here ya go:
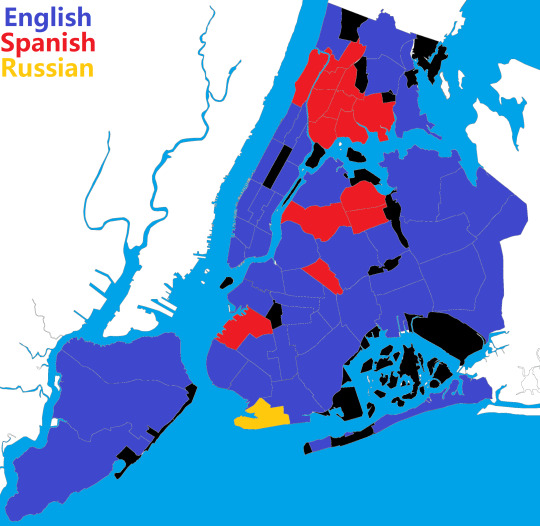
Or just Spanish:
#nyc#demographics#languages#linguistics#maps#data#immigration#diversity#español#中文#русский#polski#বাংলা#ਪੰਜਾਬੀ#shqip#neighborhoods#new york#new york city
14 notes
·
View notes
Text
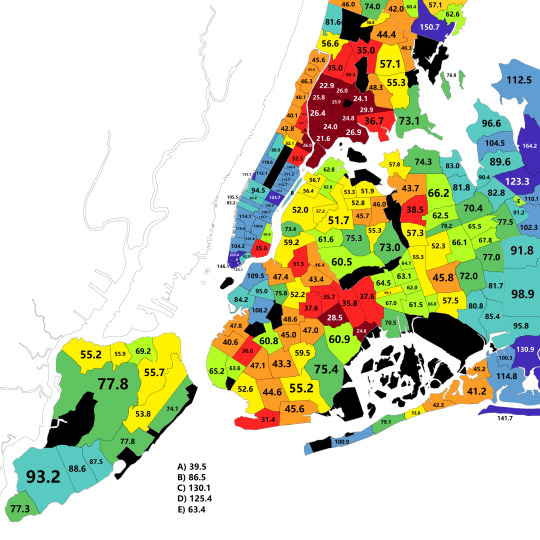
Median household income (in thousands of dollars) by ZIP code in New York City
If you look at the big picture, there's a clear pattern: the wealthy concentrate in the center of the city (lower Manhattan) and the suburbs outside it (Long Island), while the area in between those two--the urban periphary--is home to the working class. Cities across America follow this pattern, which is a result of rich people wanting to live either in the fashionable, exciting downtown areas close to where they work, or in the suburbs with their big houses and quiet, secluded settings.
This pattern also reflects the impact of the shift in the mid-20th century to car-oriented cities: many working-class neighborhoods on the periphary were destroyed by highways being built through them, making them noisy, polluted, and impossible to walk around in. Downtowns were usually considered too important to tear up this way, while the suburbs were built around cars to begin with, so this was never an issue.
The Bronx is a textbook example of the disastrous effects of building highways through a densely populated area that was originally built around public transit. The construction of subway lines there, which allowed people to commute to their jobs in Manhattan, turned the Bronx from rural to urban in just twenty years--its population skyrocketed from 90,000 in 1890 to 420,000 in 1910. Working-class Irish, Italians, and Jews fled the filthy tenements of lower Manhattan for more spacious apartments in the Bronx. In the 1950s, as Black and Puerto Rican migrants flocked to the borough, several highways were built right through it, displacing thousands of residents and turning streets from bustling commercial thoroughfares into barren no-mans-land that divided communities in two. This made the white flight in the Bronx even more severe, and for a time, the borough really was a crack-infested, crime-ridden, decaying hellhole. Dominicans and other immigrants have helped revive the area by solving the problem of underpopulation (which contributes to crime and housing decay) and setting up new businesses, so the Bronx is much safer and more liveable than it used to be. But as the map above shows, the poverty there is still striking, and the 15th Congressional District, which covers the southern part of the borough, is the poorest district in America. That's what happens when people who mainly get around on foot or on public transit still have to deal with the problems caused by highways right in their backyard. NYC's poorest ZIP code is Mott Haven at the southern tip of the Bronx, a mainly Latino neighborhood which is polluted by both highways and industrial areas nearby.
Each borough has its own pattern. Manhattan is sharply divided between a rich south and a poor north. Queens is mostly middle-class with some wealthy areas on the outskirts. We think of Brooklyn as hip and gentrifying, but a look at the map shows that this is only true for a small portion of it. Most of the borough is still dominated by working-class immigrants and ethnic minorities--Latinos, West Indians, African-Americans, Hasidic Jews, Pakistanis, Russians, and Chinese. Staten Island is mainly middle-class, while Westchester County is a mixed bag. The parts of Long Island shown on this map are incredibly wealthy, although the further east you go, the commute to Manhattan gets longer and as a result the people who live there get less affluent.
In case you're wondering, yes, there's a very strong correlation between wealth and whiteness. The median household income for White New Yorkers is around $80.3k, compared to $59.4k for Asians, $42.6k for Blacks, and $37.5k for Latinos. Here's a map of race by ZIP code to compare with the income map:
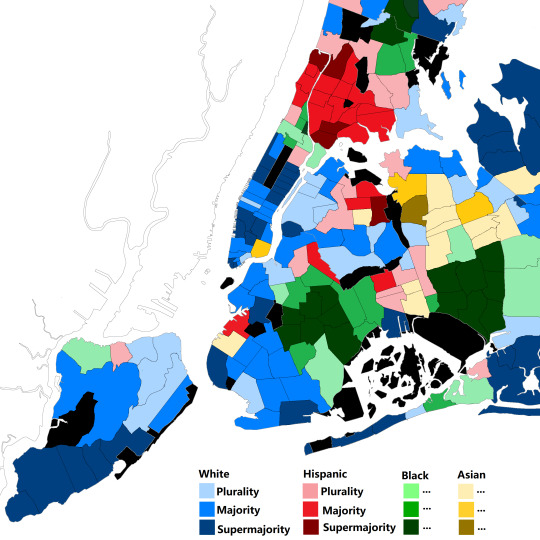
The two maps line up fairly neatly, with just a few exceptions: W`hite but poor south Brooklyn (home to impoverished Eastern European immigrants and Hasidic Jews) ; the affluent Black neighborhoods in southeast Queens and east Brooklyn (where many successful West Indian immigrants own homes); and the middle-class neighborhoods in south-central Queens that are mainly Latino and Indo-Guyanese.
It's noteworthy that Asians, who in America as a whole have the highest median income of any group, are significantly poorer than Whites in NYC. This is because Asians who come to the US already having money and education tend to settle in affluent suburban areas. Poor Asian immigrants who have to work their way up often start out in working-class areas of cities like New York and San Francisco. Of course, "Asian" is an incredibly broad category, so there's a lot of variation. There are affluent Asian areas, like northeastern and south-central Queens, which are mainly Korean and Indian, respectively. Those groups are quite a bit wealthier than the average New Yorker. Chinese immigrants, on the other hand, live in some of the worst poverty of any group in NYC. That one poor ZIP code in Lower Manhattan? That's Chinatown. The poorest ZIP code in Queens? Flushing.
For similar reasons, Latinos are also slightly poorer in NYC than in the rest of the country. Black New Yorkers, on the other hand, are better off than Black Americans overall, since African and Caribbean immigrants--who are plentiful in New York--tend to be more successful than African-Americans. Unsurprisingly, White New Yorkers are much wealthier than White Americans as a whole--$80k and $61k respectively--since most poor Whites live in rural areas.
The prize for NYC's richest ZIP code goes to 10007, which has a median income of $235k--more than 4x as much as the city as a whole. It's really not surprising, considering that this includes Battery Park City, a series of towers overlooking the Hudson River that are surrounded by tree-covered walking paths and are a short walk away from Wall Street, where many residents work. In fact, many of the city's wealthiest ZIP codes are near the Financial District. Others are in obscenely rich suburbs, like Scarsdale in Westchester County and Great Neck in Long Island, which are dominated by beautiful old houses and quiet tree-lined streets.
Finally, its important to note than median household income (MHI) isn't a perfect measure of a family's prosperity. "Household" is an important word here for a few reasons:
--MHI doesn't take into account family size. Two adults might make the same income, but if one has kids and the other doesn't, the latter will for all intents and purposes have more money. So Brooklyn's Hasidic neighborhoods, where the average woman has seven kids, are probably even poorer than their incomes suggest. The same is true to a lesser extent in Latino areas.
--MHI doesn't nessecarily correspond to how much someone makes, because it doesn't take into account how many wage earners there are in a household. Lower Manhattan is even richer than it seems, because most people there are young and single, so it's just one person making all that money. Those rich suburbs in Long Island only seem wealthier than lower Manhattan because most households there are married couples with two working adults. Similarly, the high rate of single-parent households probably plays an even bigger role than low wages in the poverty of the South Bronx or northeast Brooklyn.
--Finally, there's a difference between income and wealth. Wealth takes into account the assets you own, such as homes and businesses, while income only counts your salary. So two people could be making the same amount of money, but if one owns a home and the other rents, there's a big difference in how wealthy they are. This is why the income of a median White family is "only" 1.6x higher than the median Black family, but in terms of wealth, the gap is much bigger--about 12x as much for Whites. This is because even when you take into account class differences, White people are much more likely to own homes as a result of redlining, which made it much easier for them to get low-interest homeowners' loans.
Data source: https://statisticalatlas.com/place/New-York/New-York/Overview
#maps#data#demographics#nyc#new york#new york city#inequality#rich and poor#battery park city#great neck#brooklyn#bronx#queens#manhattan#neighborhoods#segregation#systemic racism#urban planning
9 notes
·
View notes