
Don't wanna be here? Send us removal request.
Statistics
We looked inside some of the posts by cokeefedesign and here's what we found interesting.
Average Info
Notes Per Post
1
Likes Per Post
0
Reblog Per Post
1
Reply Per Post
0
Time Between Posts
16 days
Number of Posts By Type
Text
12
Last Seen Tumblr Blogs


Fun Fact
Tumblr was attacked by a cross-site scripting worm deployed by the Internet troll group GNAA on Dec 3, 2012.
Text


Design Rationale
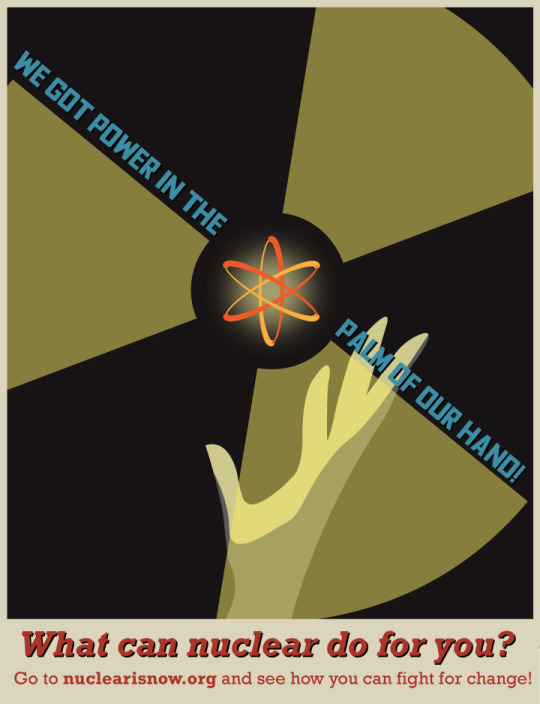
My goal with the Nuclear is Now campaign is to get younger, climate conscious voters interested in the idea of nuclear power through accessible information and an eye-catching design style. Nuclear is much more polarizing than other forms of energy production; mainly operating facility disasters and the association with weapons of mass destruction linger in people's minds and create unease at the thought of a nationwide nuclear power grid. In reality, nuclear energy already provides a majority of the United States’ emission-free power. 20% of all our electricity comes from nuclear plants. It is as safe as renewable energy sources while being vastly more efficient in regards to the space it occupies, wind and solar power don’t come anywhere close in the land necessary to power output ratio.
When researching I came across atomic age Soviet posters used during the early years of the Cold War. They were propaganda posters designed to get the public interested in science behind the nuclear arms race. They are all recognizable in a way only propaganda posters can be, and I focused on a selection that stood out for their distinct vibrant oranges, dark reds, and pale yellows, along with still strong but toned down mid to dark blues as a base. This was the final palette I chose to work off, along with blacks and dark grays for added contrast. Most of the designs used the atomic symbol as a focal point and I wanted to incorporate both the recognizable atom and nuclear logo, I knew that I absolutely needed to include these for clarity.
I wanted to create a striking design that used similar mid-century staples but also mixed them up for modern audiences. The discussion of nuclear power today is reminiscent of the original atomic debate, so I wanted the design to harken back to the past without overtly copying content from that time.
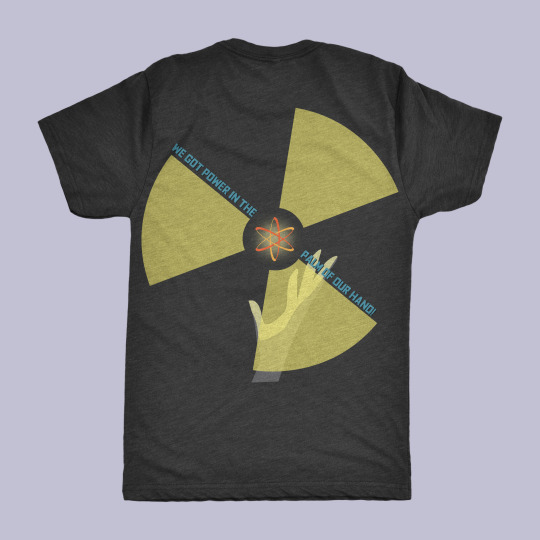
When I’m creating designs I rarely if ever have one idea and stick to it throughout the entire process. I don’t work rigidly within the stages of research, brainstorming, and final production, and if an idea strikes me late in the process, I will take time to sketch it out and see how it compares. I’ll often discover more designs that emulate what I want to create and give me more inspiration. Early wireframing helps me see how ideas are developing but those aren't always what make it to the final. For this project I knew I wanted light from an atom to illuminate a dark space and cast shadows on vague but discernible human silhouettes. I started with faces but saw other designs that utilized hands and decided that would be the better choice for this composition. I originally had the yellow nuclear logo providing all of the luminosity but then added a central source of light coming from the atom itself and that helped the atom become even more of a focal point. For the brochure I wanted it to feel different enough from the poster but still maintain the similar elements. Since I included almost no information on the poster, I knew the brochure had to contain everything important enough for someone interested to know. The poster was intended to function as the attention getter, and the brochure would be the supplementary material to actually learn. Even though it had to contain mostly information I didn't want the brochure to feel mired in text. I opted to portray the most important statistics as graphics, or just larger text visually distinct from a normal paragraph. The deathprint statistic I immediately knew I would include and the bar graph highlights just how massive the disparity across energy sources is.
The design I felt most satisfied with was the poster. I had found multiple posters that I was using for reference and liked different elements from each but wasn't totally sure how to incorporate them all in a cohesive way. Once the elements were assembled, I started to fine tune the color scheme. I wanted a dark background and ended up going with a very dark gray instead of a black as pure black often feels too heavy. With the number of light elements I included it wouldn't have been enough to offset a true black. I downloaded a typeface called Fyodor which was perfect for emulating the bold Russian style of letters that dominated these kinds of posters. Overall, I’m very satisfied with how this campaign turned out and I feel more experienced creating and working within one cohesive palette, and also working simultaneously across the different Adobe programs on one project.
0 notes
Text
Guerilla Advocacy Campaign Design Proposal
The topic I will be advocating for is the widespread transition to nuclear power as the main source of electricity in the United States. As each year passes, we are closer to passing a point of no return for climate change, if immediate action is not taken then the Earth will be irrevocably damaged in the coming decades. Renewable energy plans are always in development around the world but they are costly and time consuming to implement. They are a good solution for the future, but not the best for right now. Nuclear power already provides 20% of the United States electricity consumption and is the second largest clean power provider for the world, behind only hydropower. It produces 800 billion kilowatt hours of electricity per year, more than half of the nation's emission free electricity; it keeps 470 million metric tons of carbon out of the atmosphere, equivalent to removing 100 million cars from the road.
Nuclear power has long had a stigma surrounding the safety concerns of operating the plants. Following the disasters at Chernobyl and Fukushima people became especially wary of nuclear power, and the close association with nuclear weapons of mass destruction leaves people concerned for their well-being. Addressing these concerns will be one of the main priorities of this campaign, people need to be comfortable with the prospect of nuclear energy if progress is ever to be made. Nuclear energy is the victim of low-frequency but highly controversial disasters, but is not significantly more dangerous than other green sources of energy. Even including the two aforementioned plant disasters, nuclear power has a similar deathprint (amount of deaths per kilowatt hour of electricity produced) to solar power, is just below wind, and is vastly less than nonrenewable sources. To put it in perspective coal production causes 330 times more deaths than nuclear production; the oil death toll is 250 times nuclear and the natural gas toll comes in at 38 times. Public concern over the safety of nuclear power is one of the biggest obstacles preventing its widespread usage, and the safety statistics will be included to alleviate these worries. The target audience for this campaign will be people between 18 and 30 who are concerned about the environment. Young people are the demographic with one of the lowest voting turnouts and tend to support the transition away from traditional dirty sources of energy. The goal is to get these voters to make their voices heard and advocate for policies that embrace nuclear power and bring its utility to the attention of their representatives and peers.
I will utilize the palette I developed on my style tile as the central design elements, there is a nice mix of warm and cool colors, which will contrast well against the darker gray base layers I plan to use. The orange, yellow, and darker reds will be used on the elements I want to pop and catch people's attention, mainly the informational graphic and smaller icons and logos. The main icons I have planned are a few variations of the nuclear symbol and an atom. These colors are also similar to the palettes of the 20th century atomic age posters included in my moodboard. I will use a number of different font families to create a distinct hierarchy across the various titles and body text. I decided clearly legible would be best and I chose fonts that are less modern, Rockwell in particular has maintained popularity since the 30s and retains that mid-century appeal that I am aiming to create. I’ll create an infographic showcasing the differences between the death tolls of traditional energy production methods compared to that of nuclear power. A bar graph would display how large the disparities really are and that nuclear power is not only extremely efficient, but has nowhere near the human cost that our current energy infrastructure does.
The expansion of dependence on nuclear energy is perceived by many people to be a dangerous prospect that would pollute the environment and risk lives; however it has consistently proven to be more efficient than any other existing energy source and as safe if not safer than its renewable counterparts. The ultimate goal of this campaign is to dispel the negative stigma that surrounds nuclear alternatives through a combination of accurate, memorable information and a strong design vision.
0 notes
Text


Research
Topic: Investing in nuclear energy
Audience: Young people of voting age (18-30) anyone interested in ensuring the viability of clean energy
Climate change is an issue that needs immediate responses to ensure the preservation of our environment. Renewable green energy is a great step in the right direction, but too many regions are relying solely on renewable sources which is not necessarily the best solution. Nuclear energy is by far the most efficient source of energy production we currently have access to and is one of the safer forms of clean energy. Nuclear plants in the United States generate nearly 800 billion kilowatt hours of electricity each year and produce more than half of the nation’s emissions-free electricity. This actively avoids the output of more than 470 million metric tons of carbon each year, equivalent to removing 100 million cars from the road.
Nuclear power is more stigmatized than other clean energy methods because of a small number of infrequent yet high-visibility events, mainly the meltdowns of the plants at Chernobyl and Fukushima. However, when compared to other forms of widely accepted renewable energy the casualties caused are of a similar rate, even after factoring in those disasters. The negative perception of nuclear power has been shaped through its depictions in popular media and information about nuclear benefits needs to be accessible for people’s minds to change.
Nuclear is already the largest source of clean energy in the US, second in the world behind only hydropower
Produces less carbon pollution than solar, geothermal, or wind power
2x more efficient than coal plants, 3x more efficient than renewable plants
330 times fewer deaths than coal; 250 times less than oil; and 38 times fewer than gas
Nuclear has a lower deathprint (people killed per kilowatt-hour of electricity produced) than wind, even including Chernobyl and Fukushima
Supplied a fifth of the US’s power each year since 1990
Wind farms require 360 times more land area to produce the same amount of electricity and solar plants require 75 times more land
2,000 metric tons of fuel spent each year, less than half the volume of an Olympic-sized swimming pool powers 70 million homes
The energy gap created through decommissioning nuclear plants is being filled with fossil fuels, not renewable sources
Nuclear waste is recyclable, spent fuel is being reused to supply plants in France, the US does not participate
Call to Action: We call on young voters committed to clean energy to make their voices heard about the benefits of nuclear power. They can join advocacy groups that lobby for pro-nuclear energy policies and contact their representatives.
Sources
“5 Fast Facts about Spent Nuclear Fuel.” Energy.gov, 3 Oct. 2022, https://www.energy.gov/ne/articles/5-fast-facts-about-spent-nuclear-fuel.
“Advantages and Challenges of Nuclear Energy.” Energy.gov, Office of Nuclear Energy, 29 Mar. 2021, https://www.energy.gov/ne/articles/advantages-and-challenges-nuclear-energy.
Berriault, Lea. “Why Nuclear Power Is Safer than Ever.” GIS Reports, 2 Feb. 2022, https://www.gisreportsonline.com/r/nuclear-energy-safe/.
Calderone, Len. “What Is the Safest Energy for the Future?” AltEnergyMag, 26 Mar. 2020, https://www.altenergymag.com/article/2020/03/what-is-the-safest-energy-for-the-future/32904.
“Death Rate Globally by Energy Source.” Statista, 17 Feb. 2023, https://www.statista.com/statistics/494425/death-rate-worldwide-by-energy-source.
“Nuclear Accidents Worldwide - Ines Scale.” Statista, 12 May 2011, https://www.statista.com/statistics/273002/the-biggest-nuclear-accidents-worldwide-rated-by-ines-scale/.
Ritchie, Hannah, et al. “Nuclear Energy.” Our World in Data, 27 Oct. 2022, https://ourworldindata.org/nuclear-energy.
“Safety of Nuclear Power Reactors.” Safety of Nuclear Reactors - World Nuclear Association, Mar. 2022, https://www.world-nuclear.org/information-library/safety-and-security/safety-of-plants/safety-of-nuclear-power-reactors.aspx.
Shellenberger, Michael. “Anti-Nuclear Group ELPC Defies Illinois EPA Finding That Illinois Nuclear Would Be Replaced ‘Mostly by Coal.’” Environmental Progress, Environmental Progress, 20 June 2016, https://rb.gy/bbqtc.
Wolf, Jared. “Nuclear Energy Is Better than Solar and Wind.” Sustainable Review, 6 Feb. 2023, https://sustainablereview.com/nuclear-energy-is-better-than-solar-and-wind.
0 notes
Text

Of the 30 articles that make up the Universal Declaration of Human Rights, Article 14, the right to seek asylum in other countries, stuck with me the most and provided my favorite compositional inspiration. I experimented with a few different concepts and layouts in my original design sketches (visible in the prior post) and decided a map was the design style I wanted to work with. My original sketch used Syria as a reference for the landscape and had a portrait orientation, but I switched to a landscape layout and used Turkey as the reference for my final design. Turkey is surrounded by both water and land, which was helpful for establishing a contrast between the browns and tans and the blues. Portraying the right and need to seek asylum with a map interested me; it’s a primarily geopolitical issue, so utilizing geographic visuals as a representation made sense. Maps are also a universally understood symbol. Everyone can look at a map and recognize it depicts relevant information about a particular location even if they don't know anything about the specific region. My poster successfully showcases how seeking asylum may not always be viable for people in need. The red outlines are a strict demarcation to prevent the exodus of potential refugees; they cannot flee their situations into the grayed-out countries as that option promised to them in the UDHR has not been provided.
I looked at a number of different maps during my research and decided early on that a more topographic style would be best for what I was trying to do; it would fill the negative space and create balance through the natural imbalance and variety of geological formations. The darker the shade indicates a higher elevation on land and the deeper floor in the seas. Different stroke widths also help differentiate and keep areas separate. The red lines are the thickest at 6pt to draw your eye, while the lines indicating country borders are 2pt and the lines separating elevation levels are .5pt.
I wanted to incorporate the text in a way that felt natural and included so the map design could fill the entire frame. I didn't want to include the text in a section that feels separate and takes up space that could be filled with the map itself. While researching, I found the way news segments include information blurbs to be a satisfactory method. Bahnschrift is a sans-serif typeface that is very legible, and since I used as little text as possible, going for a clear and readable font over something more ornate seemed like the best option. The added shadows help create a sense of depth and prevent the text boxes from feeling plastered over the map. I also slightly lowered the opacity of the text boxes so the map doesn't feel completely covered up, but the text is still very readable on the still predominantly opaque white section.
The various progress critiques we conducted helped me develop a more concrete idea of what I was creating. Feedback from my peers helped me refine the color scheme and get a more natural gradient, and also refine the text box implementation.
0 notes


Text
When I saw what piece I would recreate I knew immediately that I would be dealing with dozens upon dozens of layers. I was not intimidated but I knew the project would challenging, I have not used Photoshop for anything of this scale before and I had to get very familiar with a number of tools I had never previously used. The work was more tedious than difficult, there are so many different elements that all interact with each other in different ways, and managing a large amount of layers is still something I’m getting used to. The original piece was made as a lithographic print, transparent slides with different elements could be printed and rearranged as needed. The mechanical printing method creates a texture that cannot easily be replicated digitally. Certain gradients on the original became smoother in my reproduction as there is no physical surface to texture digital shapes. Photoshop also does not have very many default patterns available so I had to make my own, specifically for the various dot and diagonal line backgrounds. If I had more time or a better knowledge of filters I may have been able to emulate the press texture accurately, but overall I’m satisfied with how this project turned out and feel like I’ve gotten much more familiar with Photoshop.
0 notes
Text

The piece I will be recreating with Photoshop is a poster Wolfgang Weingart created for an exhibition at the Museum of Design, Zürich in 1981. Weingart was born in Germany in 1941 and is best known for pioneering the New Wave or Swiss Punk typographic styles, a response to the clean and orderly traditional Swiss styles some designers found excessively limiting. He attended the Merz Academy in Stuttgart at 17 where he first began experimenting with typesetting and block printing. Weingart preferred to work physically on his prints to ensure that he could respond swiftly to problems and preserve the telltale marks left by hand craftsmanship. The poster consists of numerous transparent lithographic slides layered on one another to create the collage. Repro cameras were also used to experiment with different fonts across standardized film templates.
Sources
Eskilson, Stephen J. Graphic Design: A New History. Yale University Press, 2019.
“Kunstgewerbemuseum Zürich – Schreibkunst.” Museum Für Gestaltung EGuide, https://www.eguide.ch/de/objekt/kunstgewerbemuseum-zuerich-schreibkunst/.
Weingart, Wolfgang. My Typography Instruction at the Basle School of Design, Switzerland, 1968 to 1985. Walker Art Center, 1985.
1 note
·
View note
Text
Intro v2
Hi, my name is Connor and I'm a senior at SUNY Brockport working towards a major in communications with a minor in graphic design. The minor was not added until recently and it has renewed my interest in actually creating rather than just consuming. I've since been attempting to develop my skills for more creative, less strictly academic purposes. I love reading manga, novels, and most other things, especially fantasy, sci-fi, and historical series, and have recently begun getting back into writing whenever I have time. I also enjoy the outdoors after camping frequently growing up. Hope to see you back.
0 notes
Text

I’m using my IDA poster to spread awareness about Housing First solutions to respond to the growing homelessness crisis in the United States. My design does successfully communicate the information using primarily graphic elements instead of text blocks, and by rendering large, difficult-to-comprehend statistics on a more fathomable human scale. For example, the figures of 17 million vacant homes and 600,000 homeless people in the United States will get people's attention, but large numbers can be abstract and difficult for humans to accurately interpret. A ratio of 30:1 is an accurate piece of distilled data, and the discrepancy can be instantly recognized, even by the most uninterested passersby. People won't have to linger and digest a lot of textual information, the graphics present statistics simply enough to be understood with very little engagement while still transmitting the essence of the problem. My design is recognizable as a top-down view of a city. The various light and dark blues represent buildings and roads respectively, with a deeper, less gray blue serving as a river bisecting the design. A couple of lighter greens represent the homeless and how their struggles can be utterly dwarfed by the enormity of urban environments, with pops of hot orange to break up the monotony of the cooler tones. All text included in the design is white to prioritize readability on the background and foreground shapes. There are no other white elements included, granting the text an exclusivity and unity. The only text not white is in the legend to better distinguish it from the rest of the information.
The details of Housing First use the largest text beside the title and statistics so your eyes will be directed to that information first. The hierarchy ensures that viewers will be guided to the definition before they read the policies to support information. Those sections are the only ones that should be read sequentially, the rest of the graphics can be viewed in whatever order the audience's eye travels. The research process made it clear to me that I wanted to work with a more environmental design rather than a traditional infographic layout. The information lends itself well to being presented within the city itself; homelessness is a crisis present in every American neighborhood, an internal problem that most people can comfortably ignore. The presentation method requires viewers to acknowledge individuals are struggling around every corner, including places they may interact with.
During our final critique, I got insight from my peers regarding multiple aspects of my design, one of which was the color scheme. I was aiming to emulate a birds-eye view of a city layout and was having trouble with the weight of the blue tones I was using. Originally the entire design consisted of mainly dark blues with oranges and greens to create a sharp contrast, but the heavy dark blues dominated the frame and did not adequately distinguish between the roads and buildings. I received advice to lighten the building's color and diversify the number of hues to better indicate the environment I wanted to emulate. Another suggestion was some rephrasing to better streamline the information and make it more concise. Prior to this project, I had no experience with Adobe Illustrator. I found the program basics to be very intuitive while offering a plethora of more advanced, nuanced options to master as my familiarity with Adobe increases. I still prefer the options InDesign gives you to better manipulate text, however, since my design was relatively light on large text boxes Illustrator was much more concise for incorporating and manipulating the actual graphics I created.
0 notes
Text
IDA process


Connor O’Keefe
The topic I will advocate for in this informational poster is the immediate implementation of Housing First solutions to end the homelessness crisis in American cities. Housing First is a process through which people currently experiencing homeless are provided with secure, long-term accommodations, and after this is accomplished there will be relief programs in place to provide aid regarding any other issues they may be facing, e.g., helping people find work if unemployed, dealing with addiction and other medical concerns, and financial management assistance.
The audience for my advocacy will be young adults and young millennials of voting age living in cities, between 18 and 30. This age range is targeted because they have the lowest turnout of voters throughout the country and can sway elections when they participate. Younger voters also tend to be more supportive of progressive policies and would be more likely to support this program. Homelessness has been on the rise for years in American cities, and legislators have not taken enough action to mitigate and offer solutions that actually help the people most in need. My infographic will contain relevant statistics regarding the homeless crisis in America (number of homeless vs. number of available homes, percentage of people that go unsheltered), a very brief explanation of Housing First policies with locations to find more information and solutions you can assist with, and steps local governments need to take to address homelessness directly. The display plan for the final poster graphic will be to place prints throughout urban areas, such as subways, bus stops, and waiting areas, i.e., any high-traffic areas.
I want the design to reflect the city environment, so I will include graphics of buildings and other structures to create the feeling of being within the overwhelming expanse of an urban area, and represent the significant discrepancies present in my research. A proportionately small tent graphic will stand in for the homeless, forgotten and minuscule compared to the vast concrete and metal behemoths. My font choices are intended to be clearly legible against the dark background, so I went with a variety of sans-serif typefaces. I will use Century Gothic Bold for my title, Corbel Bold for sub-headings, and Eras Demi ITC for my body text. I am aiming to create a more modern design that is attractive to the younger audience while maximizing readability. The primary background color will be a dark blue with bright orange and bright green hues to contrast; they will be used to create graphics that stand out sharply and emphasize the relevant text.
0 notes
Text
IDA Research
Addressing the Homeless Crisis with Housing First Solutions
Homelessness has been an increasing problem throughout the US, and the current go-to methods are hurting more than helping. Laws that criminalize homelessness by preventing sleeping in parks and other public places serve only to clog up the criminal justice system and bury vulnerable people under unreasonable fines they can’t pay without getting them the help they need.
The best long-term solution is housing first policies. Getting people into permanent housing first and then addressing their other concerns, including not limited to substance abuse, and finding employment opportunities. These policies are shown to be effective in reducing homelessness and are cheaper than the continued criminalization and incarceration of people more likely to be victims than aggressors.
Steps to be taken:
Removing police from situations involving the homeless and replacing them with social workers
Abolishing laws that criminalize homeless behavior (loitering, panhandling)
Prioritizing permanent stable low-income housing over temporary public shelters
Increase the availability of social services and remove any barriers that specifically prevent access by the homeless
Statistics
Over 580,000 people experience homelessness each night in the US (doesn't include precariously housed or temporarily housed individuals)
Out of every 10 people, 6 stayed in a shelter, 4 were unsheltered
Homelessness has been on the increase since 2016
Nowhere in the US can a full-time minimum wage job support a 2 bedroom apartment
Over 16 million homes in the US sit vacant and unused
Substance abuse and mental/physical disabilities are more common among the homeless than the general population
Minorities are disproportionately impacted by homelessness
Retention rate for housing first permanent housing is very high, 70-80%
Sources
2020, HFCM Final Outcomes Report 2020-Final, https://ui.charlotte.edu/sites/ui.charlotte.edu/files/media/HFCM%20Final%20Outcomes%20Report%202020-Final.pdf. Accessed 2022.
“Key Findings of 2020 Point-in-Time Count.” Key Findings of 2020 Point-in-Time Count | United States Interagency Council on Homelessness (USICH), 2021, https://www.usich.gov/tools-for-action/2020-point-in-time-count/.
Kolomatsky, Michael. “Vacant Homes Everywhere.” The New York Times, The New York Times, 10 Mar. 2022, https://www.nytimes.com/2022/03/10/realestate/vacancy-rate-by-state.html.
Olivet, USICH Executive Director Jeff. “COLLABORATE, DON’T CRIMINALIZE: HOW COMMUNITIES CAN EFFECTIVELY AND HUMANELY ADDRESS HOMELESSNESS.” United States Interagency Council on Homelessness (USICH), United States Interagency Council on Homelessness (USICH), 26 Oct. 2022, https://www.usich.gov/news/collaborate-dont-criminalize-how-communities-can-effectively-and-humanely-address-homelessness.
Schneider, Benjamin. “Why Is Homelessness Such a Problem in U.S. Cities?” Bloomberg.com, Bloomberg, 6 July 2020, https://www.bloomberg.com/news/features/2020-07-06/why-is-homelessness-such-a-problem-in-u-s-cities.
Simone , Jacquelyn. “State of the Homeless 2022.” Coalition For The Homeless, 2022, https://www.coalitionforthehomeless.org/state-of-the-homeless-2022/.
0 notes
Text
Max Miedinger Magazine Spread

Final spread for my typographer magazine project
What are you really proud of?
I'm proud of my design as a whole and how every element came together in the end. Throughout my planning and early workshopping I knew I wanted to emulate the geometric and clean style of Swiss graphic designers and I think it was successful. I'm especially satisfied with how his name turned out, it looks and acts more like an object than just text.
What worked well to create your design's organization and hierarchy?
I created a strong unity between the different elements and filled the page while not overwhelming the viewer. I wanted to utilize as much of the frame as possible without it being cluttered with stuff just to fill space.
What aspect of the program helped you execute your ideas?
Being able to view the print overview and get perspective about the final product The ability to extend elements outside the visible frame while keeping them intact was a godsend and made shifting things around much easier.
What Principles of Design is your spread successfully portraying?
Unity and contrast are two principles most prominently featured within my design. The splashes of red stand out sharply against the black and white, and only using a singular accent color makes the composition look coherent.
Do you feel like you grew as a designer during this process?
I absolutely do. Having never worked with InDesign I found it very intuitive and was never frustrated with features that didn't work how I wanted. I learned about the relationship between text and images, and incorporating them create interesting compositions that still prioritize legibility.
Name something you learned both technically and conceptually from your project?
I learned that not filling everything and leaving some negative space is important, it leaves room for each element to breath. I resisted the urge to insert more red highlights into the empty black areas but the space is important for separation and distinction between text.
Sources
“Font Design - Max Miedinger.” Translated by Lindsay J Munro, Font Design - Max Miedinger, https://mediengeschichte.dnb.de/DBSMZBN/Content/EN/FontDesign/05-miedinger-max-en.html.
“Max Miedinger.” Max Miedinger - Font Designer of Helvetica, https://www.linotype.com/fr/522/max-miedinger.html.
“Max Miedinger.” Max Miedinger, the Man, http://cis2.westerntc.edu/halee/type/the_man.html.
0 notes