
A study blog & journal for CIM 511 (Interactive Media Studio) & JMM 309 (Data Journalism)
Don't wanna be here? Send us removal request.
Statistics
We looked inside some of the posts by cymistletoe and here's what we found interesting.
Average Info
Notes Per Post
1
Likes Per Post
1
Reblog Per Post
0
Reply Per Post
0
Time Between Posts
5 days
Number of Posts By Type
Text
3
Last Seen Tumblr Blogs


Fun Fact
The Tumblr office adopted Tommy, an 11-year-old Pomeranian.
Text
JMM 309 Story Breakdown Week 3-4
“Live Maps: Tracking Hurricane Dorian’s Path”
by The New York Times
https://www.nytimes.com/interactive/2019/09/06/us/hurricane-dorian-path-map-track.html
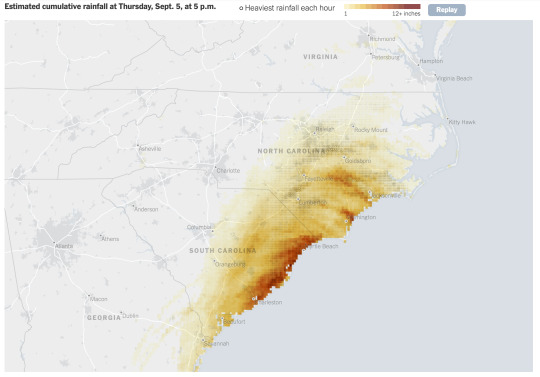
The article describes the track and extent of Hurricane Dorian over a week from the Bahamas to the Outer Banks of North Carolina and its impacts such as heavy rains, high winds, floods and storm surges on areas in its path. In particular, the authors detail the two most important aspects of the impact, storm surges and cumulative precipitation.
Here are the datasets used in the article:
The category and forecasted path of tropical storm
The area of reported hurricane winds, reported tropical-storm winds, and likely tropical-storm winds
Estimated storm surge flooding in impacted area
The composite animation of the storm’s movement over the past week (based on satellite imagery).
Estimated cumulative rainfall from Sept. 4 to Sept. 6
Potential storm paths from Aug. 26 to Sept. 8
Source: National Oceanic and Atmospheric Administration
In this article, data is central to the narrative. Using the track of Hurricane Dorian as a clue, the author applies a chart to show the intensity of Dorian changing with the movement of coordinates in different time periods. In particular, the authors pay close attention to the effects of Dorian on transit areas, such as the intensity distribution of storm surges.


In addition, the author uses very little text in the article. Charts and data account for 80% of the article. It is worth noting that the author applies dynamic graphs in the "Estimated Cumulative Rainfall" and "Potential Storm Paths". This gives the reader a clear and deep insight into the severe impact of Dorian's impact on the areas it passes through, which areas are most affected, and to what extent. In the "Potential Storm Paths", the author predicts Dorian's path in combination with official data to give the reader a preview of the future development of Dorian.


For the follow up to the story, I will be more interested in the areas and people affected by Dorian. I will investigate which areas in Dorian's path have been most affected (casualties and financial losses) and the causes (local government precautions and rescue efforts, distribution and construction of houses, people's awareness of what to do with the hurricane, etc.). I hope my story will not only inform readers about what can be done to prevent the hurricane, but also focus their attention on the needs and mental health of people affected by the storm.
0 notes
Text
JMM 309 Story Breakdown Week 1-2
“From 8,600 Flights to Zero: Grounding the Boeing 737 Max 8”
by The New York Times
https://www.nytimes.com/interactive/2019/03/11/world/boeing-737-max-which-airlines.html
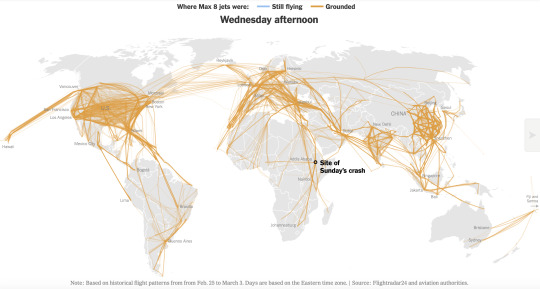
The article tells that Boeing 737 Max 8 has attracted the attention of airlines in many countries due to two crashes in five months. They grounded Max 8 for a short time and began an investigation into the cause of the accident. The article gives readers an idea of the worldwide distribution and number of Max 8 by showing the routes and countries where Max 8 is grounded.
Here are the datasets used in the article:
Boeing 737 Max 8's worldwide distribution of all routes and the date of suspension of Max 8
Countries that have grounded Max 8 planes
Status of Max 8 flights by airline as of March 13
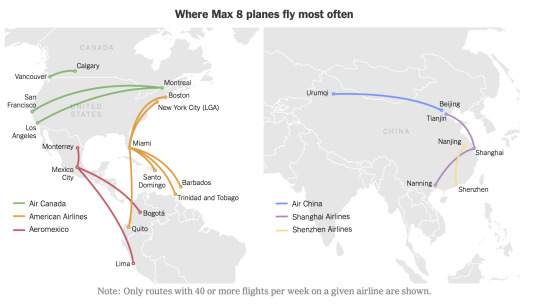
Where Max 8 planes fly most often
Source: The airlines, Flightradar24, OpenFlights Airports Database, International Air Transport Association, aviation authorities.
In this article, data is central to the narrative. The author used data to show the impact of two accidents on Boeing 737 Max 8 in a short period of time. For example, the first motion chart shows the process of grounding Max 8 in each country from Monday to Wednesday in different colors. Readers can quickly get a sense of where the Max 8 has been grounded around the world and how quickly airlines have responded. In particular, the author has marked the location of Sunday's accident on the map, which allows the reader to quickly compare the location of the accident with other routes.


Instead of reading too much into the data, the article summarizes some of the most important and obvious phenomena in the data. For example, in “Where Max 8 planes fly most often”, the author just use “The most popular routes are in North America and China” to summarize the key information in the chart. Obviously, the author wants to express more information that the chart cannot convey through words and less information that the chart can present through words.
If I were to write a follow-up story, I would be more interested in the causes of the frequent accidents in Max 8. Also, I might count the models that have had frequent accidents in recent years and their causes. Finally, I will compare these reasons with those of Max 8 to find some similarities. Beside, I'll look at how airlines and aircraft manufacturers in each country are handling the problem aircraft to see how they will handle the Max 8 differently than before.
0 notes
Text
Brainstorm Ideas for JMM 309 Semester Project
1. Why do college students become one of the fastest growing groups of AIDS in China in recent years?
Datasets:
From 2010 to 2020, the number of college students living with AIDS in China will be compared with the number of people living with AIDS in the whole country in the following aspects: number, proportion and growth rate
The causes of AIDS among college students.
Idea or topic:
College students are more likely to get AIDS due to changing attitudes and lack of sex education.
2. How prevalent is depression globally?
Datasets:
From 2010 to 2020, the number and location of depression worldwide.
The main causes of depression and their proportions.
The number of psychiatrists per 100,000 people. (by country)
Idea or topic:
Rates of depression are very high in poor and volatile countries. Preventing and treating depression requires physical and mental help for different reasons.
3. Spam text messages and calls on Chinese people’s phones.
Datasets:
The average number of spam text messages and phone calls per person per month, broken down by province.
What types of spam are the main types of spam people receive.
How much money spam brings to mobile operators each year.
Idea or topic:
To a certain extent, mobile operators indulge the abuse of spam text messages for profit, which leads to harassment in people's daily life.
4. The cost of divorce in different countries.
5. The dilemma of organ donation in China.
6. The cost of owning a dog in different countries.
7. The most popular emoji of recent years and the stories behind them.
8. The worldwide popularity of plastic surgery and the reasons behind it.
9. Why are so many children still abused in China?
10. Social stereotypes of female drivers reflect sexism.
11. Why is procrastination becoming more common?
12. How much has the Ice Bucket Challenge helped people with ALS?
1 note
·
View note