
Don't wanna be here? Send us removal request.
Statistics
We looked inside some of the posts by data-analysis-and-interpretation and here's what we found interesting.
Average Info
Notes Per Post
2
Likes Per Post
2
Reblog Per Post
0
Reply Per Post
0
Time Between Posts
10 days
Number of Posts By Type
Text
10
Last Seen Tumblr Blogs


Fun Fact
The Tumblr office adopted Tommy, an 11-year-old Pomeranian.
Text
Testing a Basic Linear Regression Model Assignment
My Program:

Program Output and Summary:
Mean of Life Expectancy(Explanatory variable): 68.758621.
HIV rates and Life Expectancy

The results of the linear regression model indicated that life expectancy (Beta=-0.2416, p<0.0001) was significantly and negatively associated with HIV rates.

The results of the linear regression model indicated that life expectancy (Beta=1.543, p<0.0001) was significantly and positively associated with breast cancer cases.
0 notes
Text
Writing About Your Data Assignment
Sample
The sample is a dataset from Gapminder, a non-profit venture promoting sustainable global development and achievement of the United Nations Millennium Development Goals. Gapminder seeks to increase the use and understanding of statistics about social, economic, and environmental development at local, national, and global levels. The sample contains data on countries that includes all 192 UN Members, aggregated data for Serbia and Montenegro, along with data for 19 other areas - which is a total of 213 countries.
Procedure
Data were collected from several sources, including, but not limited to, the Institute for Health Metrics and Evaulation, US Census Bureau’s International Database, United Nations Statistics Division, and the World Bank.
Measures
The data for the response variable breastcancerper100TH (i.e., the number of new cases of breast cancer in 100,000 female residents during the year 2002) was collected mainly from the IARC(International Agency for Research on Cancer). The data for the other response variable HIVrate (i.e, the estimated percentage of the population within age group 15-49 for the year 2009) was collected mainly from the UNAIDS online database. The data for the explanatory variable lifeexpectancy (i.e., the average number of years a newborn child would live if current, i.e., in the year 2011, mortality patterns were to stay the same) was collected mainly from the Human Mortality Database, World Population Prospects, Human Lifetable Database, and publications and files by history professor James C Riley.
Note, only 173 countries contained a value for breastcancerper100TH; only 147 countries contained a value for HIVrate; and only 191 countries contained a value for lifeexpectancy. Hence, I have aimed to exclude the missing values from any analysis I perform on the dataset. I also rounded the breastcancerper100TH and lifeexpectancy values to be positive integers, since lifeexpectancy represents a number of years and breastcancerper100TH represents a number of cases - and years and cases are usually considered as positive integers.
0 notes
Text
Testing a Potential Moderator Assignment
My Program:

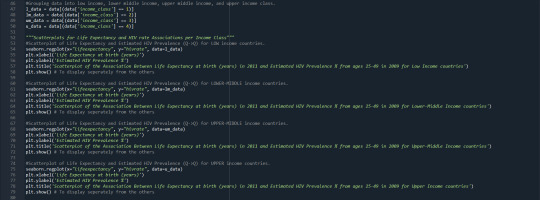


Program Output and Summary:
Pearson Correlation Test Results for life expectancy and HIV rate


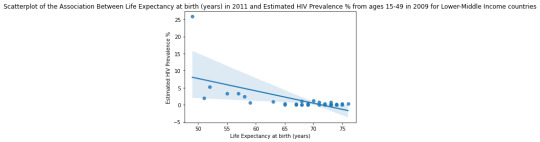
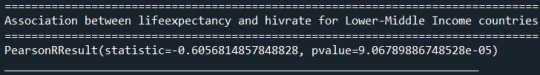

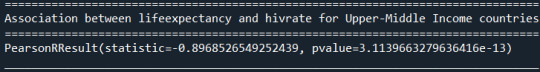
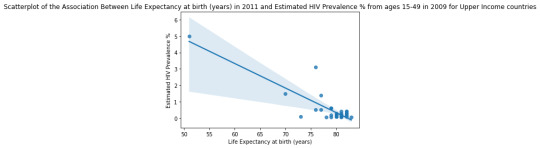

A Pearson Correlation test revealed associations between life expectancies and HIV rates that are statistically significant - 0.0005<p<3.12e-13 - and are moderately to substantially negative - -0.9<r< -0.55 - for countries of all income classes, which are clearly illustrated by the scatterplot graphs above.
Pearson Correlation Test Results for life expectancy and breast cancer cases


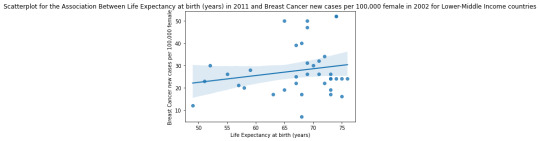


A Pearson Correlation test revealed an association between life expectancy and breast cancer cases that is statistically significant - p<0.0018<0.05 - and moderately positive - r<0.51 - for Upper Income countries, i.e., countries with 2010 Gross Domestic Product per capita in constant 2000 US$, greater than 8550.03. Associations for countries in other income classes were quite weak and statistically insignificant. All of these associations are clearly illustrated in the graphs above.
0 notes
Text
Generating a Correlation Coefficient Assignment
My Program:


Program Output and Summary:
Pearson Correlation Test Results for life expectancy and HIV rate
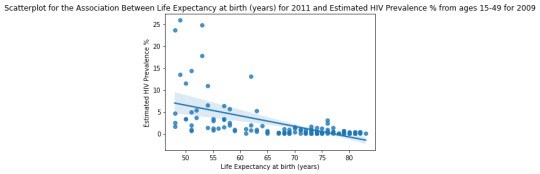

A Pearson Correlation test revealed an association between life expectancy and HIV rates that is statistically significant, p-value approx. 1.55e-13, and moderately negative, coefficient approx. -0.56, which is clearly illustrated by the scatterplot graph above.
Thus, knowing the life expectancy will help with predicting approx. 31 percent of the variability seen in HIV rates, coefficient squared is approx. 0.3177.
Pearson Correlation Test Results for life expectancy and breast cancer cases
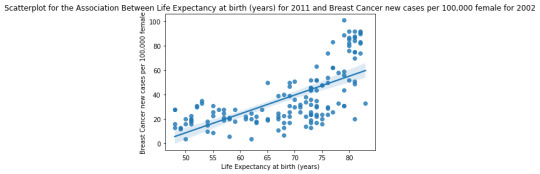

A Pearson Correlation test revealed an association between life expectancy and breast cancer cases that is statistically significant, p-value approx. 1.54e-19, and moderately positive, coefficient approx. 0.66, which is clearly illustrated by the scatterplot graph above.
Thus, knowing the life expectancy will help with predicting approx. 43 percent of the variability seen in breast cancer cases, coefficient squared is approx. 0.4364.
0 notes
Text
Running a Chi-Square Test of Independence Assignment
My Program:

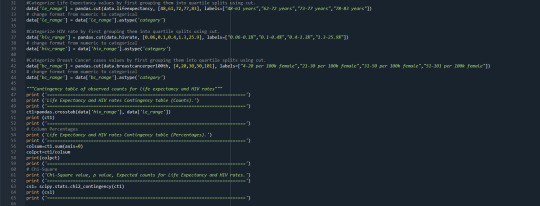


Program Output and Summary:
Chi-Square Test Results for life expectancy and HIV rate
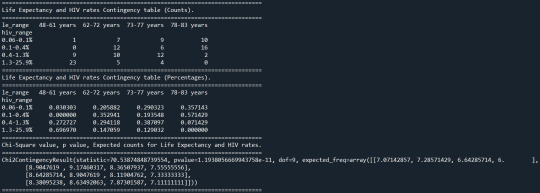
A Chi Square test of independence revealed that among the countries in the GAPMINDER Dataset, the life expectancy (the categorical explanatory variable, collapsed into 4 ordered categories) and the HIV rate ranges (the categorical response variable, collapsed into 4 ordered categories) were significantly associated, X2 = 70.53, 9 df, p = 1.19e-11.
Post-Hoc Chi-Square Test results for life expectancy and HIV rate
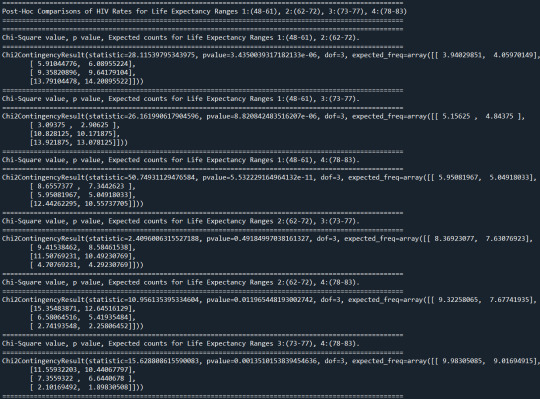
Post hoc comparisons of HIV rate ranges by pairs of life expectancy ranges revealed that prevalence of HIV was statistically similar among countries with 62-72 years life expectancy and countries with 73-77 years life expectancy. Prevalence of HIV rates was statistically different between all other life expectancy ranges. More specifically, higher HIV rate ranges were common for countries with lower life expectancy ranges.
Chi-Square Test Results for life expectancy and breast cancer cases

A Chi Square test of independence revealed that among the countries in the GAPMINDER Dataset, the life expectancy (the categorical explanatory variable) and the breast cancer case ranges (the categorical response variable, collapsed into 4 ordered categories) were significantly associated, X2 = 84.17, 9 df, p = 2.38e-14.
Post-Hoc Chi-Square Test results for life expectancy and breast cancer cases

Post hoc comparisons of breast cancer case ranges by pairs of life expectancy ranges revealed that lower breast cancer case ranges were significantly more common among countries within 48-61 year life expectancy range, than among countries within 73-77 year and 78-83 year life expectancy ranges. Post hoc comparisons also revealed that higher breast cancer case ranges were significantly more common among countries within 78-83 year life expectancy range, than among countries within 62-72 year and 73-77 year life expectancy ranges.
In contrast, prevalence of breast cancer was statistically similar between countries within 48-61 year and 62-72 year life expectancy ranges, as well as between countries within 62-72 year and 73-77 year life expectancy ranges.
0 notes
Text
Running an Analysis of Variance Assignment
My Program:

Program Output and Summary:
ANOVA and Post-Hoc ANOVA results for life expectancy and HIV rate
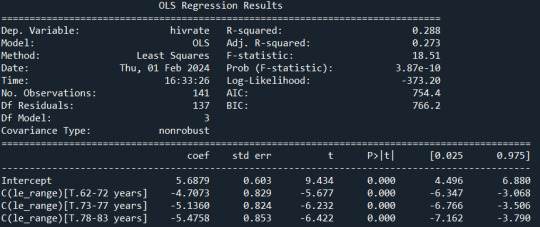


ANOVA revealed that among the countries in the GAPMINDER Dataset, the life expectancy (collapsed into 4 ordered categories, which is the categorical explanatory variable) and the HIV rate (quantitative response variable) were significantly associated, F(3, 137) = 18.51, p = 0.000000000387. Post hoc comparisons of mean HIV rates by pairs of life expectancy categories revealed that countries with a life expectancy within 48-61 years range had a significantly higher average HIV rate compared to the other age ranges (i.e., 62-72, 73-77, 78-83 years). All other comparisons were statistically similar.
ANOVA and Post-Hoc ANOVA results for life expectancy and breast cancer cases
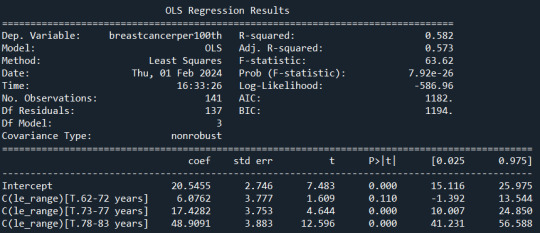
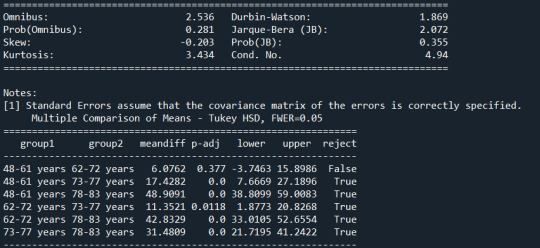
ANOVA revealed that among the countries in the GAPMINDER Dataset, the life expectancy (the categorical explanatory variable) and the breast cancer cases (quantitative response variable) were significantly associated, F(3, 137) = 63.62, p = 0.0000000000000000000000000792. Post hoc comparisons of mean breast cancer cases by pairs of life expectancy categories revealed that countries with life expectancy within 48-61 years range had an average breast cancer cases that was statistically similar to countries with life expectancy within 62-72 year range. All other comparisons were statistically significant. More specifically lower life expectancy year ranges had a significantly higher average breast cancer cases than higher life expectancy year ranges.
0 notes
Text
Creating Graphs For My Data Assignment
My Program:


Program Output and Summary:
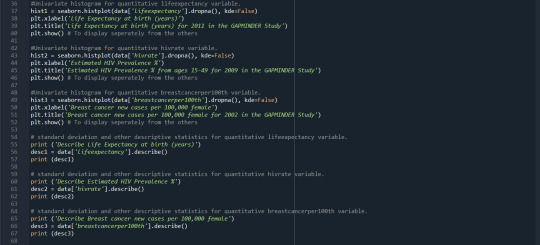
The Univariate Histogram and Descriptive Statistics for Life Expectancy

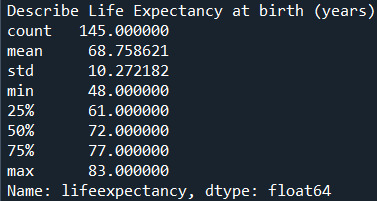
This graph is unimodal, with its highest peak being roughly between 70-75 years. It seems to be skewed to the left as there are higher frequencies in the higher age ranges. Based on the descriptive statistics, the center, i.e., mean, of this graph is just below 69 years and the spread, i.e., standard deviation, of the graph is slightly more than 10 years.
The Univariate Histogram and Descriptive Statistics for HIV Rate


This graph is unimodal, with its highest peak being roughly between 0-1%. It seems to be skewed to the right as there are higher frequencies in the lower percentage ranges. Based on the descriptive statistics, the center of this graph is just below 2%, and the spread is slightly above 4%.
The Univariate Histogram and Descriptive Statistics for Breast Cancer
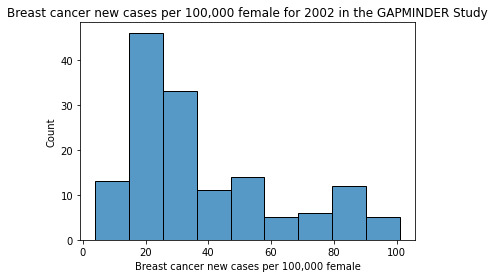

This graph is unimodal, with its highest peak being roughly between 15-25 cases. It seems to be skewed to the right as there are higher frequencies in the lower case ranges. Based on the descriptive statistics, the center of this graph is just below 38 cases, and the spread is just below 24 cases.
Scatterplots

The graph above plots the estimated HIV prevalence of a country to the country’s corresponding life expectancy. As displayed in the graph, there is a slightly negative or decreasing relationship between these variables; which sort of aligns with my initial hypothesis.

The graph above plots breast cancer cases per 100,000 female to the country’s corresponding life expectancy. As displayed in the graph, there is a fairly clear positive or increasing relationship between these variables; which aligns considerably well with my initial hypothesis.
1 note
·
View note
Text
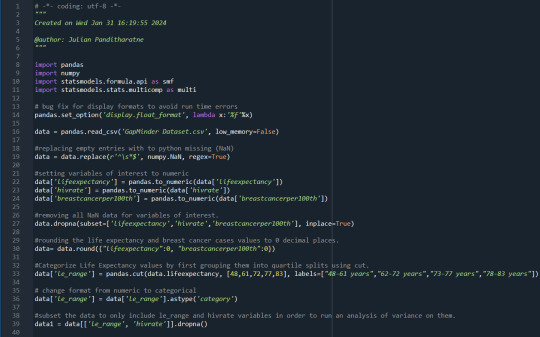
Making Data Management Decisions Assignment
1) My Program


2) Program Output


3) Summary
First data management decision I made was to focus only on countries that, at the very least, are not missing data for the lifeexpectancy variable. Next, I decided to categorize all the variables I am interested in - i.e., lifeexpectancy, hivrate, breastcancer per100th - since most of them initially had fairly uniform frequency distribution.
With these data management decisions made, it became clear that the life expectancy values for most countries are above 70. More specifically, 80 countries in the dataset have above 70 life expectancy, which slightly more than 55% of all the countries.
With regards to HIV rates, most countries have an HIV rate less than or equal to 0.5. More specifically, 82 countries in the dataset have an HIV rate less than or equal to 0.5, which is close to 57% of all the countries.
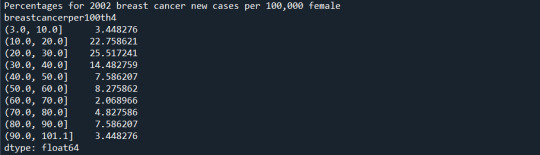
Lastly, the Breast Cancer cases for most countries is more than 20 but less than or equal to 30. More specifically, 37 countries have Breast Cancer cases within this range, which is approximately 25.5% of all the countries.
0 notes
Text
Running First Program Assignment
1) My Program
2) Output


3) Summary
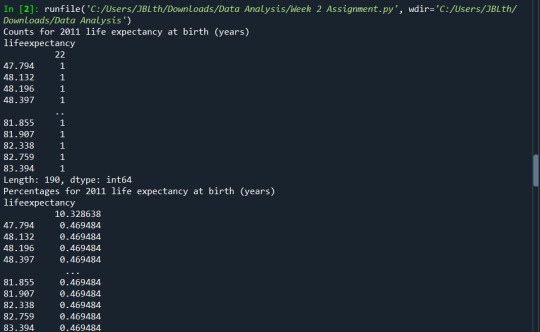
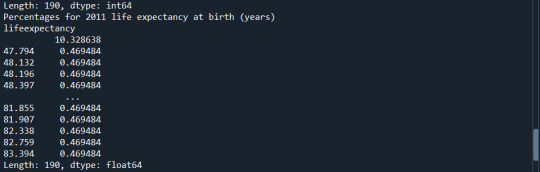
Life Expectancy:
22 countries have a missing life expectancy value, which is slightly more than 10% of all the countries in the dataset. The values that are not missing are all unique, i.e., each country has a unique life expectancy value.
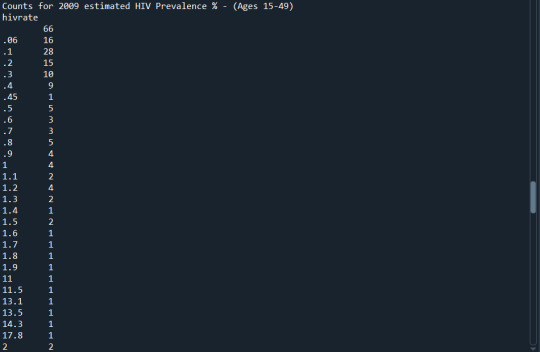
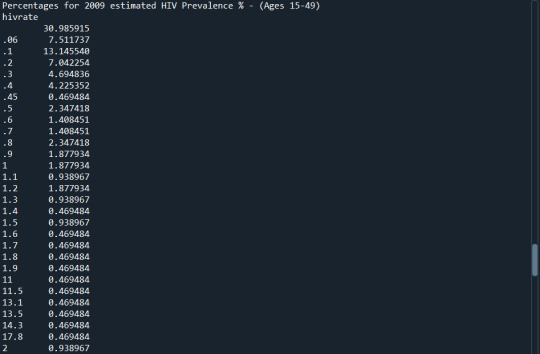
HIV rate:
66 countries have a missing HIV rate value, which is slightly less than 31% of all the countries in the dataset. The most common HIV rate, for countries that have one, is 0.1. 28 countries have an HIV rate of 0.1, which is slightly more than 13% of countries in the dataset.
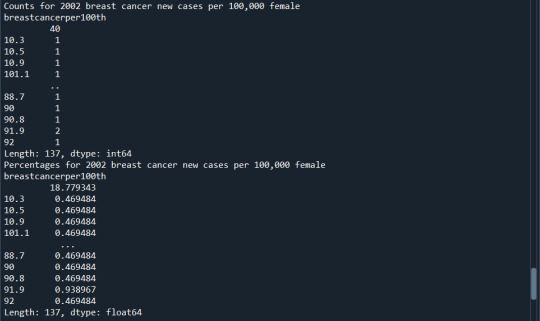
breast cancer per 100th:
40 countries have a missing breast cancer per 100th value, which is slightly less than 19% of all the countries in the dataset. The most common breast cancer per 100th value is 91.9, and only 2 countries have this value; the rest of the countries, that are not missing a value, have a unique breast cancer per 100th value.
0 notes
Text
Developing Research Question Assignment
After looking through the GapMinder Datasheet, I decided to focus on the life expectancy variable. Not all the countries listed have a value for this variable, so I will only include all the countries that have a life expectancy value in my personal codebook.
I presume that the cases of HIV and/or breast cancer in a country would most likely influence its mortality rates - which, in turn, would influence life expectancy. Thus, I am interested in figuring out what sort of associations are there between life expectancy and the HIV rates in countries, as well as between life expectancy and breast cancer cases in countries. Which is why I will also include the HIV rates and breast cancer cases for countries with a life expectancy value in my personal codebook.
Given that the life expectancy provided in the GapMinder datasheet is the 2011 life expectancy at birth, I decided to search for the mortality rates of breast cancer and HIV during 2011 as part of the literature review; which led me to the World Health Organization's Mortality Database. Within the database, I found the percentage of deaths caused by breast cancer out of total deaths for several countries during the year 2011; I found similar values for HIV as well. The highest percentage of deaths caused by breast cancer during 2011 was 3% in Barbados (World Health Organization, n.d.-a); and the highest percentage of deaths caused by HIV during 2011 was 6.4% in Belize (World Health Organization, n.d.-b). Thus, given these seemingly low percentages, I expect that the cases of HIV and breast cancer in a country would not have significant influence over the life expectancy of that country.
I also made the following search on Google Scholar: "association between life expectancy and hiv worldwide". This led me to the following journal article by Mansori et al. (2017). I conducted a similar search regarding breast cancer on Google Scholar as well, which led me to the following journal article by Ghoncheh, Mirzaei, and Salehiniya (2016). According to Ghoncheh, Mirzaei, and Salehiniya's research, countries with higher Human Development Index(i.e., HDI) have higher incidences of breast cancer than countries with lower HDI (2016, p.8442). Given that life expectancy is one of the components of HDI (Ghoncheh, Mirzaei, & Salehiniya, 2016, p.8439), I expect countries with higher life expectancy would have higher incidences of breast cancer than countries with lower life expectancy. On the other hand, the research by Mansori et al. suggests that incidence rates of HIV were higher in lower HDI countries than in higher HDI countries (2017, Discussion section, paragraph 5). Thus, I expect countries with lower life expectancy would have higher HIV incidence rates.
Therefore, based on my literature review, I hypothesize that higher life expectancy would be strongly associated with higher breast cancer cases, whereas, lower life expectancy would be strongly associated with higher HIV rates.
References
Ghoncheh, M., Mirzaei, M., & Salehiniya, H. (2016). Incidence and mortality of breast cancer and their relationship with the human development index (HDI) in the world in 2012. Asian Pacific Journal of Cancer Prevention, 16(18), 8439–8443. Google Scholar. https://doi.org/10.7314/apjcp.2015.16.18.8439
Mansori, K., Ayubi, E., Shadmani, F. K., Hanis, S. M., Khazaei, S., Sani, M., … Mohammadbeigi, A. (2017). Estimates of global HIV/AIDS mortality, prevalence and incidence rates, and their association with the human development index. Biomedical Research and Therapy, 4(06), 1400–1410. https://doi.org/10.15419/bmrat.v4i06.181
World Health Organization. (n.d.-a). Breast cancer. Retrieved January 5, 2024, from WHO Mortality Database website: https://platform.who.int/mortality/themes/theme-details/topics/indicator-groups/indicator-group-details/MDB/breast-cancer
World Health Organization. (n.d.-b). HIV/AIDS. Retrieved January 5, 2024, from WHO Mortality Database website: https://platform.who.int/mortality/themes/theme-details/topics/indicator-groups/indicator-group-details/MDB/hiv-aids
1 note
·
View note