
Don't wanna be here? Send us removal request.
Statistics
We looked inside some of the posts by datanerd and here's what we found interesting.
Average Info
Notes Per Post
1
Likes Per Post
1
Reblog Per Post
0
Reply Per Post
0
Time Between Posts
5 days
Number of Posts By Type
Text
3
Last Seen Tumblr Blogs


Fun Fact
The “We are the 99%” Tumblr blog became the slogan for the Occupy Wall Street movement.
Text
Manipulating Data to analyse the relation between CO2 emissions and Internet Usage
In the previous blog entry (https://datanerd.tumblr.com/post/656693290286120960/a-first-review-about-the-correlation-between) the dataset for Gapminder was explore to look about the relation between CO2 emissions and Internet Usage in countries. However, it was an exploratory analysis considering all the data. Thus results in a mistmatching of datasets for analysis and also presents problem in the statistical analysis. For this reason, a preprocessing excersive was made to get better results. In such case, the NaN values were removed and also the big outliers trying to normalize the dataset. Figure 1 shows the Python program used.

Then, the new frecuency distribution for the CO2 emissions is shown in table 1. Table 1. C02 Emmisions per Country GapMinder Dataset.

In the same way, the distribution for intenet usage is shown in table 2.
Table 2. Internet user per every 100 people per country.

Table 3. Income per person per country.

The GapMinder dataset offers information compile until 2010. After the preprocessing of the data, was possible to see that all the three variables has the same amount of samples. This allows to get for futher analysis. Also, the distribution wer normalized to deduce better conclusions. For example, for Table 1, the first range of data corresponds to the 80% of the countries. Meanwhile, in the previous exercise this values corresponds to the 99% of the data.
0 notes
Text
A first review about the correlation between internet usage and CO2 emmisions
As it was exposed in the previous blog entry: https://datanerd.tumblr.com/post/655895678054187008/how-can-the-internet-usage-has-a-impact-in-the-co2, the aim is to analyze the impact for internet usage in the CO2 emmisions To this, a Python program was made. Figure 1 shows part of the code

Figure 1. Python program The frecuency distribution for the CO2 emissions is shown in table 1. Table 1. C02 Emmisions per Country GapMinder Dataset.

In the same way, the distribution for intenet usage is shown in table 2. Table 2. Internet user per every 100 people per country.
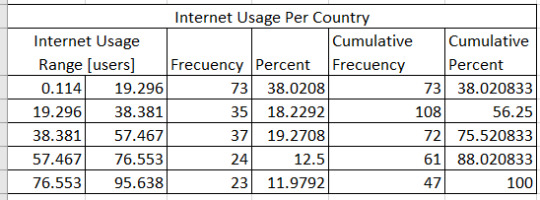
Table 3. Income per person per country.

The GapMinder dataset offers information compile until 2010. In Table 1, the outliers corresponds to USA (in a range of 2.67e+11-3.34e+11) and UK (6.68e+10-1.34e+11). The 99% of the countries are in the first range for CO2 emmisions. Regarding the second question about the internet usage, the distribution is more uniform. The biggest group of internet usage is for countries that reports between 0 and 20 active user per every 100 people (about 38%). About 11.97% of the countries reports the biggest access to internet. A similar trend than CO2 emissions is shown in the Income per person for analysis. About 85% of the data is grouped in the less income range. And about 0.5% and 0.5% corresponds to the bigger income ranges (Monaco and Liechtenstein respectively).
0 notes
Text
How can the internet usage has a impact in the CO2 consumption?
In a connected and digitalized world, it is unimaginable to think about ourselves without the internet. The possibility to connect with only one click offers us thousands of possibilities. On the other hand, it is known that every action that humans do has an environmental impact on our planet. In that sense, several authors analyzed the impact that internet usage can have on CO2 emissions. Salahuddin et all, 2016 [1] describe an analysis of the data for OCDE countries from 1992 to 2012. There was a link between these two factors. However, there was not a causal link between them.
The situation does not differ in emerging countries, as it is exposed by Ozcan et all, 2018 [2]. Good connections mean good infrastructure, and for that, it is necessary to bring more services such as electricity, distribution networks, hardware equipment. Those situations are explained in more detail in the work of Salahuddin et all, 2016 [3] and Gombiner, 2011 [4]. With that, there is possible to conclude that there is a link between internet usage and CO2 emissions, but how much? Is it the same for all the countries? Are there special cases when is the situation reversed? Can be the internet helps to compensate for the CO2 Emissions?
To explain this, the present work will analyze the data set presented by gapminder.org for explaining this phenomenon. Stay tuned for a future post to observe the results.
References [1] SALAHUDDIN, Mohammad; ALAM, Khorshed; OZTURK, Ilhan. The effects of Internet usage and economic growth on CO2 emissions in OECD countries: A panel investigation. Renewable and Sustainable Energy Reviews, 2016, vol. 62, p. 1226-1235. [2] OZCAN, Burcu; APERGIS, Nicholas. The impact of internet use on air pollution: evidence from emerging countries. Environmental Science and Pollution Research, 2018, vol. 25, no 5, p. 4174-4189. [3] SALAHUDDIN, Mohammad; ALAM, Khorshed; OZTURK, Ilhan. Is rapid growth in Internet usage environmentally sustainable for Australia? An empirical investigation. Environmental Science and Pollution Research, 2016, vol. 23, no 5, p. 4700-4713. [4] GOMBINER, Joel. Carbon footprinting the internet. Consilience, 2011, no 5, p. 119-124. [5] SINHA, Avik. Impact of ICT exports and internet usage on carbon emissions: a case of OECD countries. International Journal of Green Economics, 2018, vol. 12, no 3-4, p. 228-257.
1 note
·
View note