
Don't wanna be here? Send us removal request.
Statistics
We looked inside some of the posts by datascience-2023 and here's what we found interesting.
Average Info
Notes Per Post
3
Likes Per Post
3
Reblog Per Post
0
Reply Per Post
0
Time Between Posts
5 days
Number of Posts By Type
Text
4
Last Seen Tumblr Blogs


Fun Fact
Tumblr Inc. has $15.1M in annual revenue.
Text
Creating Graphs Week 4
Univariate Graph
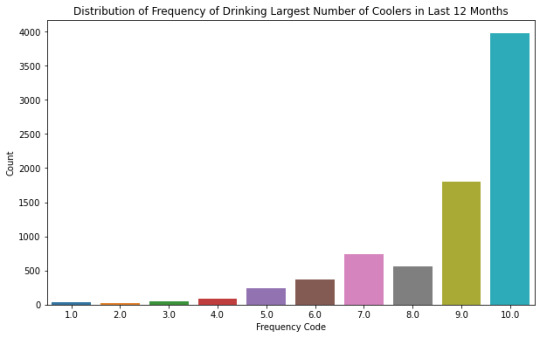
Univariate Graph: A graph was plotted to visualize the relationship between alcohol consumption over the last 12 months and dependence.
Visualization Insights: The graph indicates a strong relationship between these variables, though the exact form (e.g., linear, exponential) is not detailed in the provided information.
Conclusion:
Significant Relationship: The visualization reveals a strong association between the consumption of alcohol over the course of a year and the level of dependence. This insight could have substantial implications for understanding alcohol-related behaviors and risks.
Future Analysis: The observed relationship might lead to further investigations to identify causal factors or to develop predictive models. It could also guide interventions or policies aimed at addressing alcohol dependence.
Bivariate graph
The dataset consists of 43,093 observations and 3,010 variables. Specific variables were converted to numeric and analyzed, with the following key variables:
S2AQ1: Consisting of two categories, with 82.6% in category 1.
S2AQ2: Three categories, distributed as 51.6% in category 2, 48.4% in category 1, and a negligible percentage in category 9.
S2AQ3: Three categories, with a majority in category 1 (62.5%).
S2AQ4A: Mostly in category 2.0, with 70.5%.
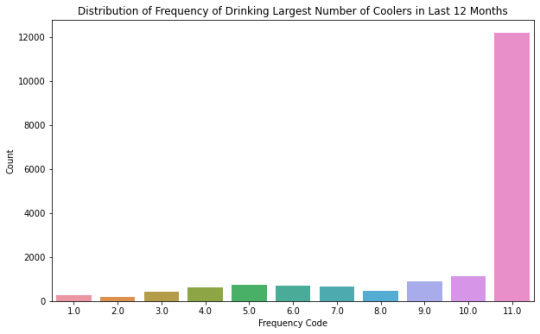
S2AQ4B: Eleven categories, with the largest percentage (33.3%) in category 10.0.
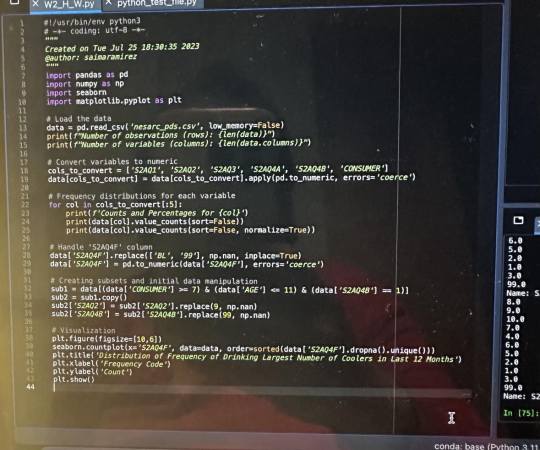
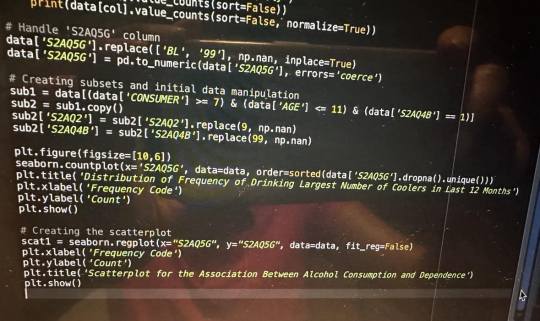
2. Data Visualization: The code includes the creation of a bar plot to visualize the distribution of drinking frequency and a scatter plot to explore relationships between specific variables.
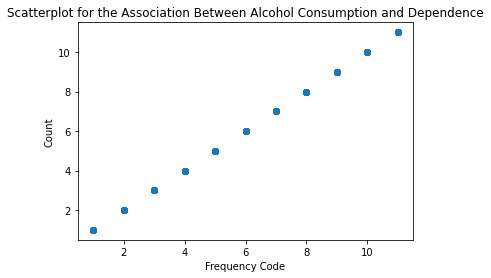
3. Scatter Plot Interpretation: The scatter plot shows a positive relationship between the independent and dependent variables. This means that an increase in the independent variable is associated with an increase in the dependent variable.
Implications: Depending on the context (e.g., if the variables represent alcohol consumption and dependence), the positive relationship might indicate that higher frequency leads to increased effects such as dependence.
Further Analysis: This initial observation should be investigated further with rigorous statistical methods to ascertain causality.
4. Conclusion: The analysis provided an overview of specific variables related to alcohol consumption and created visualizations to understand their distributions and relationships. The positive relationship observed in the scatter plot warrants further investigation to understand underlying patterns and causality. By conducting more in-depth analysis, valuable insights can be extracted to inform decision-making in areas such as public health or policy regarding alcohol consumption.
0 notes
Text
Week 3 HW Making Data Management Decisions
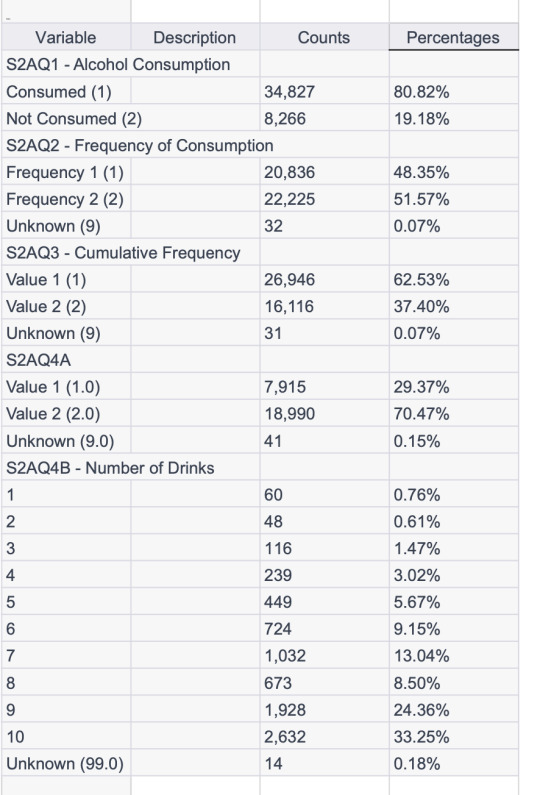
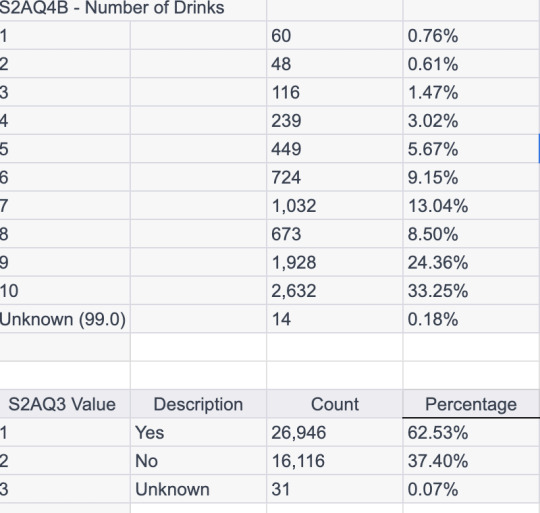
Table 1
S2AQ1: This variable seems to represent whether alcohol is consumed or not. With two categories, 1 for consumption and 2 for non-consumption.
S2AQ2: This variable could represent the frequency of alcohol consumption. 1 might represent a certain frequency, 2 another, and 9 an unknown or missing value.
S2AQ3: Represents another aspect related to alcohol consumption, possibly related to cumulative frequency.
S2AQ4A: Represents a different measure, possibly related to the quantity of alcohol consumed.
S2AQ4B: Represents multiple categories possibly related to the type or amount of drinks.
Table 2
This table presents the counts and percentages for each category of the 'S2AQ3' variable, which represents whether a respondent drank at least one alcoholic drink in the last 12 months. The 'Yes' category contains the majority of the responses, followed by the 'No' category, with 'Unknown' responses making up a very small percentage.
Table 3
The 'S2AQ4B' column represents the frequency of drinking coolers in the last 12 months, while the 'Percentage' column shows the percentage of people in each category. The rows are ordered by the frequency of drinking coolers.
Top of Form
0 notes
Text
Running my First program in Python.
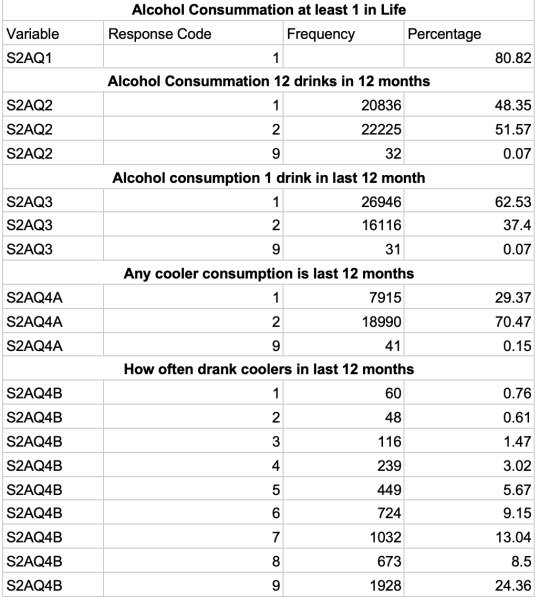
A random sample of 34827 of adults were asked the following question, “Did they drink 1 alcohol drink in life” Of the total number, about 80%, fell into category 1 (yes). While 20% of the adults fall into category 2(No)
For the next question, the people were asked “If they drank at least 12 drinks in 12 months”. About 48.35% fall into category 1 (yes), while 51.57% fall into category 2(No) and 0.07% were unknown.
The 'Response Code' column represents the different possible answers to the questions represented by each variable. The 'Frequency' column represents the number of times each response was given, and the 'Percentage' column represents what proportion of the total responses each response represents.
0 notes
Text
Developing a Research question and creating personal codebook. Week 1 Homework
Upon reviewing the codebook for the NESARC study, my focus is primarily on alcohol abuse. I plan to utilize several variables, including the frequency and intensity of alcohol consumption, demographic factors, and lifestyle factors. Additionally, I intend to incorporate all relevant variables into my personal codebook for this research. I have printed following pages, 30,46,77, 125, 299, 316 so far and will print more as needed.
My topic is, “Association between alcohol abuse and chronic depression.”
While alcohol abuse serves as a solid initial focus, I recognize the necessity of clarifying my specific interests within this domain. After careful consideration, I find myself particularly intrigued by the relationship between the amount of alcohol consumed and the development of alcohol dependence. To facilitate this exploration, I augment my codebook to include variables that capture alcohol levels, such as frequency and intensity of alcohol consumption, as well as quantity and frequency. My second topic of interest revolves around the question, "What is the threshold at which a person becomes alcohol dependent?"
The article, “Alcohol consumption and major depression in the general population: the critical importance of dependence” emphasizes on the relationship between alcohol consumption and major depression. It is based on a longitudinal study of a large population cohort in Canada over 12 years. It evaluates different patterns of alcohol use and major depressive episodes (MDEs) using the Composite International Diagnostic Interview Short Form (CIDI-SF). The study found that respondents with alcohol dependence were at higher risk of MDE, but any alcohol consumption, exceeding guidelines for moderate drinking and binge drinking were not Respondents with MDE showed no increase of alcohol consumption, but the risk of alcohol dependence was elevated in depressed men.
The second article titled "Gender Differences in the Relation between Depressive Symptoms and Alcohol Problems: A Longitudinal Perspective" investigates the longitudinal relationship between depressive symptoms and alcohol problems, specifically focusing on gender differences. The study aims to clarify and extend previous research by examining whether depressive symptoms predict subsequent alcohol problems for females, while alcohol problems predict subsequent depressive symptoms for males. Overall, the study adds to the existing literature on the comorbidity of depression and alcohol problems and underscores the significance of considering gender-specific factors in understanding these relationships. It encourages further research in this domain to provide more comprehensive insights into the dynamic interplay between depressive symptoms and alcohol problems over time.
References:
Bulloch, A., Lavorato, D., Williams, J. & Patten, S. (2012). Alcohol consumption and major depression in the general population: the critical importance of dependence. Depress Anxiety, 29(12), 1058. 10.1002/da.22001.
Moscato, B. S., Russell, M., Zielezny, M., Bromet, E., Egri, G., Mudar, P., & Marshall, J. R. (1997). Gender Differences in the Relation between Depressive Symptoms and Alcohol Problems: A Longitudinal Perspective. American Journal of Epidemiology, 146(11), 966-974.
There is a positive association between alcohol abuse and chronic depression. Individuals who engage in higher levels of alcohol abuse, as indicated by increased frequency and intensity of alcohol consumption, are more likely to experience chronic depression compared to those with lower levels of alcohol abuse.
3 notes
·
View notes