
Don't wanna be here? Send us removal request.
Statistics
We looked inside some of the posts by datascienceprojects-blog and here's what we found interesting.
Average Info
Notes Per Post
0
Likes Per Post
0
Reblog Per Post
0
Reply Per Post
0
Time Between Posts
4 months
Number of Posts By Type
Text
5
Last Seen Tumblr Blogs


Fun Fact
Tumblr’s website traffic is steadily declining.
Text
Logistic Regression Model
Introduction
A Logistic Regression Model to establish any relationship between Anti-Social Behavioural Disorder and drug (Cannabis) dependence. Another logistic model between Anti-Social Behavioural Disorder after controlling for Alcohol abuse and a history of family alcoholism.
This submission is split into the following sections:
Hypotheses
Data
Methodology
Results
Summary
Output from Code (Appendix I)
Code (Appendix II)
Hypothesis
Null Hypothesis:
There is no significant association between Anti-Social Behavioural Disorder and Drug Dependence.
Alternate Hypothesis
There is a significant association between Anti-Social Behavioural Disorder and Drug dependence.
Data
The as subset of NESARC data was used from the following sections:
ANTISOCIAL PERSONALITY DISORDER (BEHAVIOR
CANNABIS ABUSE/DEPENDENCE
ALCOHOL ABUSE/DEPENDENCE
FAMILY HISTORY (I) OF ALCOHOLISM
FAMILY HISTORY (II) OF DRUG ABUSE
Response Variable - The response variable, ANTISOC, is binary and denotes the presence (yes), coded 1 or the absence, (No), coded 0 of Anti-Social Personality Disorder .
Exploratory Variables - are all also binary and include:
DRUGDEP - a Yes indicated cannabis abuse and dependence in both the past 12 months and prior to the last 12 months was coded 1 for the presence of drug dependence, No was coded 0 for its absence.
FAMDRUGDEP - Yes was coded 1 for the presence of family drug abuse while No, was coded 0 for its absence.
ALCHABUS - Yes was coded 1 for the presence of Alcohol Abuse and No, was coded 0 for its absence.
FAMALCSM - Yes was coded 1 for the presence of Family History of Alcohol Abuse and No was coded 0 for its absence.
Methodology
A Logit Regression was performed using the logit formula from Python’s Stats Model API and the output examined for association, significance, confounders and the confidence interval established via odds ratios.
Results
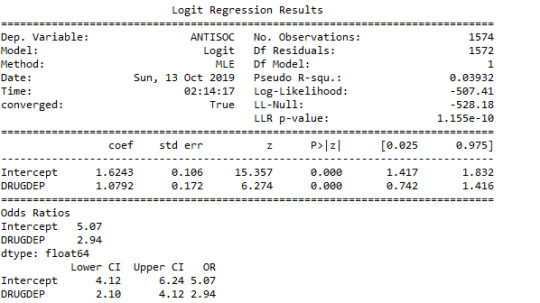
The sample size was 1574 and the regression between Antisocial Behaviour and Drug Dependence was significant with a P-value of less than 0.0001.
It was established that Anti-Social Behaviour was positively associated with drug dependence as and the odds ratio between those who have Anti Social Behaviour and those who were drug dependent was 2.94 meaning that the probability of having Anti Social Behaviour increased with subjects having drug dependence and subjects in the sample with Drug Dependence were 2,94 times likely to have Anti-Social behavioural problems than those subjects without drug dependence.
The odds ratio indicated a 95% certainty that the true population odds ratio falls between 2.1 and 4.12.
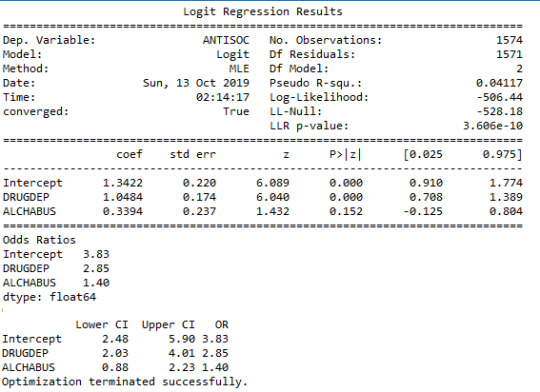
Both Drug Abuse and Alcohol Abuse were found to be positively associated with the likelihood of Anti-social behaviour. And the results suggested that subjects with Drug Dependence in the sample were 2.9 times more likely to have Anti-Social Behaviour disorders after controlling for Alcohol abuse.
Similarly Subjects with Alcohol Abuse were approximately 1.4 times more likely to have Anti-Social Behaviour disorders after controlling for Drug Dependence.
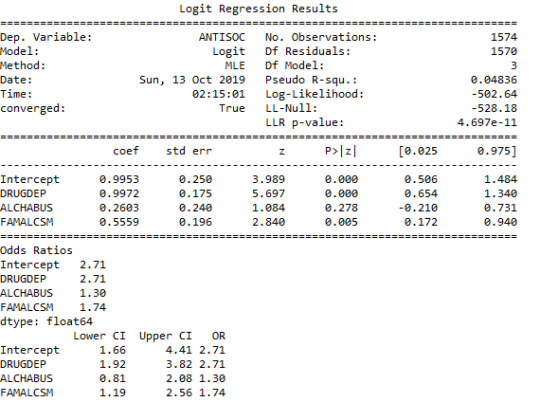
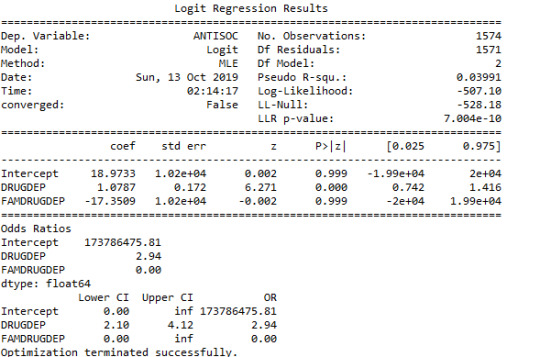
When a history of Family Alcoholism or a history of Family Drug Dependence was added to the model, there were no changes in the significant positive association between Anti-Social Behaviour and Drug Dependence after controlling for Alcohol Abuse. This suggested that a history of family alcohol abuse or family history of drug abuse were not established as confounders of the relationship between anti-social behaviour disorder and drug abuse.
Summary
A logit regression was performed on NESARC data, to investigate the association between drug (marijuana) dependence and Anti-Social Behaviour Disorder, when alcohol abuse and family histories of drug and alcohol abuse were taken into account . The results from analysis of the sample data showed that marijuana dependence and abuse was positively and significantly associated with incidence of anti-social behaviour disorder. While it was deduced that alcohol abuse was positively associated with anti-social behaviour disorder, this was not found to be significant. Family histories of drug and alcohol dependence were not established as confounders.
Appendix I
Output From Logit Regession
Appendix II
Code
import numpy import pandas import statsmodels.api as sm import seaborn import statsmodels.formula.api as smf
# bug fix for display formats to avoid run time errors pandas.set_option('display.float_format', lambda x:'%.2f'%x)
data = pandas.read_csv('C:\\...\\nesarc.csv', low_memory=False)
############################################################################## # DATA MANAGEMENT ##############################################################################
#setting variables to numeric data['IDNUM'] =pandas.to_numeric(data['IDNUM'], errors='coerce') data['TAB12MDX'] = pandas.to_numeric(data['TAB12MDX'], errors='coerce') data['S3AQ3C1'] = pandas.to_numeric(data['S3AQ3C1'], errors='coerce') data['S3BQ3'] = pandas.to_numeric(data['S3BQ3'], errors='coerce') data['AGE'] =pandas.to_numeric(data['AGE'], errors='coerce') data['SEX'] = pandas.to_numeric(data['SEX'], errors='coerce') data['MAR12ABDEP'] = pandas.to_numeric(data['MAR12ABDEP'], errors='coerce') data['MARP12ABDEP'] = pandas.to_numeric(data['MARP12ABDEP'], errors='coerce') data['S3BD5Q2C'] = pandas.to_numeric(data['S3BD5Q2C'], errors='coerce') data['S3BD5Q2E'] = pandas.to_numeric(data['S3BD5Q2E'], errors='coerce') data['S3BQ1A5'] = pandas.to_numeric(data['S3BQ1A5'], errors='coerce') data['S3AQ3C1']=data['S3AQ3C1'].replace(99, numpy.nan) data['S3BQ3']=data['S3BQ3'].replace(99, numpy.nan)
#Family Alchholism data['S2DQ1'] = pandas.to_numeric(data['S2DQ1'], errors='coerce') data['S2DQ2'] = pandas.to_numeric(data['S2DQ2'], errors='coerce') data['S2DQ3C2'] = pandas.to_numeric(data['S2DQ3C2'], errors='coerce') data['S2DQ4C2'] = pandas.to_numeric(data['S2DQ4C2'], errors='coerce') data['S2DQ5C2'] = pandas.to_numeric(data['S2DQ5C2'], errors='coerce') data['S2DQ6C2'] = pandas.to_numeric(data['S2DQ6C2'], errors='coerce') data['S2DQ7C2'] = pandas.to_numeric(data['S2DQ7C2'], errors='coerce') data['S2DQ8C2'] = pandas.to_numeric(data['S2DQ8C2'], errors='coerce') data['S2DQ9C2'] = pandas.to_numeric(data['S2DQ9C2'], errors='coerce') data['S2DQ10C2'] = pandas.to_numeric(data['S2DQ10C2'], errors='coerce') data['S2DQ11'] = pandas.to_numeric(data['S2DQ11'], errors='coerce') data['S2DQ12'] = pandas.to_numeric(data['S2DQ12'], errors='coerce') data['S2DQ13A'] = pandas.to_numeric(data['S2DQ13A'], errors='coerce') data['S2DQ13B'] = pandas.to_numeric(data['S2DQ13B'], errors='coerce') data['S2DQ14A'] = pandas.to_numeric(data['S2DQ14A'], errors='coerce') data['S2DQ14B'] = pandas.to_numeric(data['S2DQ14B'], errors='coerce') data['S2DQ15'] = pandas.to_numeric(data['S2DQ15'], errors='coerce') data['S2DQ16'] = pandas.to_numeric(data['S2DQ16'], errors='coerce') data['S2DQ17'] = pandas.to_numeric(data['S2DQ17'], errors='coerce') data['S2DQ18'] = pandas.to_numeric(data['S2DQ18'], errors='coerce') data['S2DQ19'] = pandas.to_numeric(data['S2DQ19'], errors='coerce') data['S2DQ21'] = pandas.to_numeric(data['S2DQ21'], errors='coerce')
#Alcohol Abuse data['S2BQ1A3']= pandas.to_numeric(data['S2BQ1A3'], errors='coerce') data['S2BQ1A4']= pandas.to_numeric(data['S2BQ1A4'], errors='coerce') data['S2BQ1A5']= pandas.to_numeric(data['S2BQ1A5'], errors='coerce') data['S2BQ1A6']= pandas.to_numeric(data['S2BQ1A6'], errors='coerce') data['S2BQ1A7']= pandas.to_numeric(data['S2BQ1A7'], errors='coerce') data['S2BQ1A8']= pandas.to_numeric(data['S2BQ1A8'], errors='coerce') data['S2BQ1A9A']= pandas.to_numeric(data['S2BQ1A9A'], errors='coerce') data['S2BQ1A9B']= pandas.to_numeric(data['S2BQ1A9B'], errors='coerce') data['S2BQ1A9C']= pandas.to_numeric(data['S2BQ1A9C'], errors='coerce') data['S2BQ1A9D']= pandas.to_numeric(data['S2BQ1A9D'], errors='coerce') data['S2BQ1A9E']= pandas.to_numeric(data['S2BQ1A9E'], errors='coerce') data['S2BQ1A9F']= pandas.to_numeric(data['S2BQ1A9F'], errors='coerce') data['S2BQ1A9G']= pandas.to_numeric(data['S2BQ1A9G'], errors='coerce') data['S2BQ1A9H']= pandas.to_numeric(data['S2BQ1A9H'], errors='coerce') data['S2BQ1A9I']= pandas.to_numeric(data['S2BQ1A9I'], errors='coerce') data['S2BQ1B9J']= pandas.to_numeric(data['S2BQ1B9J'], errors='coerce') data['S2BQ1C9K']= pandas.to_numeric(data['S2BQ1C9K'], errors='coerce') data['S2BQ1A10']= pandas.to_numeric(data['S2BQ1A10'], errors='coerce') data['S2BQ1A11']= pandas.to_numeric(data['S2BQ1A11'], errors='coerce') data['S2BQ1A12']= pandas.to_numeric(data['S2BQ1A12'], errors='coerce') data['S2BQ1A13']= pandas.to_numeric(data['S2BQ1A13'], errors='coerce') data['S2BQ1A14']= pandas.to_numeric(data['S2BQ1A14'], errors='coerce') data['S2BQ1A15']= pandas.to_numeric(data['S2BQ1A15'], errors='coerce') data['S2BQ1A16']= pandas.to_numeric(data['S2BQ1A16'], errors='coerce') data['S2BQ1A17']= pandas.to_numeric(data['S2BQ1A17'], errors='coerce') data['S2BQ1A18']= pandas.to_numeric(data['S2BQ1A18'], errors='coerce') data['S2BQ1A19']= pandas.to_numeric(data['S2BQ1A19'], errors='coerce') data['S2BQ1A20']= pandas.to_numeric(data['S2BQ1A20'], errors='coerce') data['S2BQ1A21']= pandas.to_numeric(data['S2BQ1A21'], errors='coerce') data['S2BQ1A22']= pandas.to_numeric(data['S2BQ1A22'], errors='coerce') data['S2BQ1A23']= pandas.to_numeric(data['S2BQ1A23'], errors='coerce') data['S2BQ1A24']= pandas.to_numeric(data['S2BQ1A24'], errors='coerce') data['S2BQ1A25']= pandas.to_numeric(data['S2BQ1A25'], errors='coerce') data['S2BQ1A26']= pandas.to_numeric(data['S2BQ1A26'], errors='coerce') data['S2BQ1A27']= pandas.to_numeric(data['S2BQ1A27'], errors='coerce') data['S2BQ1A28']= pandas.to_numeric(data['S2BQ1A28'], errors='coerce') data['S2BQ1A29']= pandas.to_numeric(data['S2BQ1A29'], errors='coerce') data['S2BQ2A']= pandas.to_numeric(data['S2BQ2A'], errors='coerce') data['S2BQ2B']= pandas.to_numeric(data['S2BQ2B'], errors='coerce') data['S2BQ2C']= pandas.to_numeric(data['S2BQ2C'], errors='coerce') data['S2BQ2D']= pandas.to_numeric(data['S2BQ2D'], errors='coerce') data['S2BQ2E']= pandas.to_numeric(data['S2BQ2E'], errors='coerce') data['S2BQ2FR']= pandas.to_numeric(data['S2BQ2FR'], errors='coerce') data['S2BQ3B']= pandas.to_numeric(data['S2BQ3B'], errors='coerce') data['S2BQ3CR']= pandas.to_numeric(data['S2BQ3CR'], errors='coerce')
#Anti-social behaviour data['S11AQ1A1']= pandas.to_numeric(data['S11AQ1A1'], errors='coerce') data['S11AQ1A2']= pandas.to_numeric(data['S11AQ1A2'], errors='coerce') data['S11AQ1A3']= pandas.to_numeric(data['S11AQ1A3'], errors='coerce') data['S11AQ1A4']= pandas.to_numeric(data['S11AQ1A4'], errors='coerce') data['S11AQ1A5']= pandas.to_numeric(data['S11AQ1A5'], errors='coerce') data['S11AQ1A6']= pandas.to_numeric(data['S11AQ1A6'], errors='coerce') data['S11AQ1A7']= pandas.to_numeric(data['S11AQ1A7'], errors='coerce') data['S11AQ1A8']= pandas.to_numeric(data['S11AQ1A8'], errors='coerce') data['S11AQ1A9']= pandas.to_numeric(data['S11AQ1A9'], errors='coerce') data['S11AQ1A10']= pandas.to_numeric(data['S11AQ1A10'], errors='coerce') data['S11AQ1A11']= pandas.to_numeric(data['S11AQ1A11'], errors='coerce') data['S11AQ1A12']= pandas.to_numeric(data['S11AQ1A12'], errors='coerce') data['S11AQ1A13']= pandas.to_numeric(data['S11AQ1A13'], errors='coerce') data['S11AQ1A14']= pandas.to_numeric(data['S11AQ1A14'], errors='coerce') data['S11AQ1A15']= pandas.to_numeric(data['S11AQ1A15'], errors='coerce') data['S11AQ1A16']= pandas.to_numeric(data['S11AQ1A16'], errors='coerce') data['S11AQ1A17']= pandas.to_numeric(data['S11AQ1A17'], errors='coerce') data['S11AQ1A18']= pandas.to_numeric(data['S11AQ1A18'], errors='coerce') data['S11AQ1A19']= pandas.to_numeric(data['S11AQ1A19'], errors='coerce') data['S11AQ1A20']= pandas.to_numeric(data['S11AQ1A20'], errors='coerce') data['S11AQ1A21']= pandas.to_numeric(data['S11AQ1A21'], errors='coerce') data['S11AQ1A22']= pandas.to_numeric(data['S11AQ1A22'], errors='coerce') data['S11AQ1A23']= pandas.to_numeric(data['S11AQ1A23'], errors='coerce') data['S11AQ1A24']= pandas.to_numeric(data['S11AQ1A24'], errors='coerce') data['S11AQ1A25']= pandas.to_numeric(data['S11AQ1A25'], errors='coerce') data['S11AQ1A26']= pandas.to_numeric(data['S11AQ1A26'], errors='coerce') data['S11AQ1A27']= pandas.to_numeric(data['S11AQ1A27'], errors='coerce') data['S11AQ1A28']= pandas.to_numeric(data['S11AQ1A28'], errors='coerce') data['S11AQ1A29']= pandas.to_numeric(data['S11AQ1A29'], errors='coerce') data['S11AQ1A30']= pandas.to_numeric(data['S11AQ1A30'], errors='coerce') data['S11AQ1A31']= pandas.to_numeric(data['S11AQ1A31'], errors='coerce') data['S11AQ1A32']= pandas.to_numeric(data['S11AQ1A32'], errors='coerce') data['S11AQ1A33']= pandas.to_numeric(data['S11AQ1A33'], errors='coerce')
#Family Drug Abuse. data['S3EQ1']= pandas.to_numeric(data['S3EQ1'], errors='coerce') data['S3EQ2']= pandas.to_numeric(data['S3EQ2'], errors='coerce') data['S3EQ3B']= pandas.to_numeric(data['S3EQ3B'], errors='coerce') data['S3EQ3C']= pandas.to_numeric(data['S3EQ3C'], errors='coerce') data['S3EQ4B']= pandas.to_numeric(data['S3EQ4B'], errors='coerce') data['S3EQ4C']= pandas.to_numeric(data['S3EQ4C'], errors='coerce') data['S3EQ5B']= pandas.to_numeric(data['S3EQ5B'], errors='coerce') data['S3EQ5C']= pandas.to_numeric(data['S3EQ5C'], errors='coerce') data['S3EQ6B']= pandas.to_numeric(data['S3EQ6B'], errors='coerce') data['S3EQ6C']= pandas.to_numeric(data['S3EQ6C'], errors='coerce') data['S3EQ7B']= pandas.to_numeric(data['S3EQ7B'], errors='coerce') data['S3EQ7C']= pandas.to_numeric(data['S3EQ7C'], errors='coerce') data['S3EQ8B']= pandas.to_numeric(data['S3EQ8B'], errors='coerce') data['S3EQ8C']= pandas.to_numeric(data['S3EQ8C'], errors='coerce') data['S3EQ9B']= pandas.to_numeric(data['S3EQ9B'], errors='coerce') data['S3EQ9C']= pandas.to_numeric(data['S3EQ9C'], errors='coerce') data['S3EQ10B']= pandas.to_numeric(data['S3EQ10B'], errors='coerce') data['S3EQ10C']= pandas.to_numeric(data['S3EQ10C'], errors='coerce') data['S3EQ11']= pandas.to_numeric(data['S3EQ11'], errors='coerce') data['S3EQ12']= pandas.to_numeric(data['S3EQ12'], errors='coerce') data['S3EQ13']= pandas.to_numeric(data['S3EQ13'], errors='coerce') data['S3EQ14']= pandas.to_numeric(data['S3EQ14'], errors='coerce')
#cannabis use every day in the past 12 months Between ages of 15 to 40 #sub1=data[(data['AGE']>=18) & (data['AGE']<=24) & (data['S3BQ1A5']==1) & (data['S3BQ1A5']==1) & (data['S3BD5Q2C']==1)] #Adults (irrespective of sex) and the age of 60 who have ever used cannabis and who currently use cannabis from once a year to once a day.
sub1=data[(data['AGE']<=60) & (data['S3BQ1A5']==1) & (data['S3BD5Q2C']<=10) & (data['S3BD5Q2E']<=10)]
#c1 = sub1["MAJORDEPLIFE"].value_counts(sort=False, dropna=False) #print(c1) c2 = sub1["AGE"].value_counts(sort=False, dropna=False) #print(c2)
def ANTISOC (data): if(data['S11AQ1A1']==1 or data['S11AQ1A2']==1 or data['S11AQ1A3']==1 or data['S11AQ1A4']==1 or data['S11AQ1A5']==1 or data['S11AQ1A6']==1 or data['S11AQ1A7']==1 or data['S11AQ1A8']==1 or data['S11AQ1A9']==1 or data['S11AQ1A10']==1 or data['S11AQ1A11']==1 or data['S11AQ1A12']==1 or data['S11AQ1A13']==1 or data['S11AQ1A14']==1 or data['S11AQ1A15']==1 or data['S11AQ1A16']==1 or data['S11AQ1A17']==1 or data['S11AQ1A18']==1 or data['S11AQ1A19']==1 or data['S11AQ1A20']==1 or data['S11AQ1A21']==1 or data['S11AQ1A22']==1 or data['S11AQ1A23']==1 or data['S11AQ1A24']==1 or data['S11AQ1A25']==1 or data['S11AQ1A26']==1 or data['S11AQ1A27']==1 or data['S11AQ1A28']==1 or data['S11AQ1A29']==1 or data['S11AQ1A30']==1 or data['S11AQ1A31']==1 or data['S11AQ1A32']==1 or data['S11AQ1A33']==1): return 1 else: return 0 sub1['ANTISOC'] = sub1.apply (lambda data: ANTISOC (data), axis=1) c7 = sub1["ANTISOC"].value_counts(sort=False, dropna=False) #print(c7)
#both drug dependence and abuse def DRUGDEP (data): if (data['MAR12ABDEP'] > 0 or data['MARP12ABDEP'] > 0): return 1 else: return 0
sub1['DRUGDEP'] = sub1.apply(lambda data: DRUGDEP (data), axis=1) #print (pandas.crosstab(sub1['MAR12ABDEP'], sub1['DRUGDEP']))
def FAMDRUGDEP (data): if (data['S3EQ1']== 1 or data['S3EQ2']== 1 or data['S3EQ3B'] < 99 or data['S3EQ3C']== 1 or data['S3EQ4B'] < 99 or data['S3EQ4C']== 1 or data['S3EQ5B'] < 99 or data['S3EQ5C']== 1 or data['S3EQ6B'] < 99 or data['S3EQ6C']== 1 or data['S3EQ7B'] < 99 or data['S3EQ7C']== 1 or data['S3EQ8B'] < 99 or data['S3EQ8C']== 1 or data['S3EQ9B'] < 99 or data['S3EQ9C']== 1 or data['S3EQ10B'] < 99 or data['S3EQ10C']== 1 or data['S3EQ11']== 1 or data['S3EQ12']== 1 or data['S3EQ13']== 1 or data['S3EQ14']== 1): return 1 else: return 0
sub1['FAMDRUGDEP'] = sub1.apply (lambda data: FAMDRUGDEP (data), axis=1) c11 = sub1["FAMDRUGDEP"].value_counts(sort=False, dropna=False)
def ALCHABUS (data): if(data['S2BQ1A3']==1 or data['S2BQ1A4']==1 or data['S2BQ1A5']==1 or data['S2BQ1A6']==1 or data['S2BQ1A7']==1 or data['S2BQ1A8']==1 or data['S2BQ1A9A']==1 or data['S2BQ1A9B']==1 or data['S2BQ1A9C']==1 or data['S2BQ1A9D']==1 or data['S2BQ1A9E']==1 or data['S2BQ1A9F']==1 or data['S2BQ1A9G']==1 or data['S2BQ1A9H']==1 or data['S2BQ1A9I']==1 or data['S2BQ1B9J']==1 or data['S2BQ1C9K']==1 or data['S2BQ1A10']==1 or data['S2BQ1A11']==1 or data['S2BQ1A12']==1 or data['S2BQ1A13']==1 or data['S2BQ1A14']==1 or data['S2BQ1A15']==1 or data['S2BQ1A16']==1 or data['S2BQ1A17']==1 or data['S2BQ1A18']==1 or data['S2BQ1A19']==1 or data['S2BQ1A20']==1 or data['S2BQ1A21']==1 or data['S2BQ1A22']==1 or data['S2BQ1A23']==1 or data['S2BQ1A24']==1 or data['S2BQ1A25']==1 or data['S2BQ1A26']==1 or data['S2BQ1A27']==1 or data['S2BQ1A28']==1 or data['S2BQ1A29']==1 or data['S2BQ2A']==1 or data['S2BQ2B']==1 or data['S2BQ2C']==1 or data['S2BQ2D'] < 99 or data['S2BQ2E'] < 99 or data['S2BQ3B'] < 99 or data['S2BQ2FR'] < 999 or data['S2BQ3CR'] < 999 ): return 1 else: return 0
sub1['ALCHABUS'] = sub1.apply (lambda data: ALCHABUS (data), axis=1) c9 = sub1["ALCHABUS"].value_counts(sort=False, dropna=False)
def FAMALCSM (data): if(data['S2DQ1']==1 or data['S2DQ2']==1 or data['S2DQ3C2']==1 or data['S2DQ4C2']==1 or data['S2DQ5C2']==1 or data['S2DQ6C2']==1 or data['S2DQ7C2']==1 or data['S2DQ8C2']==1 or data['S2DQ9C2']==1 or data['S2DQ10C2']==1 or data['S2DQ11']==1 or data['S2DQ12']==1 or data['S2DQ13A']==1 or data['S2DQ13B']==1 or data['S2DQ14A']==1 or data['S2DQ14B']==1 or data['S2DQ15']==1 or data['S2DQ16']==1 or data['S2DQ17']==1 or data['S2DQ18']==1 or data['S2DQ19']==1 or data['S2DQ21']==1): return 1 else: return 0
sub1['FAMALCSM'] = sub1.apply (lambda data: FAMALCSM (data), axis=1) c8 = sub1["FAMALCSM"].value_counts(sort=False, dropna=False) #print(c8)
# logistic regression BETWEEN Anti-Social Behaviour and Drug Dependence / Abuse lreg9 = smf.logit(formula = 'ANTISOC ~ DRUGDEP', data = sub1).fit() print (lreg9.summary()) # odds ratios print ("Odds Ratios") print (numpy.exp(lreg9.params))
# odd ratios with 95% confidence intervals params = lreg9.params conf = lreg9.conf_int() conf['OR'] = params conf.columns = ['Lower CI', 'Upper CI', 'OR'] print (numpy.exp(conf))
###
# logistic regression BETWEEN Anti-Social Behaviour and Drug Depencence with the ABSENCE OR PRESENCE OF Historical FAMILY Drug Dependence lreg15 = smf.logit(formula = 'ANTISOC ~ DRUGDEP + FAMDRUGDEP', data = sub1).fit() print (lreg15.summary()) # odds ratios print ("Odds Ratios") print (numpy.exp(lreg15.params))
# odd ratios with 95% confidence intervals params = lreg15.params conf = lreg15.conf_int() conf['OR'] = params conf.columns = ['Lower CI', 'Upper CI', 'OR'] print (numpy.exp(conf))
###
# logistic regression BETWEEN ABSENCE OR PRESENCE OF Anti Social Behaviour and Drug Dependence and Alcohol Abuse lreg12 = smf.logit(formula = 'ANTISOC ~ DRUGDEP + ALCHABUS', data = sub1).fit() print (lreg12.summary()) # odds ratios print ("Odds Ratios") print (numpy.exp(lreg12.params))
# odd ratios with 95% confidence intervals params = lreg12.params conf = lreg12.conf_int() conf['OR'] = params conf.columns = ['Lower CI', 'Upper CI', 'OR'] print (numpy.exp(conf))
# logistic regression BETWEEN ABSENCE OR PRESENCE OF Anti Social Behaviour and Drug Dependency and Alcohol Abuse with History of Family Alcoholism lreg13 = smf.logit(formula = 'ANTISOC ~ DRUGDEP + ALCHABUS + FAMALCSM', data = sub1).fit() print (lreg13.summary()) # odds ratios print ("Odds Ratios") print (numpy.exp(lreg13.params))
# odd ratios with 95% confidence intervals params = lreg13.params conf = lreg13.conf_int() conf['OR'] = params conf.columns = ['Lower CI', 'Upper CI', 'OR'] print (numpy.exp(conf))
## logistic regression BETWEEN ABSENCE OR PRESENCE OF Anti Social Behaviour and Family Alcholism and Drug Dependency. #lreg11 = smf.logit(formula = 'ANTISOC ~ FAMALCSM + DRUGDEP', data = sub1).fit() #print (lreg11.summary()) ## odds ratios #print ("Odds Ratios") #print (numpy.exp(lreg11.params)) # ## odd ratios with 95% confidence intervals #params = lreg11.params #conf = lreg11.conf_int() #conf['OR'] = params #conf.columns = ['Lower CI', 'Upper CI', 'OR'] #print (numpy.exp(conf))
0 notes
Text
Multiple Regression Test Of Employment Rate, Urban Rate, Alcohol Consumption and Suicide Rates on Life Expectancy.
This submission has the following sections:
- The Research Question
- The Dataset
- Methodology
- Results
- Charts
- Regression (output from Python)
- Python Code
Research Question: The study looked at the association between countries' declared Employment Rates, Urban Rates, Alcohol Consumption Rates and Suicide Rates on the declared Life expectancies as reported in the Gapminder dataset.
Dataset: GapMinder.
Methodology
The data types were converted to numeric using pandas libraries and centred. A linear regression was performed on the data using the OLS libraries to first of all establish a linear regression between employment rate (explanatory variable) and life expectancy (response variable).
Other Independent variables were added to the model to determine any confounding variables. The significance of the association was noted via the P-Values (> 0.05) and the coefficients (Positive or negative).
The strength of the association was measured by R-Squared which gives an indication of how much the response variable changed with the exploratory variable.
The independent variables were added step-wise to the model and the OLS - Regression results printed to indicate how the variable modified association if at all.
A graph was printed to depict the association and a quadratic line representing the second order polynomial was drawn.
Results There was a negative and significant relationship between the countries’ Employment Rate and Life Expectancy. (Please see Chart 1 and Regression Output below.)
The results showed Employment Rate and Life expectancy had a negative coefficient (-0.2987) and a significant P value (P < 0.05) . The R-square (the amount of variability in the response variable that is explained by the explanatory variable) of the relationship was just 9.6%
Further analysis with a second order polynomial showed the relationship was more negatively curvilinear than linear, thus countries with low and high employment rates tended to have low life expectancies. The R-Square improved to 13.9%
When controlling for urban rate in the relationship between employment rate and life expectancy, it was observed that employment rate was no longer significantly associated with life expectancy. (P > 0.05). As the P-Value for employment rate is no longer significant when urban rate is included in the model, it can be said that urban rate confounds the relationship between employment rate and life expectancy.
When evaluating the independent association between other predictor variables such as alcohol consumption and suicide rates it was observed that recorded alcohol consumption rates for each country were positively and significantly associated with their declared life expectancy rates however although the suicide rates had a negative association it was a non-significant association with the recorded life expectancies, (P > 0.05).
The intercept or life expectancy in the model when all other independent variables were zero or at their means was at 69.5.
Together all the exploratory variables, employment rate, urban rate, alcohol consumption rate and suicide rates made up only about 47.5% of the variability observed in the declared life expectancy rates for each country.
The QQ Plot plots the residuals The residuals are the difference between the predicted Life expectancies and the actual life expectancies for each country. These residuals are expected to follow a straight line if they are normally distributed (a key assumption). However the investigated plot shows slight deviations at the upper and lower levels, suggesting that while an improvement from the linear model, the curvilinear model still does not fully estimate the life expectancies for each country using the given explanatory variables. (Please see Chart 2 below)
The Standardised Residuals
Only a very few countries (2) had standard deviations above 2, while just about (5) have residuals below (-2), making it 95.8% of residuals falling within two standard deviations of the mean (higher than the recommended 95%). The fact that, 4.2% of the residuals were greater than 2.0 suggests the model could be improved by perhaps adding more explanatory variables. (Please see Chart 3 below)
The Leverage Plot
The leverage plot there are a few outliers, i.e. those countries which have residuals greater than 2 or less than -2 however these (except for one, South Africa) have low leverage values. (Please see Chart 4 below)
Charts
Chart 1: Multiple Regression

Chart 2: The QQ Plot plots the residuals

Chart 3: The Standardised Residuals

Chart 4: The Leverage Plot

Appendix I - Regression Results - Output From Python

Appendix II - Python Code
# -*- coding: utf-8 -*- """ Created on Sunday: 16th September 2018
@author: Lloney Monono """
import pandas import matplotlib.pyplot as plt import statsmodels.api as sm import statsmodels.formula.api as smf import seaborn
# bug fix for display formats to avoid run time errors pandas.set_option('display.float_format', lambda x:'%.2f'%x)
data = pandas.read_csv('gapminder.csv')
# convertions to numeric datatype
data['urbanrate'] = pandas.to_numeric(data['urbanrate'], errors='coerce') data['suicideper100th'] = pandas.to_numeric(data['suicideper100th'], errors='coerce') data['alcconsumption'] = pandas.to_numeric(data['alcconsumption'], errors='coerce') data['employrate'] = pandas.to_numeric(data['employrate'], errors='coerce') data['lifeexpectancy'] = pandas.to_numeric(data['lifeexpectancy'], errors='coerce')
# Rm of Nas sub1 = data[['alcconsumption', 'lifeexpectancy', 'suicideper100th','employrate', 'urbanrate']].dropna()
#################################################################################### # POLYNOMIAL REGRESSION ####################################################################################
# Establish a linear relationships between Urban Rate & life exp scat1 = seaborn.regplot(x="employrate", y="lifeexpectancy", scatter=True, data=sub1) plt.xlabel('Employment Rate') plt.ylabel('Life Expectancy')
## use the second order polynomial *order = 2* # run the 2 scatterplots together to get both linear and second order fit lines scat2 = seaborn.regplot(x="employrate", y="lifeexpectancy", scatter=True, order=2, data=sub1) plt.xlabel('Employment Rate') plt.ylabel('Life Expectancy')
## centering the independent (explanatory) variables Urban Rate, alcohol consumption, suicide rates per 100 ## & employemnt rate sub1['urbanrate_c'] = (sub1['urbanrate'] - sub1['urbanrate'].mean()) sub1['alcconsumption_c'] = (sub1['alcconsumption'] - sub1['alcconsumption'].mean()) sub1['suicideper100th_c'] = (sub1['suicideper100th'] - sub1['suicideper100th'].mean()) sub1['employrate_c'] = (sub1['employrate'] - sub1['employrate'].mean()) sub1[["alcconsumption_c", "suicideper100th_c"]].describe()
# Perform a linear regression analysis between life expectancy & Employment Rate reg1 = smf.ols('lifeexpectancy ~ employrate_c', data=sub1).fit() print (reg1.summary())
# quadratic (polynomial) regression analysis between Life expectancy & employment rate #using the square of the exlanatory variable employment rate reg2 = smf.ols('lifeexpectancy ~ employrate_c + I(employrate_c**2)', data=sub1).fit() print (reg2.summary())
# quadratic (polynomial) regression analysis between Life expectancy & employment rate ## controlling for Urban RAte & employment rate reg3 = smf.ols('lifeexpectancy ~ employrate_c + I(employrate_c**2) + urbanrate_c', data=sub1).fit() print (reg3.summary())
# quadratic (polynomial) regression analysis between Life expectancy and a compbination of ## (Urban Rate, alcohol Consumption ) reg4 = smf.ols('lifeexpectancy ~ employrate_c + I(employrate_c**2) + urbanrate_c + alcconsumption_c', data=sub1).fit() print (reg4.summary())
# quadratic (polynomial) regression analysis between Life expectancy and a Employment Rate ## while controlling for Urban Rate , alcohol Consumption & suicide rate per 100) reg5 = smf.ols('lifeexpectancy ~ employrate_c + I(employrate_c**2) + urbanrate_c + alcconsumption_c + suicideper100th_c', data=sub1).fit()
print (reg5.summary())
#################################################################################### # EVALUATING MODEL FIT ####################################################################################
#Q-Q plot for normality fig2=sm.qqplot(reg5.resid, line='r') plt.ylabel('Standardized Residual') plt.xlabel('Observation Number')
## simple plot of residuals stdres=pandas.DataFrame(reg5.resid_pearson) fig3=sm.qqplot(stdres) l = plt.axhline(y=0, color='r') plt.ylabel('Std. Residual') plt.xlabel('Observations')
#Leverage Plots fig4=sm.graphics.influence_plot(reg5,size=8) print(fig4)
0 notes
Text
Data Science Assignment:- Test A Basic Linear Model
The association between Employment Rate (the explanatory variable) and Life Expectancy (the Response variable) was tested using data from the Gap Minder Dataset.
Data:
The Gap Minder Dataset was used and both the response variable and the explanatory variables are quantitative variables.
The response variable is : Lifeexpectancy The exploratory varable is: empoyment rate
The number of observations used in the study is : 176
Methodology
Python script calling pandas, numpy and statsmodels libraries.
Results
The results of the regression model indicted that life expectancy was significantly and negatively associated with employment rate. (Fstatistic 20.66 and P-value less than .0001)
The P value is very small lower than 0.05 therefore we can reject the null hypothesis and suggest that Employment rate is significantly associated (negatively) with Life expectancy.
R-squared, The proportion of variance in the response variable that can be explained by the explanatory variable, is small, accounting for just 11% seen in the response variable life expectancy.
The regression model’s best fit line for the response variable Life Expectancy is:
87.66 +(-0.3085) * employmentrate
Appendix I: Output from the Python Script:


Appendix II: The Python Script
# -*- coding: utf-8 -*- """ Created on Sunday 30th Aug. 2018
@author: Lloney Monono """
import pandas import numpy import statsmodels.formula.api as smf import seaborn import matplotlib.pyplot as plt
data = pandas.read_csv('C:\\...\\gapminder.csv', low_memory=False)
data['employrate'] = pandas.to_numeric(data['employrate'], errors='coerce') data['lifeexpectancy'] = pandas.to_numeric(data['lifeexpectancy'], errors='coerce')
print('OLS Regression Model between Employment Rate (Categorical Variable) and Life Expectancy (Response Variable)')
olsreg = smf.ols('data.lifeexpectancy ~ data.employrate', data).fit()
print(olsreg.summary())
data['employrate']=data['employrate'].replace(' ', numpy.nan) scat1 = seaborn.regplot(x='employrate', y='lifeexpectancy', fit_reg=True, data=data) plt.xlabel('Employment Rate') plt.ylabel('Life Expectancy') plt.title('Scatterplot for Employment Rate & Life Expectancy') data_clean=data.dropna()
0 notes
Text
Data Science Assignment
Analysing The Arrest Log For Providence Police Department.
Step 1: Describe your sample.
a) Describe the study population (who or what was studied).
The study population is Adults arrested and charged by Providence Police Department Arrest during the Past 60 Days.
b) Report the level of analysis studied (individual, group, or aggregate).
The analysis seeks to establish if there was any link between an arrested individual's race or ethnicity and recorded Assault offences.
H0: An individual's race or ethnicity is independent of recorded assault offences. H1: There is a relationship between an individual's race or ethnicity and recorded assault offences.
c) Report the number of observations in the data set.
The report comprises 1160 arrest records.
d) Describe your data analytic sample (the sample you are using for your analyses).
The data sample comprises 140 Assault offences attributed to individuals of White or Black race and Hispanic or Non-Hispanic ethnicity.
Step 2 Describe the procedures that were used to collect the data.
a) Report the study design that generated that data (for example: data reporting, surveys, observation, experiment).
Data was generated from recorded arrests by the Providence Police Department.
b) Describe the original purpose of the data collection.
The original purpose of the data was to provide a log of all individuals arrested for Rhode Island Statute Violations.
c) Describe how the data were collected.
The data was captured from the arrested individuals in Providence
d) Report when the data were collected.
The data in the report has been captured 60 days prior to 18th May 2018 and encompasses the months March, April and May.
e) Report where the data were collected.
The data was collected by Providece Police Department in Providence Rhode Island and put online for public access.
Step 3: Describe your variables.
a) Describe what your explanatory and response variables measured.
There are two categorical variables Race / Ethnicity and Statute Description
Explanatory Variables are Race and Ethnicity while the response variable is the Statute Description (Assault)
b) Describe the response scales for your explanatory and response variables.
The explanatory variables are factors with two levels each for example race (Whilte / Black) and ethnicity (Hispanic / non-Hispanic) The response variables is a count of assault crimes (any statute-violation description that has the word "Assault")
c) Describe how you managed your explanatory and response variables.
To perform a Chi-Square Test Of Independence a two-way table is constructed from the data.
0 notes
Text
Blog For Assignments From Data Science Toolkit Course.
Assignment-1 ANOVA
Examined the NESARC data to determine the association between the mean number of cannabis joints consumed (Quantitative Response Variable) and the declared ethnicities.
This submission is split into the following sections:
Hypotheses
Data
Methodology
Results
Summary
Code (Appendix I)
Output from Code (Appendix II)
Hypothesis :
Null Hypothesis: There are no significant differences between the means of monthly cannabis joints smoked by respondents aged 18 - 60 and their declared ethnicities.
Alternate Hypothesis: There are significant differences between the means of monthly cannabis joints smoked by respondents aged 18 - 60 and their declared ethnicities.
Data
The as subset of NESARC data was used, which showed respondents of all declared ethnicities between the ages of 18-60 years who had smoked cannabis in the last 12 months.
Exploratory Variable - Declared Ethnicities (5 Levels)
Response Variable - The mean monthly cannabis joints had in the last 12 months by respondents aged between 18 - 60.
Methodology
The number of days a joint was had in a month was multiplied by the declared number of joints had per day in the last 12 months to work out the number of joints consumed in a month.
ANOVA was performed between the Exploratory Variable Declared Ethnicities and the Response Variable ( the average number of joints smoked by a subset of respondents aged 18 - 60).
The F-statistic and associated P-value were calculated using the Ordinary Least Squares (OLS) function from the statsmodel library.
Post Hoc tests were run using Tukey’s Multiple Comparison Of Means.
Results
American Indians and Alaska Natives (Group 3) were on the average, the highest users of Cannabis, consuming 75.4 joints per month. Those who described themselves as White (Group 1) were on average the least consumers of Cannabis joints.
Differences between the means were observed across all groups. The Mean Differences ranged from (-2.47) between Group 4 & 5 (i.e. between Asian / Pacific Hawaiian and Hispanic or Latino) to 37.6 between Groups 1 and 3 (i.e. between White and American Indian.
The F-Statistic was 3.451 and the P-Value was 0.00824.
Summary
The P-Value is below 0.05 (P < 0.05) so we reject the null hypothesis of no significant differences between the means for monthly cannabis joints consumed and the respondents’ declared ethnicities.
To determine how the means were different from each other, a Tukey Post Hoc Multiple Comparison of Means Test was performed. The Post Hoc tests showed that in all but the difference in the means between ethnic Group 1 (White) and Group 2 (Black), where the null-hypothesis could be rejected, there were no significant differences between the pair-wise comparisons of the means of monthly Cannabis consumption for the declared ethnicities.
Appendix I
Code:
# -*- coding: utf-8 -*- """ Created on Sun. 1st April 2018
@author: Lloney Monono """
import numpy import pandas import statsmodels.formula.api as statsmodform import statsmodels.stats.multicomp as statsmodmulti
data = pandas.read_csv('C:\\Users\\Llone\\Documents\\Data Scientists Toolbox\\Python\\nesarc.csv', low_memory=False)
#How often used cannabis in the last 12 months casting to numeric data['S3BD5Q2C'] = data['S3BD5Q2C'].convert_objects(convert_numeric=True) #Number Of Cannabis Joints Usually consumed in a day in the last 12 Months data['S3BQ3'] = data['S3BQ3'].convert_objects(convert_numeric=True)
# A subset data of adults age 18 to 60 who have had at least one joint every month # in the past 12 months sub1=data[(data['AGE']>=18) & (data['AGE']<=60) & (data['S3BD5Q2C'] <= 6 ) ]
#Missing data not to be included in analysis sub1['S3BD5Q2C']=sub1['S3BD5Q2C'].replace(99, numpy.nan) sub1['S3BQ3']=sub1['S3BQ3'].replace(99, numpy.nan)
#Recoding number of days a joint was had in the past month. Ignoring anything # below 1x a month. See aove condition <= category 6 recode1 = {1: 30, 2: 24, 3: 16, 4: 8, 5: 3, 6: 1} sub1['JOINTFREQMO']= sub1['S3BD5Q2C'].map(recode1)
#Casting variable JOINTFREQMO to numeric sub1['JOINTFREQMO']= sub1['JOINTFREQMO'].convert_objects(convert_numeric=True)
# Estimating the number of Joints consumed in a month by multiplying the frequency by the # frequency by the number of joints per day sub1['EST_JOINTCOUNT']=sub1['JOINTFREQMO'] * sub1['S3BQ3']
sub1['EST_JOINTCOUNT']= sub1['EST_JOINTCOUNT'].convert_objects(convert_numeric=True)
ct1 = sub1.groupby('EST_JOINTCOUNT').size() print (ct1)
#Looking at More than two levels ANOVA using Ethnicity (sub3) and Marital status (sub4) # first Ethnicity sub3 = sub1[['EST_JOINTCOUNT', 'ETHRACE2A']].dropna()
model2 = statsmodform.ols(formula='EST_JOINTCOUNT ~ C(ETHRACE2A)', data=sub3).fit() print (model2.summary())
print ('means for EST_JOINTCOUNT by by Declared Ethnicity') m2= sub3.groupby('ETHRACE2A').mean() print (m2)
print ('Standard deviations for EST_JOINTCOUNT by Declared Ethnicity') sd2 = sub3.groupby('ETHRACE2A').std() print (sd2)
#Post Hoc Test using Tukey mc1 = statsmodmulti.MultiComparison(sub3['EST_JOINTCOUNT'], sub3['ETHRACE2A']) res1 = mc1.tukeyhsd() print(res1.summary())
Appendix II
Output:
dtype: int64 OLS Regression Results ============================================================================== Dep. Variable: EST_JOINTCOUNT R-squared: 0.014 Model: OLS Adj. R-squared: 0.010 Method: Least Squares F-statistic: 3.451 Date: Sun, 01 Apr 2018 Prob (F-statistic): 0.00824 Time: 15:53:51 Log-Likelihood: -5913.5 No. Observations: 978 AIC: 1.184e+04 Df Residuals: 973 BIC: 1.186e+04 Df Model: 4 Covariance Type: nonrobust ===================================================================================== coef std err t P>|t| [0.025 0.975] ------------------------------------------------------------------------------------- Intercept 37.8015 4.376 8.638 0.000 29.214 46.389 C(ETHRACE2A)[T.2] 27.7614 8.484 3.272 0.001 11.112 44.411 C(ETHRACE2A)[T.3] 37.6039 17.415 2.159 0.031 3.428 71.780 C(ETHRACE2A)[T.4] 12.3860 26.004 0.476 0.634 -38.645 63.417 C(ETHRACE2A)[T.5] 9.9161 8.863 1.119 0.263 -7.476 27.308 ============================================================================== Omnibus: 1458.578 Durbin-Watson: 2.077 Prob(Omnibus): 0.000 Jarque-Bera (JB): 608052.290 Skew: 8.478 Prob(JB): 0.00 Kurtosis: 123.971 Cond. No. 8.28 ==============================================================================
Warnings: [1] Standard Errors assume that the covariance matrix of the errors is correctly specified. means for EST_JOINTCOUNT by by Declared Ethnicity EST_JOINTCOUNT ETHRACE2A 1 37.801457 2 65.562814 3 75.405405 4 50.187500 5 47.717514 Standard deviations for EST_JOINTCOUNT by Declared Ethnicity EST_JOINTCOUNT ETHRACE2A 1 75.687860 2 156.727470 3 139.172846 4 96.341904 5 88.870305 Multiple Comparison of Means - Tukey HSD,FWER=0.05 =============================================== group1 group2 meandiff lower upper reject ----------------------------------------------- 1 2 27.7614 4.5751 50.9476 True 1 3 37.6039 -9.9903 85.1982 False 1 4 12.386 -58.6814 83.4535 False 1 5 9.9161 -14.3047 34.1368 False 2 3 9.8426 -40.3248 60.01 False 2 4 -15.3753 -88.1911 57.4404 False 2 5 -17.8453 -46.797 11.1064 False 3 4 -25.2179 -109.0615 58.6257 False 3 5 -27.6879 -78.3417 22.9659 False 4 5 -2.47 -75.6217 70.6818 False -----------------------------------------------
0 notes