
Don't wanna be here? Send us removal request.
Statistics
We looked inside some of the posts by dk-jundiai-blog and here's what we found interesting.
Average Info
Notes Per Post
1
Likes Per Post
1
Reblog Per Post
0
Reply Per Post
0
Time Between Posts
3 months
Number of Posts By Type
Text
6
Last Seen Tumblr Blogs


Fun Fact
Tumblr is used by 21% of adults online aged 18-29 years.
Text
Macro VBA - Copiar Dados de diversas planilhas em um diretório
Olá a todos.
Recentemente comecei a necessitar usar algumas macros VBA em meu trabalho devido a processos repetitivos.
Deparei-me com o seguinte problema:
- Como importar dados de diversas planilhas que estejam em algum diretório pré-determinado?
A macro VBA abaixo serve para copiar dados de todas planilhas que estejam em um diretório pré-determinado.
Private Function Localiza_Dir()
Dim objShell, objFolder, chemin, SecuriteSlash Set objShell = CreateObject("Shell.Application") Set objFolder = _ objShell.BrowseForFolder(&H0&, "Procurar por um Diretório", &H1&) On Error Resume Next chemin = objFolder.ParentFolder.ParseName(objFolder.Title).Path & "" If objFolder.Title = "Bureau" Then chemin = "C:WindowsBureau" End If If objFolder.Title = "" Then chemin = "" End If SecuriteSlash = InStr(objFolder.Title, ":") If SecuriteSlash > 0 Then chemin = Mid(objFolder.Title, SecuriteSlash - 1, 2) & "" End If Localiza_Dir = chemin End Function
Sub Importa_Spreads()
Dim ObjFSO As Object Dim objFolder As Object Dim ObjFile As Object Dim i As Integer Dim Caminho As String
'Criar uma MsgBox MsgBox ("Não deve existir aba chamada 'Avaliação'. Se existir, exclua-a antes de continuar")
'Cria uma instância do Objeto do FileSystem Set ObjFSO = CreateObject("Scripting.FileSystemObject")
'Define a pasta de onde os arquivos serão lidos Caminho = Localiza_Dir() Set objFolder = ObjFSO.GetFolder(Caminho)
Sheets.Add After:=ActiveSheet a = ActiveSheet.Name i = 1
Cells(1, 1) = "Caminho do Arquivo" Cells(1, 2) = "Nome do Arquivo" Cells(1, 3) = "Var 1" Cells(1, 4) = "Var 2" Cells(1, 5) = "Var 3" Cells(1, 6) = "Var 4" Cells(1, 7) = "Var 5" Cells(1, 8) = "Var 6"
'Loop para passar em cada arquivo do diretório e printar os nomes e caminho dos arquivos For Each ObjFile In objFolder.Files
Cells(i + 1, 1) = ObjFile.Path 'Caminho a ser lido Cells(i + 1, 2) = ObjFile.Name 'Print File name Cells(i + 1, 3) = "='" & Caminho & "\[" & ObjFile.Name & "]" & "Variáveis RR'!C3" 'Var1 Cells(i + 1, 4) = "='" & Caminho & "\[" & ObjFile.Name & "]" & "Variáveis RR'!C4" 'Var2 Cells(i + 1, 5) = "='" & Caminho & "\[" & ObjFile.Name & "]" & "Variáveis RR'!C5" 'Var3 Cells(i + 1, 6) = "='" & Caminho & "\[" & ObjFile.Name & "]" & "Variáveis RR'!C6" 'Var4 Cells(i + 1, 7) = "='" & Caminho & "\[" & ObjFile.Name & "]" & "Variáveis RR'!C7" 'Var5 Cells(i + 1, 8) = Caminho 'Var6
i = i + 1
Next ObjFile
Range(Cells(2, 1), Cells(i, 8)).Select Selection.Copy Selection.PasteSpecial Paste:=xlPasteValues, Operation:=xlNone, SkipBlanks _ :=False, Transpose:=False
Sheets(a).Name = "Avaliação" End Sub
Referências
[1] Function Localiza_Dir() - https://stackoverflow.com/questions/40707187/exclude-this-workbook-from-a-loop-that-open-all-folder
1 note
·
View note
Text
Data Management and Visualization
Class 4 - Visualizating Data
I changed some adjustments that I have made at Class 3 about my response variable. Now, my research is based on the binnary variable “Willing about US solve problems by war” with allowed values 0 (not willing to war) and 1 (willing to war). Let’s remeber that I am analyzing OOL data.
I will analyze 3 modified variables: Feelings_DeathPenalty (W2_QK3A is the original variable); Race ; Income.
Univariate Graphs


Bivariate Graphs
On these graphs, the y-axis represents the percentage of the population on that categorie that is “Willing about US solve problems by war”. For example, we see that people that has “STRONG” feelings about Death Penalty, almost 23% of them support that US solve problems by war.


Conclusions
We can see, according to bivariate graphs, that the feelings about Death Penalty/Life Imprisionment is the variable most correlated with willing to US solve problems by war. Indeed, as higher is the feelings about Death Penalty as higher is the suppor to war. People with income $ 15,000 support war more than others. Besides, apparently there is no strong relationship about race to the response variable.
0 notes
Text
Data Management and Visualization
Class 3 - Making Data Management Decisions
My management decision was to change 2 variables of 3. I worked on missing values and grouping categories.


Acording with these tables and the post about class 1, we can see:
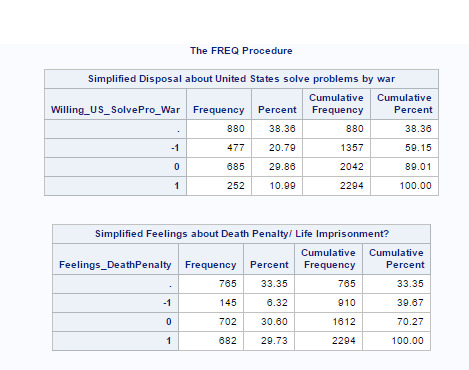
W2_QM12(original variable) is now Willing_US_SolvePro_War: this variable is a simplification about the first. It still contains missings but it has less categories and it is more interpretable.
W2_QK3A(original variable) is now Feelings_DeathPenalty : this variable is a simplification about the first. It still contains missings but if has less categories and it is more interpretable. Race/Ethnicit: I did not change this variable. It seems me gook like it is. The most people are black (~55%) and the second is white (~35%).
0 notes
Text
Data Management and Visualization
Class 2 - Writing your first program (SAS)
My first SAS program is:

The SAS output about four variables (W2_QM12, W2_QK3A, PPINCIMP, PPETHM) from Outlook on Life Survey data is below:


Acording with these tables and the post about class 1, we can see: W2_QM12: There is a lot of missing values about “Disposal about US to solve problems by war”.Almost 30% is “Somewhat Willing” about disposal to war. W2_QK3A: There is a lot of missing values (~34%). Most people are not sure about Death Penalty (~60%). PPINCIMP : This is a variable that has a good distribution. The mean about income is close about $60.000 - $74.999. Race/Ethnicit: The most people are black (~55%) and the second is white (~35%).
0 notes
Text
Data Management and Visualization
Class 1 – Selecting a Research Question
My work will based on to study Outlook on Life Survey data and I am interested to identify relationships about United States citizen's wish about government to participate war to solve internacional problems and their household income. My hypothesis is that richer families support more the United State to war than poorer families. Another variables that could be interesting to this analysis, besides income, are race and opinion about death penalty / life imprisionment.
I have searched for the terms “household income recruits” and I found the article “Who are the recruits? The demographic characteristics of U.S. military enlistment, 2003 – 2005” by Tim Kane [1]. In this article, it is presentend some findings about income, race, region and educational level about recruits. One of them is that “wartime recruits come more from rural areas”. About income, the conclusion of the study is that the “distribution for recruit household incomes is very similar [...]” compared with youth population. So, there is no evidence that support my hipothesis, but I think and I will analyze that richer families support more war because their young men, when they go to war, they are official militar while poorer are soldiers.
Below there is a table about the variables that I will analyze during the studies.

References
[1] - http://www.heritage.org/research/reports/2006/10/who-are-the-recruits-the-demographic-characteristics-of-us-military-enlistment-2003-2005
0 notes
Text
Primeiros Passos
Esse é meu post inicial no Tumblr. A partir de agora vou usá-lo para publicação de minhas lições no Coursera.

0 notes