
Don't wanna be here? Send us removal request.
Statistics
We looked inside some of the posts by drt-coursera and here's what we found interesting.
Average Info
Notes Per Post
1
Likes Per Post
1
Reblog Per Post
0
Reply Per Post
0
Time Between Posts
15 days
Number of Posts By Type
Text
8
Last Seen Tumblr Blogs


Fun Fact
In Q3 of 2020, 31% of US users access the Tumblr app daily.
Text
Data Analysis Tools - Module4 - by DrT
Testing a Potential Moderator
I examine the relationship between femaleemployrate and urbanrate for 3 different LifeExpectancy categories


Scatterplots:


Summary:
p-value is significant in all of these 3 life exp. categories so LifeExpectancy as a monitor doese have similar effect on femaleemployrate - urbanrate corelation.
0 notes
Text
Data Analysis Tools - Module3 - by DrT
Pearson Correlation
Calculation:


Scatterplot for the Association Between lifeexpectancy and femaleemployrate:


Scatterplot for the Association Between incomeperperson and femaleemployrate:


Summary:
In the 1st case we have a significant p-value, in the 2nd its not so there is no positive correlation between them.
0 notes
Text
Data Analysis Tools - Module2 - by DrT
Running a Chi-Square Test of Independence
Alcohol consumption rating:

Set variables and graph:


Contingency table of observed counts in case of 'DRINK_Rating' and 'RankOfUrbanrate':


Contingency table of observed counts in case of 'DRINK_Rating' and 'IncomePerPerson_Rating':


Contingency table of observed counts in case of 'DRINK_Rating' and 'RankOfLifeExpectancy':


Summary:
As a result with groups 'DRINK_Rating' and 'RankOfUrbanrate' we got p=0,04 high and Chi-Square value of 10 high so we can approve the null-hypothesis that there is significant relationship between them.
As a result with groups 'DRINK_Rating' and 'IncomePerPerson_Rating' we got p=0,00038 very low and Chi-Square value of 25.5 high so we can reject the null-hypothesis that there is no significant relationship between them.
As a result with groups 'DRINK_Rating' and 'RankOfLifeExpectancy' we got p=0,00007 very low and Chi-Square value of 24 high so we can reject the null-hypothesis that there is no significant relationship between them.
0 notes
Text
Data Analysis Tools - Week1 - by DrT
Recoding & creating secondary variables:

Output:

Calculating the F-statistic and associated p value:


Calculating mean & standard deviation:


2nd calculation of the F-statistic and associated p value:


Creating the Multiple Comparison of Means:


Summary:
I've applied the statistical calculations for my database where I analyzed the lifeexpectancy-Urbanrate and lifeexpectancy-femaleemployrate relations. p1=0,0481, p2=0,0108 which means the null hypothesis significantly true stating there's a correlation between them.
0 notes
Text
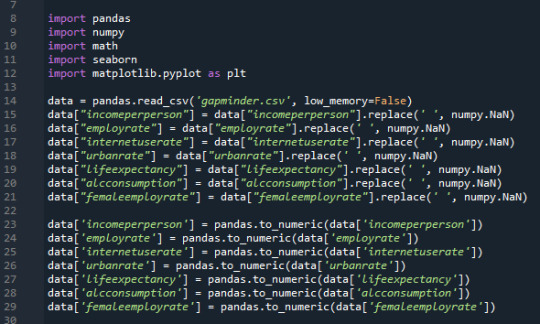
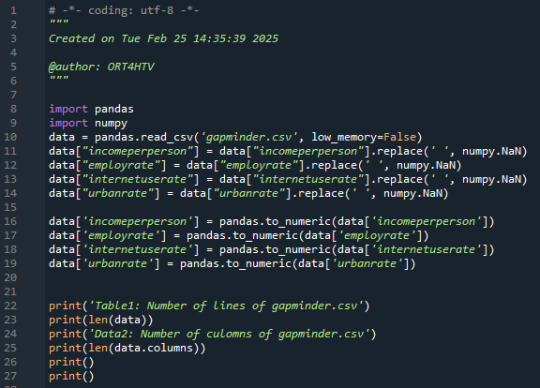
Data Management and VisualizationModule 4 - Python My1stProgram
Basic data manipulation for converting ' ' to Nan:
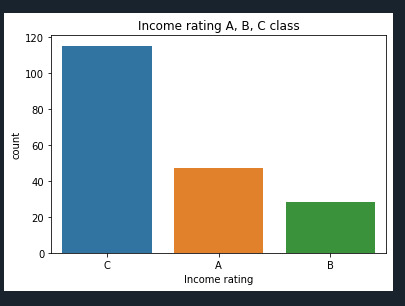
Bar graph for categorical variables:

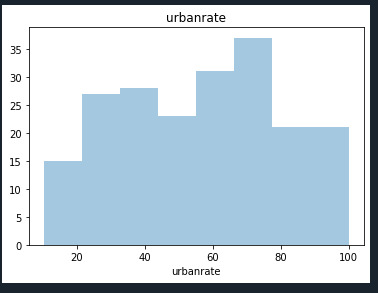
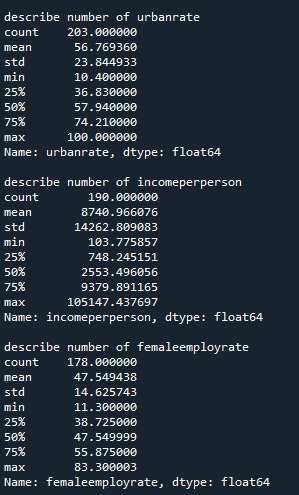
histogram for quantitative variable:

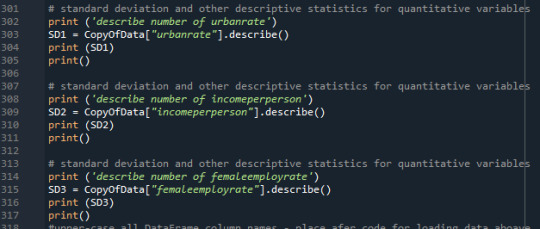
standard deviation and other descriptive statistics for quantitative variables:
Scatteerplot is created to show data desribed below:
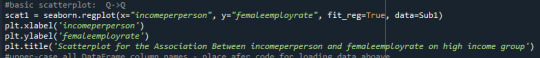
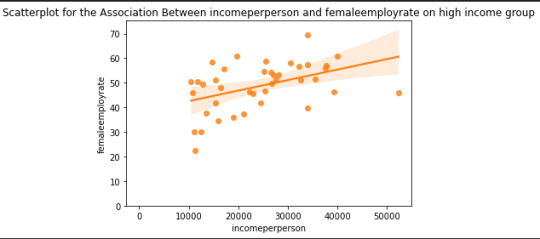
The basic hypothesis is disproved here as it is clearly visible the more the income the most the female employ rate is.
0 notes
Text
Data Management and Visualization - Module 3
Leave out missing data from the evaluation:

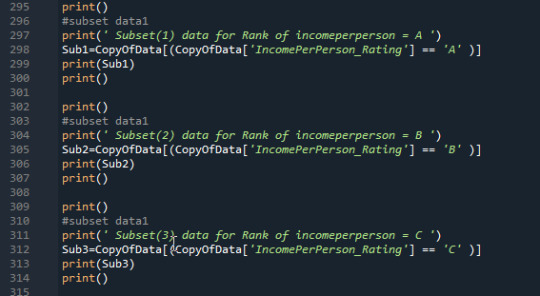
I've created new culomn 'RankOfIncome' for making category for the range of 'incomeperperson':
Ranks:
A: incomeperperson > 10000
B: incomeperperson in 5000 - 10000
C: incomeperperson < 5000

Replace empty cells with category (nan -> 0):

Statistical analysis of variables A, B, C:


Recoding C->A, A->C into a new culomn 'RankOfIncomeReversed':

Statistical analysis of the reversed variables A, C:


I did the same evaluation for 'urbanrate' where I categorized as follows:
urbanrate > 66% : 'A'
urbanrate in 33-66% : 'B'
urbanrate < 33% : 'C'

As 3rd variable I did the same evaluation for 'lifeexpectancy' where I categorized as follows:
lifeexpectancy> 75 : 'A'
lifeexpectancy in 60-75 : 'B'
lifeexpectancy < 60 : 'C'

Summary:
I made evaluation on the income and ranked it to 3 categories. I’ve categori A a for more than 10,000, B for between 5 and 10,000 and C for less than 5000. I've created similar statistics on urbanrate and lifeexpectancy as described above.
Once I created these variables I could make evaluation on them so I defined the number of the elements which falls into one category and also created the percentage of them.
Next thing I did based on the sample I replaced the categories order (income ) so I replaced A with C so now in the new column A means the less category of the incomes and C means the highest category of the income. Afterwards I’ve calculated the percentage the number of them.
0 notes
Text
Data Management and Visualization - Module 2
My first program:
Input CSV: Gapminder
My variables:
- urbanrate
- employrate
- internetuserate
My program:
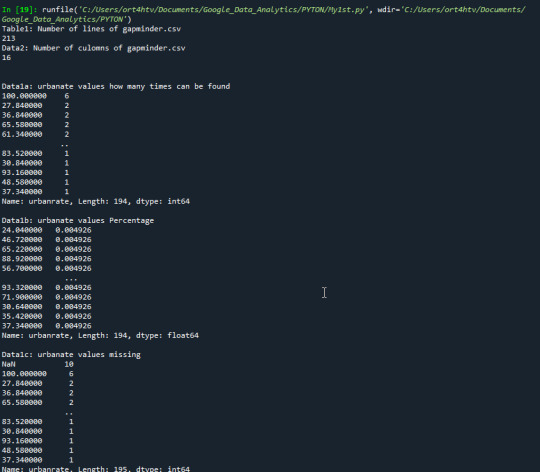
read database:
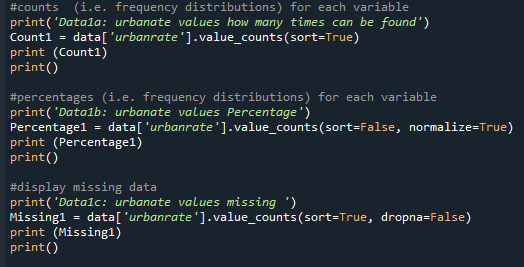
Print 'urbanrate' quantity, percentage and missing data:
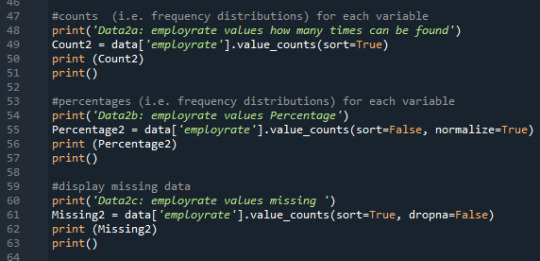
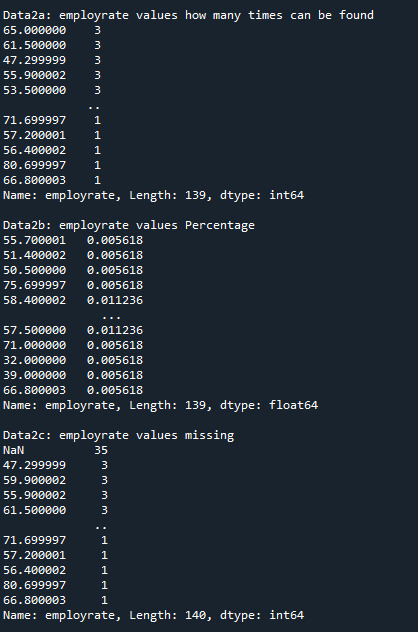
Print 'employrate' quantity, percentage and missing data:
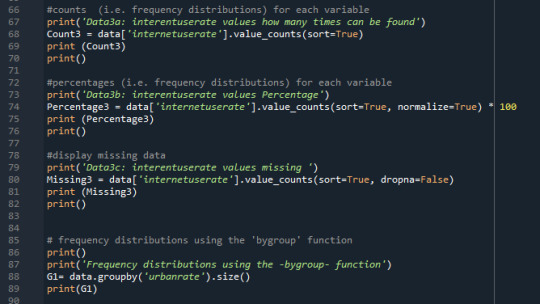
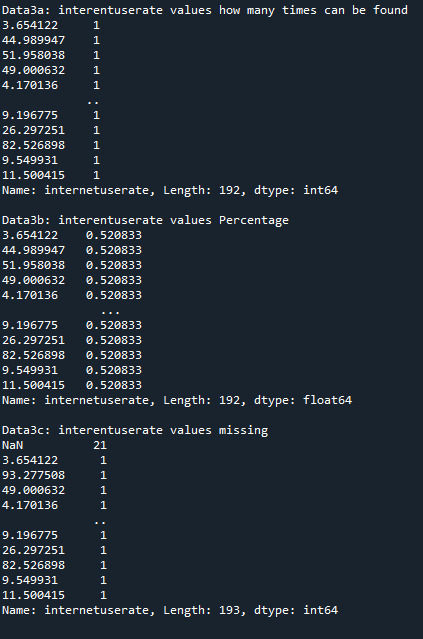
Print 'interentuserate' quantity, percentage and missing data:
Output:
Creating subsets:
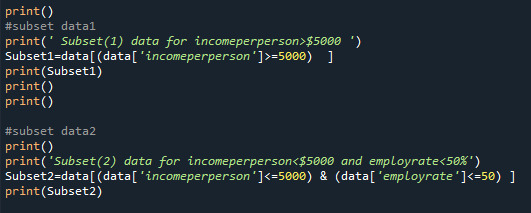
Output Subsets:
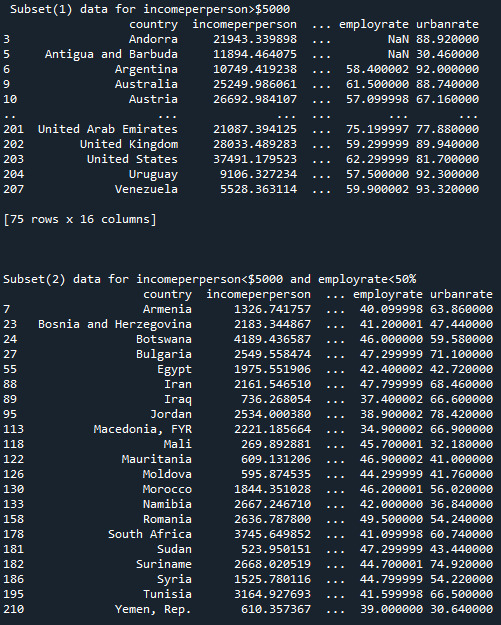
Copy of subset:

Summary:
Here I created frequency distributions displayed as count & percentage, also displays the missing data.
0 notes
Text
Data Management and Visualization_Module 1_Getting My Research Project Started
STEP 1: Choose a data set that you would like to work with:
gapminder.csv
STEP 2. Identify a specific topic of interest:
Income per person
STEP 3. Prepare a codebook of your own:
C:\Users\...\gapminder.xlsx
STEP 4. Identify a second topic:
Female employ rate
STEP 5. Add questions/items/variables:
C:\Users\...\gapminder.xlsx
STEP 6. Perform a literature review to see what research has been previously done on this topic:
https://www.jstor.org/stable/2117812
https://onlinelibrary.wiley.com/doi/abs/10.1111/j.1468-232X.1991.tb00775.x
https://www.jstor.org/stable/2808013
STEP 7. Based on your literature review, develop a hypothesis about what you believe the association might be between these topics:
The hypothesis the Income per person is lower the female employ rate is higher .
1 note
·
View note