
Last Seen Blogs

unluckyoscthoughts
tacophy love forever and ever🌮🏆

lovemygirls
Без названия

d-nohely
coeurbrisé

loneliest-heart
Lonely Heart

magi-blue
Ozu Urara
Text
My last post on my Tumblr blog...moving to dustinczarny.com
Friends this is my last post on my tumblr blog but not the end of my election related content. Today I am launching my latest project: dustinczarny.com.

This is my new home for my various election related projects that I have started over the last few years. As Onondaga County’s Democratic Elections Commissioner I am always looking for ways to further educate voters and navigate them through the arcane web of New York’s electoral system.

On my podcast page you can find my ongoing Commissioner in a Car series. A weekly Facebook live show dedicated to election news and deadlines. I also started a weekly interview series for candidates and Democracy advocates called Zoom with Czarny.

This will also serve as a home for my writings. On occasion I am blessed to testify in my role as Democratic Caucus Chair of the NYS Elections Commissioner Association. I have appeared in front of the NYS Legislature, Onondaga County Legislature, and Syracuse Common Council. I have collected my previous testimony here with video links when available.
I also have a weekly statistics blog called Wonky Wednesday. This column is dedicated to examining the election statistics and registration data in Onondaga County and throughout New York State. I also will from time to time author editorials and opinion articles on election related topics. You can find those writings on my editorial page.
On occasion I appear on feature podcasts and tv shows. These longer programs offer me the ability to discuss complicated election issues on my featured page. Finally I regularly appear in local and statewide media on election related matters. I am compiling all current and past appearances on my interview page.
This website and all programming is entirely paid for by my personal funds. I do not accept donations or advertising. This is all part of my voter education and outreach efforts. If you are interested you can subscribe to my website and get updates when I post content.
I wish you well in the new year and thank you for your support throughout the years. 2022 will be challenging as every year has been, but I am excited by the many projects on the horizon.
0 notes
Text
Wonky Wednesday: Absentee Ballots in the 2021 General Election

Welcome back to #wonkywednesday. Every week I take a write a column dedicated to election and registration data in Onondaga County and New York State. Absentee and mail in balloting has become needlessly controversial over the last two elections due to the rhetoric of the former President and his supporters. Furthermore in New York our arcane rules have put an unusual spotlight on mail in ballots as they were sequestered and not counted until 2 weeks after Election Day. Those rules will change for 2022. In a blow to mail-in ballot supporters the proposition for no-excuse balloting failed at the 2021 general election. Whether this dampers the growth we have seen in mail-in balloting in the future of New York will be interesting to watch in 2022 and beyond. This week I investigate the absentee, affidavit, and court order ballot data from the 2021 general election.

Democrats continue to dominate Absentee voting in 2021 as they did in 2020. The 2946 ballots cast by Democrats accounted for nearly 49% of all ballots while the GOP (1843) accounted for 30.6%. Like with Early Voting Democrats outpaced their enrollment in Onondaga (38.4%) as did the GOP (27.3%). The story of the 2021 election continues to be non-enrolled voters participating at lower rates. Their 895 ballots were just 14.9% of the absentee ballot total despite being 27.3% of the overall electorate. There were 9438 absentee ballots requested overall with 3423 (36.29%) not returning their ballot. Another 225 the ballots were returned as undeliverable (2.4%) most likely permanent absentees who moved since last election.
Another 185 were returned but ruled invalid. Of the invalids 56 (30.3%) were ruled that way because they did not properly fill out the ballot envelope and did not return the cure affidavit sent by the BOE in time. Another 42 (22.7%) returned their absentees postmarked after Election Day. 30 (16.2%) voted in person during Early Voting or Election Day while another thirty were ruled invalid during the absentee opening after inspecting the ballots inside. Finally, 15 (8.1%) ballots were pulled as they were issued to Election Inspectors who then decided not to work on Election Day, rendering their excuse invalid.

Like Early voting, absentee ballots rise and fall in ratio to overall turnout. They also seem to correlate to federal versus local election years with voters not only increasing in numbers requested but return rate in federal years. In 2021 more voters requested and returned absentee ballots than all but a few years since 2009. 2012, 2016, and 2020 were presidential years and accounted for the high requests, 2018 a mid term year that came closer to presidential turnout than others. In 2010 there were less requests but slightly more returned ballots. Despite a low turnout for 2021, a higher number of voters are turning toward alternative voting methods from Election Day. The downside for absentees is that despite the high number of requests there was a high number of ballots unreturned as compared to previous years. The 63.7% return rate was the lowest return rate since 2009 (61.2%).

Ever since the reforms initiated in 2019 that brought about Early Voting the electorate has been adapting to the new options for voting. As we can see in 2019 the call for absentee ballots was low with just 3788 voters choosing this method or just 3.52% of the overall vote. Voters were turning to Early Voting for their alternative method. As COVID 19 raised its head in 2020 voters sought to stay at home and vote in record numbers with 57203 voters and a daunting 24.08% of the overall vote. In 2021 with COVID still lingering and voters used to alternative methods we did see a marked increase in ballots returned of 6015 and overall electorate percentage of 6.38%

Two other alternative forms of voting remain to be examined, affidavit and court orders. In 2019 a little-known reform has made affidavit voting a more potent method of voting, the universal transfer of registration. This allows more affidavits to be counted than before since it expanded the acceptable eligibility of registered voters from the county where the vote was cast to all of New York State. This eliminated one of the more common reasons a voter affidavit was reject. In 2021 547 voters cast ballots as affidavits. Only forty-four were ruled invalid. This along with the use of electronic poll books to re route voters to the right polling place has resulted in a 92% acceptance rate, the highest since 2009 and maybe ever. Most of the remaining rejected affidavits are those who refuse to show up at the right polling place or were not registered to vote in the first place.
Court orders are the last alternative voting method, but it is the least used of all. Court orders now are only used by those moving from out of state after the voter registration deadline or those who have failed to register for one reason or another. In 2021 we saw only three court orders throughout the entire Early and Election Day voting period. This is the lowest court order request on record since 2009.

That is it for this year’s #wonky Wednesdays. Next week I will continue the examination of the 2021 election with a look at the Election Day vote and then a final look back at the 2021 election with how Democrats and Republicans did in Onondaga County in overall contests. This will be my final update on Tumblr for my #wonkywednesday articles. I have a new project in the works that I will be announcing on Sunday January 2nd that will change how I communicate with voters throughout all my various platforms. Stay tuned and have a Happy New Year.
0 notes
Text
Wonky Wednesday: Early Voting General Election 2021

Welcome back to #wonkywednesday. Each week I take a deep dive into the election and registration data around Onondaga County to give a better sense of our diverse home. This week I continue to look back at the 2021 General Election. Today I focus on Early Voting and how Onondaga County voters used this reform.

Democrats continue to use the Early Voting reform more than any other party. Democrats make up just over 38.4% of the overall electorate of Onondaga County. In 2021 Democrats made up 39.5% of the turnout for the General Election. Therefore, it is significant that Democrats make up just under 52% of the Early Vote. This disparity can be directly traced back to both the rhetoric against Early Voting by the GOP and investment in Early Voting GOTV by the Democratic party. Of the 6 Early Voting sites Dewitt Town Hall dominated the Early Voting Turnout with 2728 voters voting there. Camillus Town Hall (2133) and Clay Town Hall (1918) followed at 2 & 3. Armond Magnarelli (1274) was fourth, Lafayette Fire Station (860) was fifth, and Syracuse Community Connections (764) was sixth.
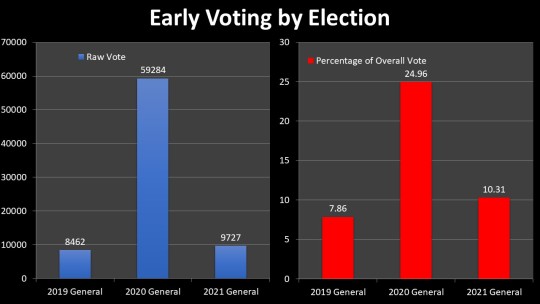
2021 was an abnormally low turnout year. It was the lowest turnout in the General Election since 2015. Early Voting turnout was certainly lower than the tremendous turnout in 2020. In 2020 record turnout was reflected in overall raw Early Votes (59,284) and percentage of overall vote (24.96%). Though 2021 paled in comparison to 2020, it increased numbers and percentages from the last local year, 2019, despite lower turnout. 2021 Early Vote of 9727 was a 15% increase from 2019. The overall percentage of the electorate increased from 7.86% in 2019 to 10.31% in 2021 as well.
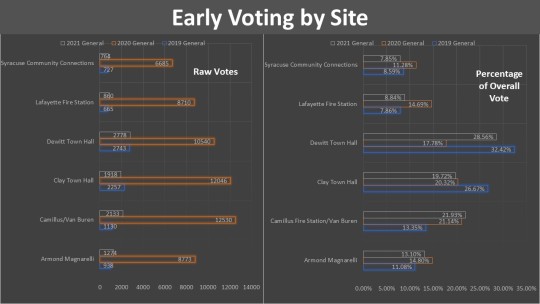
Local years have shown to have dramatically different turnouts to federal years in certain communities. The City of Syracuse had particularly low turnout in 2021 however Armond Magnarelli and Syracuse Community Connections saw higher voter totals (1274 & 768) in raw numbers than 2019 (938 & 727), however Syracuse Community Connections was a lower vote share (7.85%) than 2019 (8.59%) and Armond increased its vote share (13.10%) from 2019 (11.08%). Lafayette Fire Station & Camillus Fire Station saw an increase in their raw vote totals (890 & 2,133) from 2019 (665 & 1,130) and their share of the Early Vote (8.84% & 21.93%) from 2019 (7.86% & 13.35%). The big jump in Camillus may be attributed to the change of location as the western site was in Van Buren Town Hall in 2019. Dewitt Town Hall saw an increase in the raw vote totals (2,778) from 2019 (2,743). However, their overall voter share. .56%) dropped from 2019 (32.42%). Finally, Clay Town Hall dropped in both raw numbers (1918) from 2019 (2,257) as wall as vote share (19.72%) from 2019 (26.67%). What we are seeing is more spread-out usage of the three main suburban sites from 2019 while the city sites and rural sites still lag in participation.
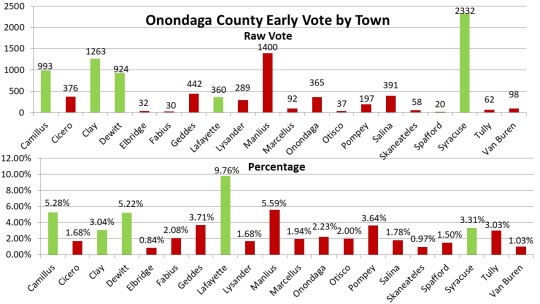
The location of Early Voting sites drives the participation from individual Towns and the City of Syracuse. In the above chart the green bars represent the five towns where Early Voting sites reside in: Syracuse, Camillus, Clay, Dewitt & Lafayette. In terms raw turnout numbers, the City of Syracuse dominates the participation (2332) but also has two sites and more population than any individual town. Camillus (993) Clay (1263) and Dewitt (924) are also large participants as they are high population towns. In terms of percentage of the electorate Lafayette leads in overall percentages (9.76%) despite a low actual number (360). On the converse Syracuse overall percentage of usage (3.31%) is exceptionally low as is Clay (3.04%). Camillus (5.28%) and Dewitt (5.22%) remain high on percentage
As we look toward Early Voting Expansion in 2022 as we will have to look at the towns who do not participate as much, The Town of Manlius is one of the standouts for towns without an Early Voting site in It Though it must be noted the Dewitt Town Hall is on the border, still Manlius is second in over vote total (1400) and percentage (5.59%) despite not having an EV center in it. Conversely the towns of Lysander (1.68%), Cicero (1.68%), Onondaga (2.23%) and Salina (1.78%) are particularly large towns that do not participate as well as Camillus, Clay, and Dewitt in Early Voting. Finally, the drop off in the City of Syracuse could be addressed with Early Voting sites inside them.
That is all for this week. Next week I will look at absentee voting in the 2021 General Election.
0 notes
Text
Wonky Wednesday: Comparing the Onondaga County Redistricting Maps

Welcome back to #wonkywednesday. Each week I do a deep dive into the election and registration data that makes up the electoral landscape of our home, Onondaga County. I am taking a bit of a diversion this week to delve into the topic dominating our political discussion here, redistricting of the County Legislative districts. Over the last two months there has been a wild and rushed process where the GOP legislators and County Executive have rushed through a process that resulted in the County Executive vetoing their own maps. This has put the county in a bit of chaos as the County Charter has no prescribed way forward. The County GOP legislators now have started another process to decide these maps by December 21, 2021 with legislators drawing their own maps. The Democratic caucus has put forward a plan to take longer and sending the maps back to the reapportionment commission.
The County GOP though seems determined to have a vote on December 21, 2021 and the Democrats and GOP have put forward new maps. To make things more complicated the GOP has submitted two different maps (2.5 &4.0) while the Democratic legislators have submitted their maps (3.0). The GOP maps only differ in how they divide the City of Syracuse and their suburban divisions are the same. You can view the maps here at the Reapportion Commission website: http://www.ongov.net/legislature/ReapportionmentCommission.html.
For today’s #Wonkywednesday I will dive into the differences between the GOP and Democratic maps both visually and with some statistics as well. While at first blush the maps completely different, their differences boil down to 4 main areas of the County. I will look at first how the divide up the City of Syracuse, the Northern Suburbs, Eastern Suburbs, and Western Suburbs, where the differences are most stark. The choices in these four areas of the county show the different philosophies in redistricting for the GOP and Democratic lawmakers.
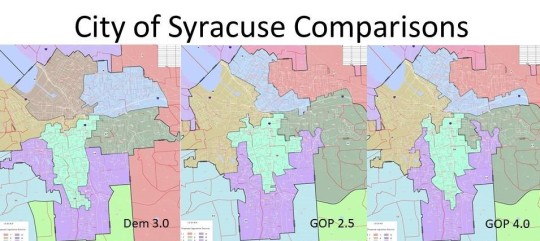
The choices inside the City of Syracuse are where all the differences start. Choices made here have ripple effects throughout the county as a whole. It is also the place where the most improvement could come from the disastrous 2011 map which divided the City of Syracuse into 9 different legislative districts with only 2 totally inside the City and 7 stretching city portions out into the county. This idea of “metro-government” was a novel concept proposed by Onondaga County Reapportionment Committee member Ryan McMahon, now the County Executive. Critics have claimed, including me, this was just another term for Gerrymandering and divided the City needlessly. With a population of over 148k the City of Syracuse could have 5 whole districts inside of it and sixth district would be needed to take some excess population. Both the GOP plan and the Democratic plan try to fix this by having just 6 districts in the city, but that is where the similarities end.
The Democratic plan divides the city into 5 wholly contained districts representing neighborhoods in the East, Northwest, North East, center city and valley portions of the City. A small portion of the west side is paired with Geddes and a small portion of Camillus to create another district. The two GOP have 6 districts but 3 of them span out into neighboring towns leaving only 3 districts inside the City proper. The 6 districts do not really fall into known neighborhoods chewing up traditional neighborhoods like Eastwood, Lincoln hill, university, and the south side into different districts. There are also stark differences in minority representation which I will dive into in the metrics portion of this column.
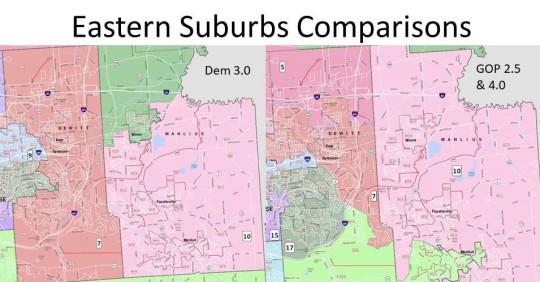
The Eastern suburbs are most affected by the desire to split the city into districts and pair them with more white areas of the county. The Town of Dewitt in particular is drawn and quartered in the GOP plan. Despite having a population of just 26k and could easily fit inside one legislative district, as we see in the Democratic plan, but they needlessly divide it into 4 different districts. In fact the Dewitt portions are either in the minority or near the minority in all four districts making it likely a Dewitt resident may not be represented in the legislature under the GOP plan. With Dewitt being a heavy Democratic town this move is suspect, especially when in the GOP plan the town of Lysander is kept whole, a similarly populated town with high growth rate but just happens to be Republican. They also move the traditional Town of Manlius district north and take the village of Manlius out of this district. The Village of Manlius happens to be Democratic and the newly elected GOP legislator Gregg Olson barely won his election in an ever blue town of Manlius. This could be why they are trying to make OCL 10 more conservative.
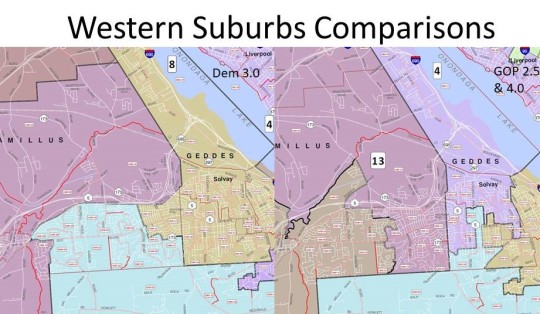
The Western suburbs are similarly affected by the City of Syracuse choices. In the Democratic plan the town of Geddes is kept whole inside one inside one legislative district that adds population from fast growing Camillus and the West side of Syracuse. The GOP plan splits the town into 3 different districts, despite it having only 17K citizens and actually having a negative growth rate over the last ten years. A similar town in Onondaga with 22k which lost population was kept whole in the GOP plan. The Democrats do divide Camillus into three districts where the GOP divides it into two, however the choices within are still suspect. Eastern Camillus is paired with Elbridge the western most towns in the GOP plan through a portion of Van Buren creating a long winding district. The Democrat plan divides eastern Camillus into two different districts pairing with neighboring towns while keeping the western portion of Camillus with Elbridge.
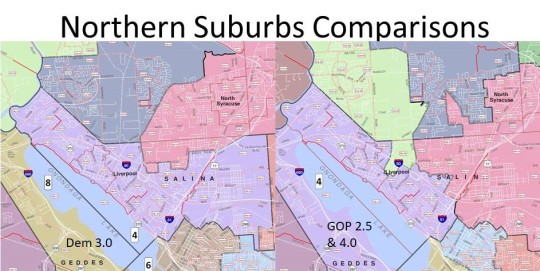
Finally the Northern Suburbs, particularly the Town of Salina is an interesting snapshot of how even when the Democratic and GOP maps agree on number of districts in a Town, their differences show the different choices they make. In the Democratic map the Town of Salina has three different districts, however 28k residents of the town of 33k is in one district, a small Election District bordering Dewitt is put into that district and a small portion of Salina is paired with the new district 5 that takes excess population from Cicero, Salina and Clay as they all require more than one district. In the GOP map a random Ed is paired with a Clay district, half the town is paired with the district 5, and the other half is paired with a winding district that snakes around Onondaga Lake into Geddes putting the residents of Solvay and Liverpool together.

Looking at the 3 new maps and comparing with the old maps all of them do a better job of trying to keep towns from being divided unnecessarily, but again the Democratic plan is best. Each legislative district must be approximately 28k residents. So any town with less than 28k residents the goal should be to put it wholly into legislative district. Manlius, Salina, & Cicero have more than28k residents so they would ideally have two legislative districts inside of them. Clay has 60k residents so it should have 3 districts, and as we discussed Syracuse with 148k residents would have 6. In the GOP map the Towns of Dewitt(4:1), Salina(3:2), Camillus(2:1), Geddes(3:1), Van Buren (2:1) & Onondaga (2:1) have more than the required legislative districts in them. In the Democratic Maps Camillus (3:1), Onondaga (2:1), Lysander (2:1), Van Buren (2:1) & Salina (3:1) have more than required. Van Buren in both maps is divided mainly to keep the village of Baldwinsville whole, which is required by the new state law. In Onondaga in both maps the Onondaga Indian nation is divided and put in the southern district where the Democratic map added in the Nedrow community as a whole. Lysander and Camillus have seen higher than average growth in population along with Clay and Manlius so if that pattern holds having division in those towns are justified. The towns of Geddes and Dewitt have been population neutral over the last ten years if not deficit and dividing them in the way the GOP has done is arbitrary and needless.
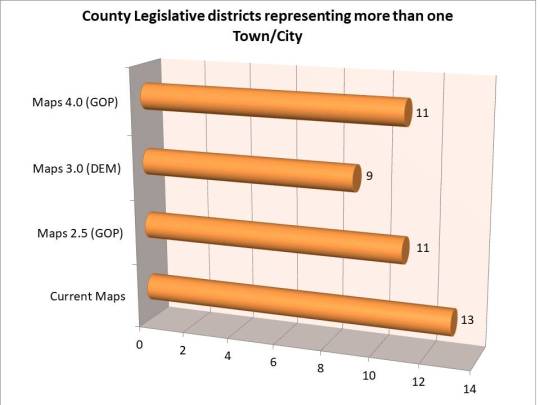
Similarly having a representative cover more than one Town or city should be avoided ideally to allow them to focus on that areas needs and advocate for those citizens. The Democrats by keeping neighborhoods together have done that with only 9 districts spanning Town/City lines while keeping 5 districts wholly inside the City of Syracuse, 2 inside the Town of Clay, and 1 inside the Town of Manlius and Salina. The GOP in their theory of Metro Government has 11 seats spanning lines while keeping 3 districts wholly inside the City of Syracuse, 1 district wholly inside the Towns of Clay, Cicero, and Manlius.
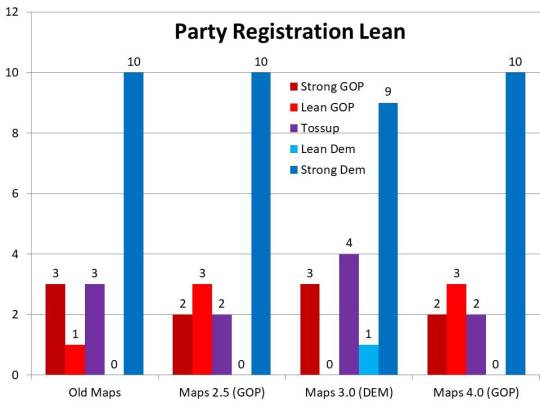
It is hard to determine partisan leans in these districts as turnout in odd year elections ends up playing more of a factor than actual registration. For instance Democrats have had strong partisan leans in 10 districts for the last several cycles yet only consistently win in 6 seats. This is in part due to lower Democratic turnout in odd years as we saw in last week’s #wonkywednesday as well as large swaths of non-affiliated voters who vote differently in local elections than they do in federal elections. Incumbency is also a factor as well. For purposes of illustration though I have ranked the districts in terms of strong and lean rankings for partisan purposes where if a party had more than a 5% enrollment advantage it would have a strong ranking, less than 5% but more than 3% it would have a lean ranking, and lower than 3% it would be a tossup. It’s clear in these rankings that both GOP maps create more leaning GOP districts than the current maps and less tossups. The Dem map creates more tossups, lessens the advantage in one Democratic district and has one less GOP leaning district.

I thought it would be helpful to get a neutral unbiased look at these various proposals. A third party has uploaded the 3 new map proposals as well as the old proposal to the Dave Wasserman Redistricting app. This neutral app compares legislative district lines to the census numbers and past performance. This is a great way to compare the 4 maps in a quantitative way and cut through some of rhetoric being lauded from all sides. The four main areas of comparison are Proportionality, Competitiveness, Minority Representation, and Compactness. With all 4 statistical categories the higher you rank the better and the scores are ranked 1-100.
You can see all four maps on the App at the following links:
2011 Redistricting map: https://davesredistricting.org/maps#viewmap::eab89c8a-5408-4609-9ef6-dc198eac7530
GOP Map 2.5: https://davesredistricting.org/maps#viewmap::7d3ccc35-6aa7-4fe9-8af8-63a30071f5af
DEM Map 3.0: https://davesredistricting.org/maps#viewmap::2db8abb4-66de-47ce-9caa-5fa4553a1a22
GOP Map 4.0: https://davesredistricting.org/maps#viewmap::5362d5f1-5baf-470f-ab74-51e7ebe1aad7
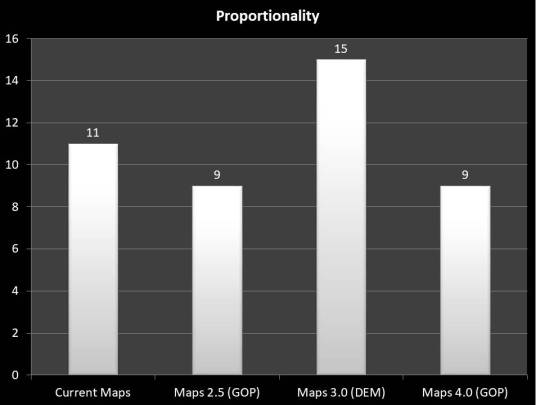
The first ranking of proportionality tries to measure the size of the districts in terms of land mass and how equal they are. This is hard to do on a county-wide level with a dense urban core and sparsely populated rural regions. It is notable though that in this statistic the Democratic map improves on the old district map whereas both GOP maps are rated worse than the oft criticized 2011 maps. Advantage Democrat 3.0.
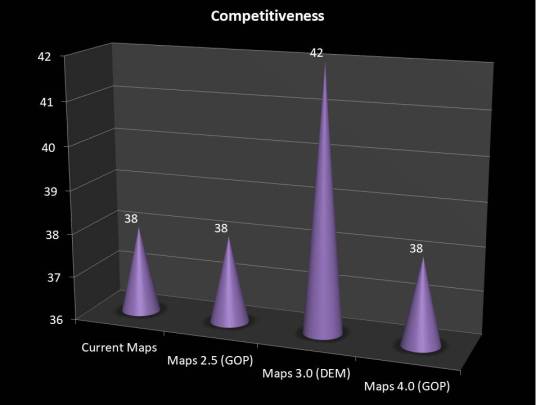
Competitiveness analyzes past performances of the districts in various elections as well as voter registration data to try and determine the likelihood of competitive districts. Once again the newly submitted GOP maps do not improve on the 2011 maps ranking as a tie. As expected from the partisan data I shared earlier the Democrat 2.0 map is rated as more competitive. Advantage Democrat 3.0.
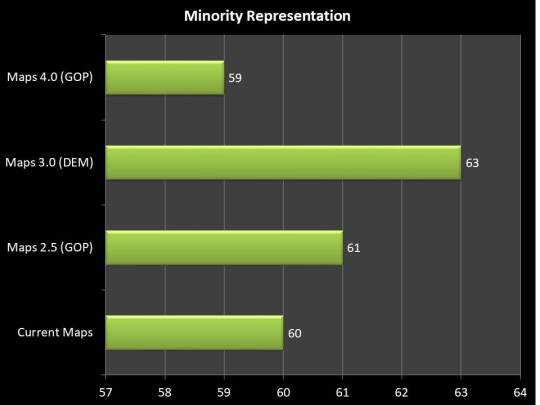
A great deal of the discussion around the vetoed maps is around minority representation. The GOP maps cracks the only Black majority district and splits them into white plurality districts. They’re claim this is to prevent future lawsuits is baseless and flies in the face of redistricting practices in the last few cycles as well as the Voting Rights Act and newly signed State Redistricting guidelines. While their map 2.5 shows a slight improvement on minority representation from the old map, their map 4.0) is actually rated as a step worse. The Democratic map 3.0 ranks higher on this metric as it keeps the majority black district and refrains from unnecessarily pairing city neighborhoods with suburban neighborhoods. Advantage Democrat 3.0.

The final metric may be the most notable, compactness. These metric studies how compact the individual districts are and whether they needlessly have longer obtuse shapes. This is one of the more important attributes to the new state law and could be the crux of legal arguments along with minority representation. It also happens to be the starkest difference between the maps. The 2011 maps were criticized for their obtuse meandering shapes and it is again notable that both submissions of the GOP map were rated worse than the 2011 maps. The Democratic 3.0 map rates much higher on compactness making it more likely to keep communities together and have recognizable representation. Advantage Democrat 3.0.
It becomes clear looking at the objective statistics as well as the maps themselves that the GOP maps submitted will continue to divide Onondaga County and create needless partisan division. At the very least the Onondaga County Legislature should reject the maps, send them back to the Reapportionment commission and demand consensus maps that bridge these divides. Failing in that it is clear the Democratic maps are the better choice according to all metrics and shows a legally sound path for Onondaga County. A public hearing is scheduled to start at 11:30am on December 21, 2021 with votes immediately after. If you care about this issue you should attend and have your voice heard.
(h/t to Mike Stanton for uploading the data to DAR. He graciously allowed me to include it in my article.)
0 notes
Text
Wonky Wednesday: Onondaga County November General Election Turnout Data.

Welcome back to #WonkyWednesday. Each week I do a deep dive into the election and registration data that makes up the electoral landscape of our home, Onondaga County. I have been on a two-month hiatus as the November general election required my undivided attention. However, I will be starting this series anew and the next few weeks we will look at the 2021 General Election and a facet of data so we can understand how Onondaga County voted this last year. The first data set we will look at is the most determinative factor of any election, turnout.
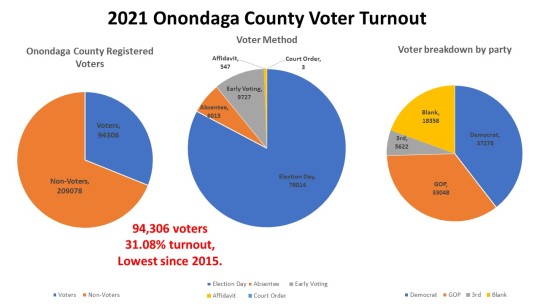
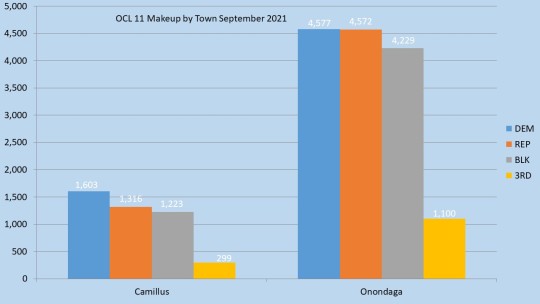
As we can see from the data, turnout was abysmal in Onondaga County in 2021. Just 94,306 voters turned out to vote in the General Election and a remarkable 209,078 voters stayed home. That is just 31.08% turnout and the lowest turnout in Onondaga County since 2015. Voters in Onondaga County continued to diversify the way they vote as well. While the overwhelming majority, 78,014, voted on Election Day, 9,727 voted Early and 6,015 voted by absentee, 547 voted by Affidavit, and 3 voted by court order. These are increases since the last local election in 2019 and in the coming weeks I will dive more into the alternate voting methods. Not surprisingly more Democrats, (37,278), voted in 2021 than GOP, (33,048), Blank/Non-enrolled (18,358), and 3rd Party voters (5,622). This order follows the enrollment order in Onondaga County, but the rates are much different.
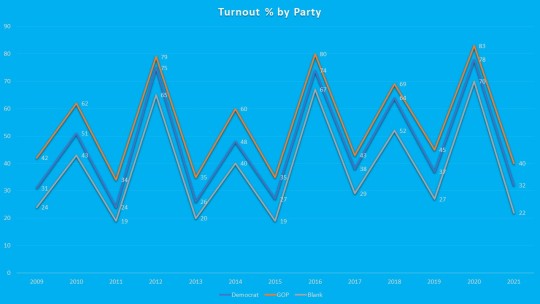
Republicans continue to turnout in higher percentage rates than all other parties in every election on record since 2009 (this is the date I have readily available data on record at the Onondaga County Board of Elections). In 2021 no part had stellar turnout percentages. The GOP did lead in voter turnout at 40%. Democrats, though outnumbering GOP enrollment and raw turnout, were only able to turnout 32% of its enrollment. This 8-point deficit from the GOP mimicked the same deficit we saw in the last local election, 2019. While Blank voters always trail the two major parties, the 10-point deficit from Democrats and 18-point deficit from the GOP is again basically the same as in 2019 though at lower rates. The lack of participation percentages by Democrats and Non enrolled in local elections is one of the reasons we see a blue county like Onondaga struggle to elect Democrats outside the City of Syracuse on a consistent basis.
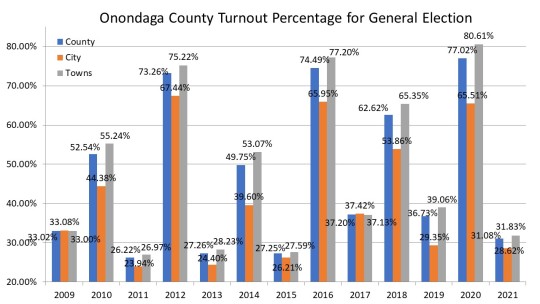
After a 4-year trend of rising turnout in comparative elections, culminating with the highest turnout in percentage and raw vote totals in Onondaga County history in 2020, turnout cratered overall in 2021. The County posted its lowest turnout rate since 2015, and the lowest turnout rate in a mayoral cycle since 2013. This is notable since the mayoral election was unchallenged in 2013 with Stephanie Miner running unopposed. In 2021 the City of Syracuse turnout rate of 28.62% lagging behind the Towns at 31.83%. In 2017 and 2009 with competitive mayoral races the city equaled the turnout rate of the County and surrounding towns. In 2013 without a mayoral race, it trailed towns by just over 3%. Despite a three-way race for mayor in 2021 the city turnout more reflected the 2013 race trailing again by 3%. This certainly accounts for some of the lack of turnout however the Towns still had a pathetic turnout rate as well, again their lowest on record since 2015.

The City of Syracuse gets a lot of media focus, specially during mayoral years. It is important to remember though that the city is only a little over 31.1% of the population of Onondaga County, and just 23.2% of the voter enrollment of Onondaga County. The lower enrollment rate along with historically lower voter turnout usually means an exceedingly small percentage of the actual cast votes. In 2021 that was on display with just 20,174 of the voters coming from the City of Syracuse representing only 21.4% of the votes cast.
This concludes my #wonkywednesday for this week. Over the next few weeks, I plan in-depth review of the 2021 Onondaga County General Election. My series will look at Early Voting, Absentee & Affidavit Voting, Democratic Gains and Losses, and Enrollment percentages of the adult population of Onondaga County. There may be a few redistricting articles thrown in as Onondaga County and the NY State Redistricting maps are approved and released over the next 3 months as the City of Syracuse is targeting September of 2022.
0 notes
Text
My 11/18/21 letter to Onondaga County Executive Ryan McMahon urging a veto of the proposed legislative maps.

Mr. County Executive,
For three years, the people of Onondaga County have been asking for a more transparent and less partisan redistricting process that will result in fair maps. They petitioned the Onondaga County Legislature and City of Syracuse Common Council in 2019 to replace their partisan processes and put citizens in charge of truly independent redistricting commissions. The City of Syracuse and an overwhelming majority of the County legislators promised to do so. The City of Syracuse fulfilled their promise; however, the Onondaga County Legislature did not enact meaningful legislation to reform the redistricting process.
This inaction set up our county to repeat the past mistakes and deliver a flawed potentially illegal product. The Onondaga County Legislature and chairman of the County reapportionment committee compounded that mistake by choosing to rush the current process, effectively prohibiting the community input, in-depth analysis of demographic and voting data, and public scrutiny required to yield a fair map. This rush was entirely unnecessary. The County Charter clearly states the legislature could take up to six months after the delivery of data from the decennial Census to appoint the members of the commission. Instead, the legislature chose to initiate the Commission within a month and provided only 72 hours to find commissioners willing to serve. The County Charter clearly gives the reapportionment commission 3 months to redraw the lines. The Chair of the commission unilaterally demanded the work be done in less than a month. The County Charter allowed the legislature 3 months to then consider the maps. The County Legislative Chairman once again decided to accelerate the process calling a special session of the legislature 10 days after receiving the maps forcing a party line vote to approve them. This rushed process is entirely unnecessary because no map adopted by the Commission will take effect before the 2023 election cycle.
Throughout this entire rushed process, the public has been united in calling for more time and a bi-partisan resolution to this important 10-year decision. The failure to heed their warnings has resulted in a flawed map that divides communities and fails to consider the impact on the voting strength of communities of color, quite possibly in violation New York state law and the federal Voting Rights Act.
The Commissioner failed to give the public adequate time to review and analyze the maps, let alone an opportunity to provide the kind of thoughtful feedback this weighty process demands. Two public hearings were held before any draft maps were even released. The other three public hearings were held within 72 hours of their release. During this time the Redistricting Commission’s chair, Mr. Hulslander, could not meet even his own deadlines for releasing the maps. Despite an agreement to release the data underlying each map at least 24 hours before the October 27th Committee meeting, the Republican Commissioners did not release their map until just 90 minutes before and even then the data was incomplete. For the November 3rd voting meeting Mr. Hulslander set a deadline of Friday October 30th at noon for final maps. This was just two hours after the final public hearing. Even so Mr. Hulslander once again failed to meet his own deadline as the GOP continued to change the data underlying their map until hours before the November 3rd meeting. This failure to adhere to even their own rushed deadlines—let alone objectively reasonable deadlines—kept the public from having an opportunity to weigh in and point out flaws that need to be addressed.
The Reapportionment Commission and Legislative leadership made no attempt to negotiate or compromise their proposed maps to accommodate input from Democratic Commissioners or the public. The map that sits before you today is not substantially changed since it was initially introduced on October 27, in spite of the overwhelming criticism from the public hearings. The maps submitted by the Democratic Commissioners, Sharon Moran and myself, were offered as a first draft meant to be altered and negotiated in response to feedback from other commissioners and the public with the intent of reaching a compromise, consensus map. We asked for more time to get more public input. We were refused. We asked for actual negotiations between commission members on a compromise map. We were refused again. We believe, and still do, that a negotiated map that reflects the equal participation of all commissioners participate and, most importantly, addresses the need and concerns of the community will be a better path forward than adopting this clearly flawed map.
City of Syracuse Legislative Map
Onondaga County Legislative Map
This map is flawed. Inside the City of Syracuse, this map cracked the only majority-Black district in the County Legislature into white-plurality districts without any explanation. This map pairs city districts in 7 & 17 with portions of Dewitt reducing the opportunity for minority representation and needlessly dividing both City and Dewitt communities. This map pairs inner city districts with the Town of Geddes in district 8. District 15 connects the valley of Syracuse with the University and Westcott neighborhoods, communities that have little in common. They create an essentially new inner city district in 9 connecting the little Italy section of the North side to Lincoln hill neighborhoods using a one-block connection.
The maps are equally flawed outside the City of Syracuse. They needless divide the Town of Dewitt into 4 different legislative districts as well as divide the town of Geddes into three when both towns could fit into a single legislative district according to their population. They combined Liverpool and Solvay into a sprawling district 4 that wraps around Onondaga Lake merging two disparate communities. They eliminated the village of Manlius from District 10 and split the neighborhood of Nedrow in half to merge into district 12 dominated by rural sparse communities with little in common. District 13 combines the Towns of Elbridge and Van Buren by skips over the western portion of Camillus to dip into the eastern portion creating a meandering non-compact district.
All of these concerns were brought to the commission’s attention and were dismissed by Chairman Hollander as coming from “Democrats”. You yourself have dismissed these concerns as being presented in an “organized fashion”. I reject those sentiments. Analyzing a redistricting map is a sophisticated and complicated process. It requires sophisticated methods. It requires time. It requires organization. In a county where Democrats constitute a large plurality of registered voters, we shouldn’t be discounting citizens’ feedback on consequential legislative redistricting based on their party affiliation. Elected leaders in Manlius, Dewitt, and Syracuse have joined with organizations like Common Cause, the League of Women Voters, and the NAACP in rejecting both the process and the partisan maps before you today. Two Republican legislators joined with six Democratic legislators in asking for more time and more negotiation. The only bi-partisan agreement that has been reached is that we should start over and reject this partisan map that divides our communities for naked political gain in favor of a thoughtful, transparent, and fair process.
In your 2019 election you claimed “we are all in this together”. It is time to live up to that campaign slogan. There has been near unanimous condemnation of both the process and the flawed maps it has produced. You should listen to the voices of County residents, reject this map, and send it back to the reapportionment commission with a directive to attempt to negotiate consensus maps with another round of public hearings. I believe there can be solutions to the divides that bring a better result for Onondaga County and allow us to better serve the public good, rather than our own partisan wishes. It is now solely in your hands to reduce this partisan tension and demand better. I hope you make the right choice.
Sincerely,
Dustin M. Czarny
Onondaga County elections Commissioner (D)
Reapportionment Committee Member
Syracuse, NY
0 notes
Text
10/16/21 Statement on Release of census data and proposed hearing during Early Voting Hours and unusual interference by the County Executive in Reapportionment Committee process.

Statement from Dustin M. Czarny
Onondaga County Elections Commissioner (D) and member of the Onondaga County Re-Apportionment Committee
Date: October 16, 2021
Subject: Release of census data and proposed hearing during Early Voting Hours and unusual interference by the County Executive in our process.
Late Friday evening I much of the Census Data I have asked for regarding the work needed to be done by the Re-Apportionment committee to draw new Census lines. I will begin the work of analyzing this data ahead of the public meetings scheduled this week and next. In addition to the data, I received a notice of public hearings in addition to the previously released hearings on October 22nd. The hearing notice can be found here:
http://ongov.net/legislature/documents/10.27.21ReapportionmentPublicHearingNotice.pdf
I have several concerns about the new list of hearing dates. The official hearing notice contains three dates. We were expecting two dates on Thursday October 29th and Friday October 30th as outlined in the October 13th meeting: (http://ongov.net/legislature/documents/10.13.21ReapportionmentCommissionMinutes.pdf) However the official hearing notice contains a third date for Wednesday October 28th.
While I applaud the addition of evening hearing dates, all three dates are scheduled during Early Voting hours where the Election Commissioners are duty bound to monitor voting in Onondaga County. Mr. Hulslander’s insistence on forging ahead with public hearings in such a compact schedule is not only gravely irresponsible for the mission of the Reapportionment commission it is now making the Elections Commissioners, one third of the committee, choose between our duties to the voters of Onondaga County and our Chartered roles on the Reapportionment commission.
These Early Voting hours were established by statute in May of 2021 and easily obtainable on our website: http://www.ongov.net/elections/early-voting.html. It is hard to fathom a reason for our commission to move with such speed. Furthermore, the lack of input from commission members on the committee meeting dates and schedule raises the question of whether this is gross incompetence or designed to limit the participation of the chartered members of the commission. It is a point I will continue to raise as Commission members should be allowed to vote and set this schedule. His insistence he has total authority and control is legally questionable and morally reprehensible in leading a government body.
It does seem Mr. Hulslander does talk to one person, County Executive Ryan McMahon. In the Syracuse.com article titled “In surprising turn, GOP leader calls current Onondaga County district boundaries a mistake” (https://www.syracuse.com/politics/2021/10/in-surprising-turn-gop-leader-calls-current-onondaga-county-district-boundaries-a-mistake.html) Mr. McMahon is quoted several times indicating he has had conversations with the commission.
Since he was not in the room on October 13th,I can only assume he means conversations with Chairman Hulslander. “After looking at the schedule, McMahon insisted the commission hold at least one hearing in the city during the evening hours.” This resulted in the additional meeting being added to the schedule. What role Mr. McMahon has in making this decision for the committee without any notice being given to it is questionable. In another instance McMahon told Syracuse.com “The commission has told the county executive’s office to expect maps to be presented to the legislature Nov. 3 and to ask for a vote of the legislature Nov. 12.” This is very alarming. For instance, there is no scheduled meeting of the Onondaga County Legislature on November 12th. Nor did we set a final date for voting on the maps, though a committee meeting was set for November 3rd at 1pm. Mr. Hulslander spoke for the committee once again without notifying us.
I understand that Mr. Hulslander was County Executive Ryan’s handpicked member of this committee and enjoys a close relationship with the County executive serving as his campaign attorney in 2019, however it is inappropriate to set schedules on the insistence of the County Executive without first getting consent of the Reapportionment committee. I plan to bring up these issues at the Tuesday October 19,2021 Reapportionment Committee meeting at 10am in the County Legislature chambers. I hope to get the committee to resolve these matters so our work can be accomplished in an organized and fair manner.
0 notes
Text
My prepared testimony in front of the Onondaga County Legislature Budget Hearing 10/8/21
(For transparency’s sake I have decided to share my prepared written testimony for today’s Budget Hearing for the Onondaga County Board of Elections at the Onondaga County Legislature. I am arguing for more funding and against the County Executive’s cuts of our draft budget.)
October 8, 2021
Budget Committee Hearing
Onondaga County Legislature
The Board of Elections will have many challenges over the 2022 calendar year in meeting the budget laid out by the County Executive. As we have shown in our annual report, the Onondaga County Board of Elections is already understaffed when compared to the rest of the state. Currently, the Onondaga County Board of Elections averages 1 full time employee for every 19.2k voters. The rest of New York averages 1 full time employee for every 8.5k voters. This is by far the worst ratio in the state. In addition, Onondaga County budgeted $9.28 per voter in 2021. This was one of the most frugal budgets in the state which averaged $19.78 per voter.
We made up for these funding inadequacies over the last several years by heavily relying on grant funding. The CARES grant and the ITC grant specifically helped with staffing shortages during the 2020 Election along with liberal use of our shoebox grant funding. We were able to stretch some of the ITC grant funding into the early part of this year to pay for extra staff to deal with registration and mail check processing. However, these grant funding options are not available for 2022. While Shoebox funding is available for temporary staff in 2022 that grant funding may be needed in 2023 to offset the costs of purchasing additional voting machines.
Our Commissioners made a bi-partisan determination that 4 additional staff members were needed to adequately accomplish the goals and requirements laid out for us by the New York State Legislature and the New York State Board of Elections. We asked for four additional staffing members to deal with the ever growing workload. With the ease of registering online through DMV, we have seen registration through this method increase by a factor of 10. This has tripled the amount of forms we must process each year and the rate is accelerating. This is putting strain on our already low staffing structures. Other boards have added staff since 2019 to deal with these staffing needs. We have not.
In addition to the increase in registrations, the Board of Elections will face more strains on our staff in 2022. Early Voting sites will increase to ten minimum sites in 2022. Absentee ballots will now be canvassed before Election Day adding 40 days of ballot canvassing while our staff is preparing Early Voting and Election Day operations. No fault absentees and Same Day registration will likely be passed by voters this fall adding more responsibilities to our staff. Without permanent staffing increases, we will have to compensate using Shoebox funds in 2022 to bring in inefficient temporary staff. The need for constant re-training and the short term nature of this staff does not allow us to adequately cover the long term needs of the voters of Onondaga County.
Finally, if we are forced to use Shoebox money for temporary staff we are only passing a larger bill down the road. Our ImageCast machines originally purchased in 2008 are reaching the end of their life. Our extended service agreement runs out in the middle of 2022. We need to consider a capital improvement to replace these ImageCast scanners. This will cost approximately $2.5 million for a complete conversion to modern tabulators. The Board of Elections will have approximately $1 million in grant monies to off set some of this purchase. However, if we spend this grant money as we do now to cover staffing and training that number will be reduced.
Thank you,
Dustin M. Czarny
Onondaga County Elections Commissioner (D)
0 notes
Text
Wonky Wednesday: Onondaga County Legislature 15th District

Welcome back to Wonky Wednesday. Each week I do a deep dive into the election and registration data that makes up the electoral landscape of our home, Onondaga County. I hope by looking into this data we can glean that this everchanging county is not monolithic as once thought and competition for Democrats, and all registrations, can be found everywhere. This week start my #Fliptheleg series looking at each of the 17 Onondaga County Legislative races. Today I look at Onondaga County Legislative seat #5 representing southwest portion of the City of Syracuse as well as portions of Onondaga and Geddes.

At the time of redistricting William Kinne {D} was the legislator representing this portion of Onondaga County. Due to health reasons Kinne did not run for reelection This allowed the GOP majority on the redistricting commission to really alter this district. It may oner of the weirder shapes the committee came up with. And it benefited a committee member, Ryan McMahon. Ryan was the current third district councilor in the City of Syracuse and represented that portion of Syracuse. However, they needed to wed portions of the suburbs of Syracuse to the district to make it more palatable to win and keep this district. So, they clipped off the university portions of the district and added Geddes as well as a pathway through the Town of Onondaga.

This has always been a Democratic enrollment heavy district but has grown dramatically the last few years. Democrats have 46% of the voter enrollment of the district, a strong plurality. Republicans have just 22%, non-enrolled currently outnumber the GOP in the district with 255 of the voters. Split between three towns the district is mostly inside the city with 50% of the voters. Geddes has 40% of the district, and Onondaga just 10%.

As the GOP base has eroded inside the city this district has become more Democratic over time. At the time of inception, the district was Democratic but not overly so. However, Democrats have gained 1197 voters. The GOP enrollment has plummeted losing 992 voters. The non-enrolled has gained modestly with 477 voters. This has turned a purplish district to an overwhelmingly blue one.

The City of Syracuse is driving the Demographic changes in the district. Democrats dominate the city portion with overwhelming Democratic enrollment is driving the partisan lean in the district. The Geddes and Onondaga portions of the district were added to the district to balance it out but even here Democrats have taken leads. The suburban towns have been leaning Democratic and that is demonstrably worse the closer you get to Syracuse. The portions of OCL 15 that stretch into Geddes includes Solvay and the borders of Syracuse. The same is true of the portions of Onondaga.

In 2011 Ryan McMahon ran for the district he helped draw, and miraculously he won. He was able to win his first race against Mark English by 911 votes. Upon winning Ryan McMahon was voted as Chairman of the legislature with all the new legislators supporting the man who helped draw their districts. In 2013 Ronnie Bell (D) lost to McMahon by 1364 votes as McMahon’s profile grew with his new position. In 2015 Timothy Rudd (D) tried to take a shot at unseating McMahon and lost by 1413 votes. By 2017 McMahon; s stature had grown so much that the Democrats decided not to run anyone against him. However, when Joannie Mahony left her office before the end of her term Ryan McMahon was appointed. fellow GOP legislators to yet another promotion, this time County Executive. He then Named Miles Bottrill (R) a similar moderate GOP politician who used to e on the city council in hopes of defending the seat. However, Bill Kinne {D} had decided it was time to re enter the political fray and run for his old seat. He won the district by 822 votes and flip the seat to blue in a similar fashion to OCL 7 in 2017. When the popular GOP incumbent left the district the demographics of the district swung back to the Democrats.

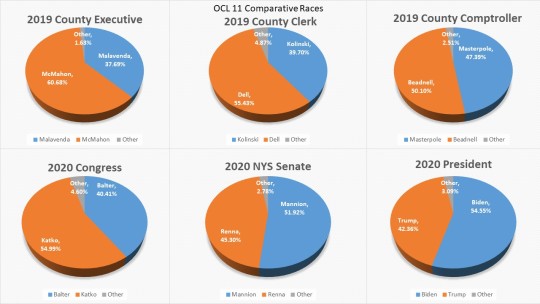
The comparative races show a district that almost always swings to the Democrats, with one obvious exception. Considering Ryan McMahon represented this district it is no surprise he posted a 10-point win here when running for County Executive. However, the County Clerk race was a 12-point win for Democrats and Beadnell lost the Comptroller race in this district by an astonish. g 24 points. In 2020 Democrats dominated this district. Balter won the congressional race by 11 points, Rachel May won the Senate trace by 28 points and not to be outdone Joe Biden won this district by over 34 points.

Bill Kinne (D) is running for re-election in this district. He is often one of the more vocal critics of the previous occupant of the district and fighting for Democratic legislation. You can find him on Facebook at https://www.facebook.com/billkinneisrunning and on the web at https://vote4billkinne.com/.
0 notes
Text
Wonky Wednesday: Onondaga County legislative District #14

Welcome back to Wonky Wednesday. Each week I do a deep dive into the election and registration data that makes up the electoral landscape of our home, Onondaga County. I hope by looking into this data we can glean that this everchanging county is not monolithic as once thought and competition for Democrats, and all registrations, can be found everywhere. This week start my #Fliptheleg series looking at each of the 17 Onondaga County Legislative races. Today I look at Onondaga County Legislative seat #14 the eastern part of the Town of Clay.
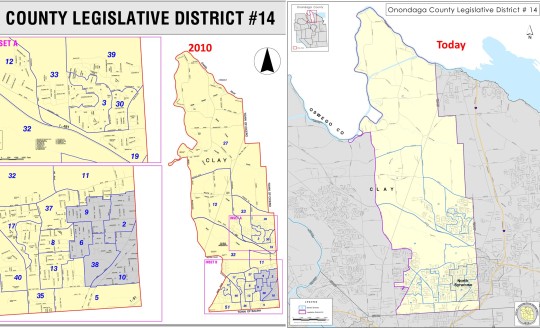
At the time of redistricting Casey Jordan (R) was the legislator representing this portion of Onondaga County. The GOP majority on the redistricting commission saw this as a safe GOP seat and did not alter it, avoiding the weird shapes other districts fell victim to. However, they did have to add a few voters to it since the legislature was reduced from 19 to 17 members, however not as much as other districts as Clay was one of the fastest growing Towns in Onondaga County. They added a few districts in southern Central Clay and called it a day relying on the power of incumbency to keep the district.
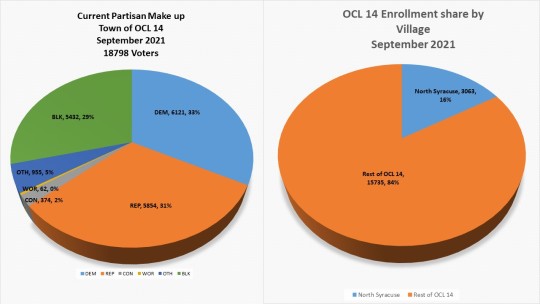
What was once thought a safe GOP district has changed dramatically. Democrats now have a small plurality in the district having 33% of the vote. The GOP is now 2nd with 31% of the voting population. The non-enrolled population is gaining on both parties with 29% of the population. This is one of just 3 districts that are wholly contained in a town, so we must look to other ways to get some insights. Fortunately, half of the village of North Syracuse is in OCL 14. That makes up about 16% of the voting population so we do get a decent look at some differences inside the district.
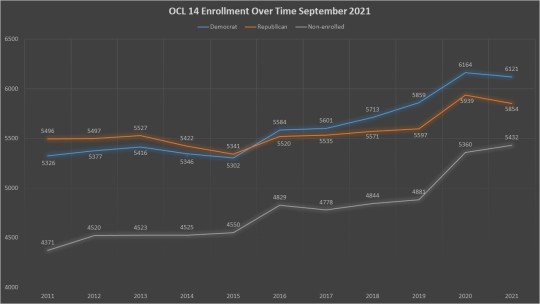
Democrats have overtaken this once solid red district. Since redistricting Democrats have gained 795 voters. The GOP has gained voters as well, but at a lesser rat, just 358 voters. The Non-enrolled is the big gainer here with 1061 voters. As the population in this district grows the makeup seems to change. While the GOP is holding ground there does seem to be the familiar suburban shift, we saw in reaction to the Trump election in 2016. Newer voters and transplants tend to favor Democrats while many GOP are shedding their party label because of the national politics.
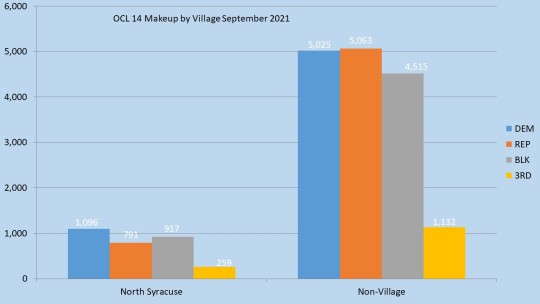
The North Syracuse portion of the district is where the Demographic changes are most prevalent. The small plurality for Democrats in the district comes from this portion. Democrats have a sizeable plurality of the North Syracuse village portion in OCL 14. Non-enrolled outnumber the GOP here. The remaining portion of the district is a statistical tie with the GOP outnumbering the Democrats by less than 40 registrants. If a Democrat could run even in the rest of the district, they could flip it with the registration advantage in N. Syracuse.
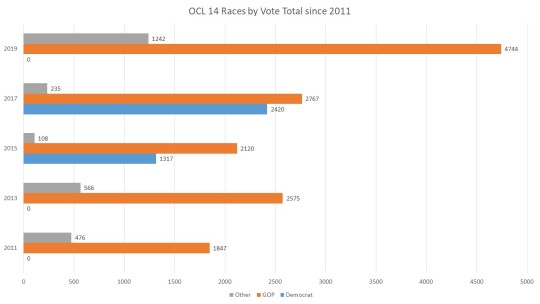
In 2011 and 2013 the Democrats were not organized in Clay and did not run a candidate against Casey Jordan. In 2015 before the Trump shift political newcomer Kevin Tees lost to Casey Jordan by a little over 800 votes. However, in the next election another political newcomer Stephanie Heath (D) ran a much closer race losing by just 327 votes. In fact, Heath won more votes on the Democratic line than Jordan did on the GOP line, but Jordan was reelected on the strength of the conservative and independence party vote. In what should be seen as a lost opportunity, in 2019 the Democrats failed to capitalize on this momentum by not fielding a candidate allowing Jordan to run unopposed. This does not mean Jordan was popular. In fact facing growing public outcry over the White Pines development and a strong Democratic challenger this year, Jordan decided not to run when a convenient county job opened up for him. This allowed the GOP to appoint and run the son of a tax collector in Clay for the job.
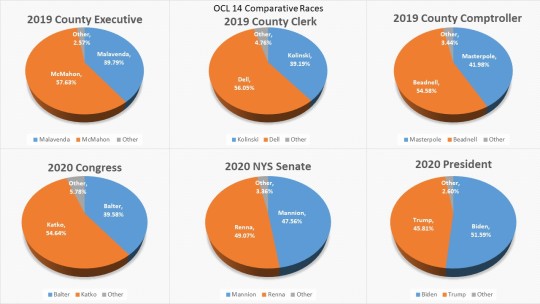
The comparative races show a district that is becoming more competitive as the Registration patterns start to shift. Without Democrats running competitive local races in 2019 the GOP candidates in the comparative districts did dominate the county wide races here. McMahon won by 18 points, Dell by 17, and Beadnell by 12. However, 2020 does show a different look at the district. Katko did perform well for congress winning the district by 16 points, however John Mannion came within 1.5 points of winning the district and Joe Biden won the district by almost 6 points. With a nearly full slate of candidate in Clay this year running as a team we will see if increased activity can make the district perform more like a presidential year than a local one.

Shanelle Benson-Reid is the candidate running for OCL 14. She is a mother, businesswoman, educator, and dynamic candidate. Already she is winning union endorsements and putting on a serious campaign. She can be found on Facebook at https://www.facebook.com/FriendsofDr.ShanelleRBensonReid, twitter at https://twitter.com/FriendsOfDrSRBR and on the web at https://friendsofdrshanelle.com/
0 notes
Text
Wonky Wednesday: Onondaga County Legislative District 13

Welcome back to Wonky Wednesday. Each week I do a deep dive into the election and registration data that makes up the electoral landscape of our home, Onondaga County. I hope by looking into this data we can glean that this everchanging county is not monolithic as once thought and competition for Democrats, and all registrations, can be found everywhere. This week start my #Fliptheleg series looking at each of the 17 Onondaga County Legislative races. Today I look at Onondaga County Legislative seat #13 which covers the western portion of Onondaga County including Van Buren, Elbridge, and the western part of Camillus.
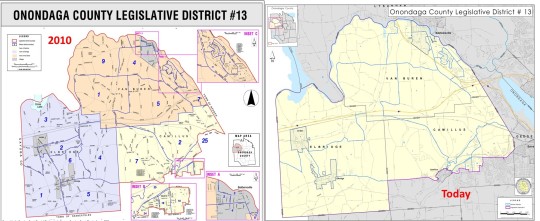
At the time of redistricting Robert Warner (R) was the legislator representing this portion of Onondaga County. The GOP majority on the redistricting commission barely altered the district only adding a bit more of conservative parts of Camillus. It was a safe GOP district for years and remained so, avoiding the weird shapes other districts fell victim to. The safe GOP nature of the seat though has led to several GOP primaries for the seat. This unlikely activity is only made possible because the Democrats rarely run candidates here and a slight civil war between the more moderate part of the GOP and conservative members have broken out.
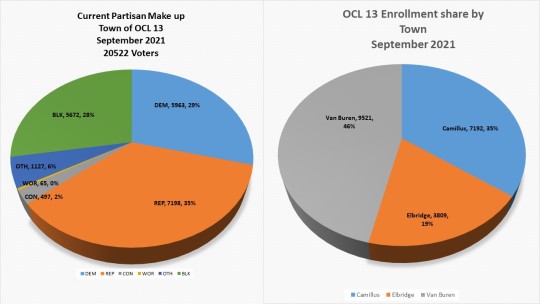
Though we do see some demographic change in this district. the GOP has a sizeable plurality of the district holding 35% of the voting population. The Democrats have just 29% of the voting population and non-enrolled make up 28%. This district is spread amongst 3 towns. Van Buren dominates the district representing 46% of the voting population. The western portion of Camillus has 35% of the population, while the entire town of Elbridge only has 19%.
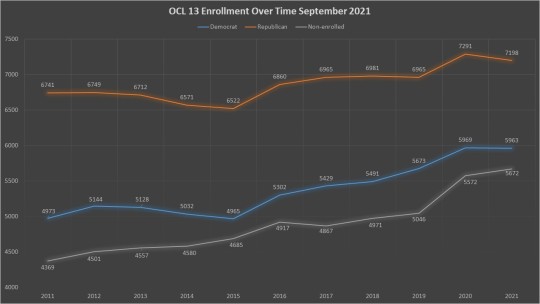
Democrats are gaining in this district, but like OCL 1 in Lysander they started from a large deficit it will be some time before they can catch up. The GOP added 457 voters, a rarity in the districts we have looked at. The Democrats though have gained over double that at 990 voters. The non-enrolled has seen the biggest growth, adding 1303 voters. The Democrats are gaining in this district, and we could see some significant gains in the future, but it may be a while before Democrats are competitive enrollment wise in the district.
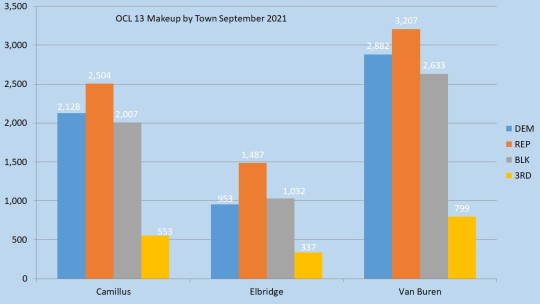
The three Towns of the district all are conservative as well. Van Buren is the dominant in population but the closes t in partisan differences. The western portion of Camillus though is the more conservative part of this now blue town. The GOP still dominate this portion of town. Elbridge is small in population, but its strong GOP lean really sets the tone in this district pushing it from a lean R to a strong R seat.
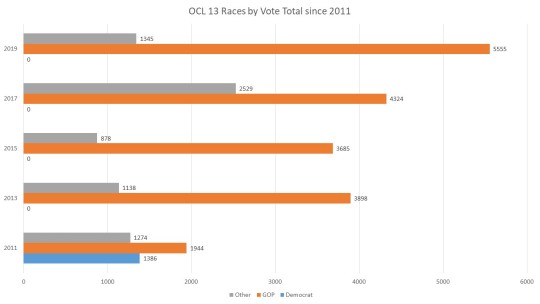
In 2011 Derick Shepard (R), ran a primary against sitting legislator Robert Warner (R). He was supported by Ryan McMahon and the more establishment wing of the party. He won his party and survived a three race against Warner and Jim Scaramuzzino (D). This was the last time Democrats put up a candidate in this seat, but there was a little bit of intrigue here. In 2013 and 2015 Derek Shepard ran unopposed and received conservative backing. However, in 2017 Ken Bush (R)challenged Derek Shepard on the GOP line and won the Conservative endorsement as well. The GOP were desperate to keep the seat in their loyal nominees’ hands and waged an expensive campaign with false claims of fraud to keep Bush off the ballot. The court case was thrown out on appeal and Bush won the GOP primary. Bush then ran unopposed in 2019.

The comparative races show a district that is as conservative as one would expect, but some signs of hope as well. In 2019 we saw strong showings for McMahon for county executive and Lisa Dell for County Clerk. Even Matt Beadnell who lost his comptroller race polled in double digits here. In 2020 congress showed a big loss for Dana Balter as expected. However, John Mannion performed in single digits in the district. Joe Biden lost this district by less than 2 points. This means in certain races the non-0enrolled are aligning with the Democrats and creating a formidable block.

Sara Aaserud is the Democratic candidate running in this district. She is an engineer, mother, business owner, and political newcomer. She felt it was important to run to offer voters a choice in her district. She can be found on Facebook at https://www.facebook.com/SaraForCountyLeg
0 notes
Text
Wonky Wednesday: Onondaga County Legislative District #12

Welcome back to Wonky Wednesday. Each week I do a deep dive into the election and registration data that makes up the electoral landscape of our home, Onondaga County. I hope by looking into this data we can glean that this everchanging county is not monolithic as once thought and competition for Democrats, and all registrations, can be found everywhere. This week start my #Fliptheleg series looking at each of the 17 Onondaga County Legislative races. Today I look at Onondaga County Legislative seat #12 which covers the southeast portion of Onondaga County including Tully, Pompey, Fabius, Lafayette, the lower portion of Dewitt and a tiny portion of Manlius and the City of Syracuse.
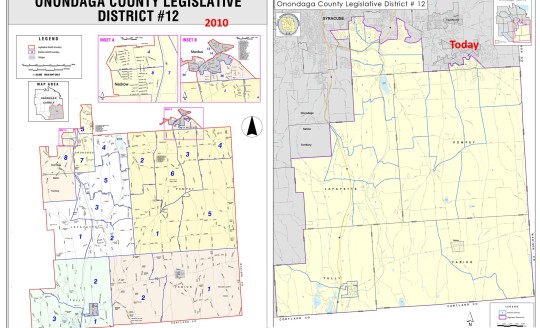
At the time of redistricting Robert DeMore (R) was the legislator representing this portion of Onondaga County. He decided not to run for re-election, this along with the reduction of two seats gave the GOP majority on the redistricting commission opportunities to reshape some districts to stack and crack Democratic areas of the County. Though this district avoided the weird shapes other districts fell victim to it was altered in significant ways. The Onondaga portion of the district was removed to shore up OCL 11 and since the district had a strong GOP lean, they put a sizeable portion of Dewitt and the South Campus portion of the City of Syracuse into the district. This diluted those Democratic areas pairing it with rural GOP dominated portions of the county.
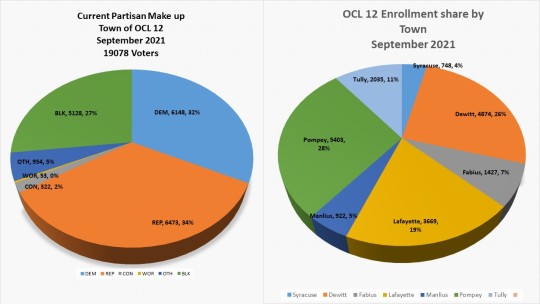
The district is not as blood red as it once was. The GOP only has a small plurality of the district holding 34% of the voting population. The Democrats have closed the gap and have 32% of the voting population and non-enrolled make up 27%. This district is spread amongst 7 towns making it one of the most diverse districts in the county. The largest portion of the district population resides in Pompey with 28% and Dewitt portion making the second largest portion at 26%. Lafayette has 19%, Tully 11%, Fabius 7%. And the tiny portions of Manlius 5% and Syracuse 4%.
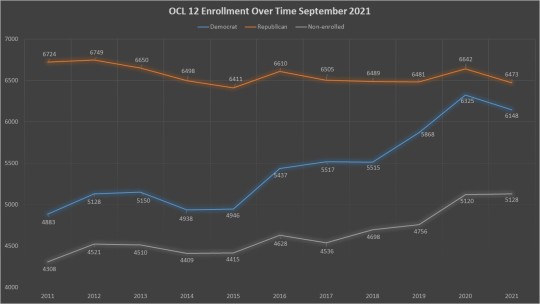
The adding of Democratic areas to the district has resulted in a district that has changed dramatically. The GOP has held steady only losing 274 voters. The Democrats have gained 1265 voters in the district. The non-enrolled has gained significantly as well with 820 voters. This shows that as populations grow once rural and suburban areas are becoming either Democratic or non-enrolled and the GOP has a shrinking plurality. Newer voters are either enrolling in the Democratic party or not enrolled at all and the older GOP population is shrinking through attrition.
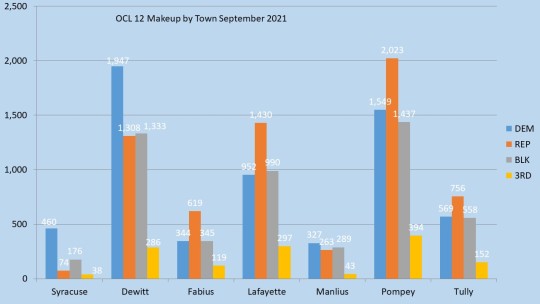
This district really is a story of two halves. The northern more Democratic part of the district dominated by the annexed portion of DeWitt and the small portions of Syracuse and Manlius represent the Democratic part of the district. The GOP part of the district is dominated by Pompey and Lafayette with Fabius and Tully as well. However if we look under the hood we see the GOP towns of Pompey & Tully have had increases in their Democratic population cutting into the blood red portion of the district.
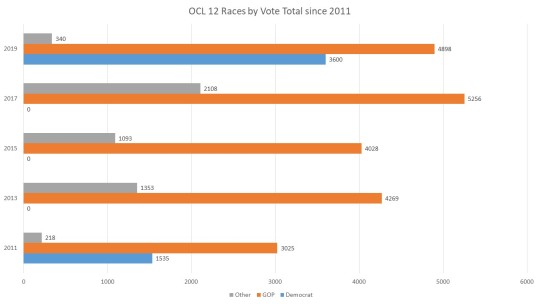
In 2011 Dave Knapp (R), the supervisor of Lafayette was selected to fill the open seat in the newly formed District 12. Philip Benedict (D) ran a campaign against him, but it was not well funded, and Knapp won easily by 1490 votes. The Democrats then did not run anyone against Knapp for the next three elections. In the meantime, he rose to majority leader and then Chairman of the legislature when Ryan McMahon became county executive. Jennifer Blusk (D) ran a vigorous race in 2019 focused solely on redistricting but still lost by 1298 votes.
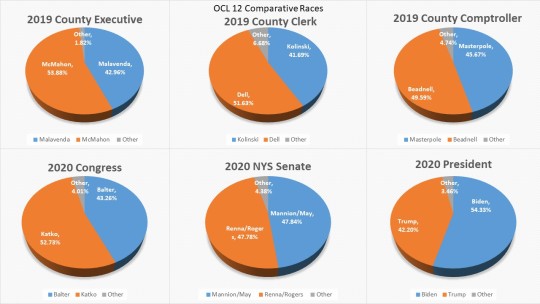
The comparative races show a district that is much more moderate than it would at first look. While McMahon won for County Executive in by a little over 10 points this was about ton average as his win countywide, but far under other suburban districts. Dell won by 10 points for County Clerk and Beadnell 4 points for County Comptroller, again underperforming their wins in other parts of the county. In 2020 Balter only lost this district by 9 points with 4 on the WFP line. This district shares NYS Senate districts but the Democrats of May & Mannion ran even in this district. Joe Biden won this district by 12 points.
Dr. Sunny Aslam (D) is the Democratic candidate for this district. He is a first-time candidate, doctor, and father. He has already made significant waves by outraising his opponent and mounting a vigorous campaign. Dr. Sunny can be found on Facebook at https://www.facebook.com/ElectDrSunny and on the web at
http://friendsofdrsunny.com/
0 notes
Text
Wonky Wednesday: Onondaga County District #11

Welcome back to Wonky Wednesday. Each week I do a deep dive into the election and registration data that makes up the electoral landscape of our home, Onondaga County. I hope by looking into this data we can glean that this everchanging county is not monolithic as once thought and competition for Democrats, and all registrations, can be found everywhere. This week start my #Fliptheleg series looking at each of the 17 Onondaga County Legislative races. Today I look at Onondaga County Legislative seat #11 which is in most of the Town of Onondaga and a portion of southeast Camillus
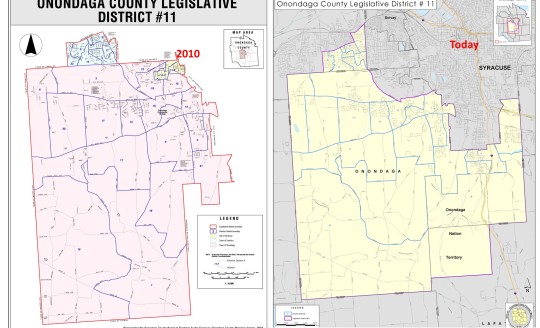
At the time of redistricting Patrick Kilmartin (R), the majority leader of the County Legislature, was the incumbent legislator. This seat needed to add population as it was one of the smaller suburban seats. The GOP majority on the redistricting commission decided to leave in the portion of Camillus in the seat but add the rest of the Town of Onondaga taking away from District 12. Though this district avoided many of the weird shapes other districts fell victim to, it curiously did not add all of Onondaga. That is because they needed that portion of Onondaga to be able to connect Geddes to the valley in District 15. When drawn this gave OCL 11 a decidedly conservative configuration.
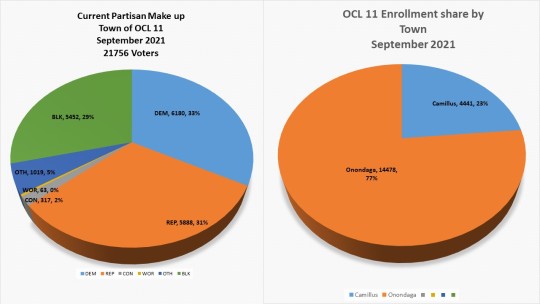
The district though has changed significantly as most suburban districts have. Democrats have grown significantly and have now taken a tiny plurality. Democrats account for 33% of the district while Republicans make up just 31%. Non-enrolled voters account for 29% of the registered voters coming within a couple hundred voters of overtaking the GOP. The Camillus portion of this district makes up 23% of the voting population while Onondaga takes up 77%.
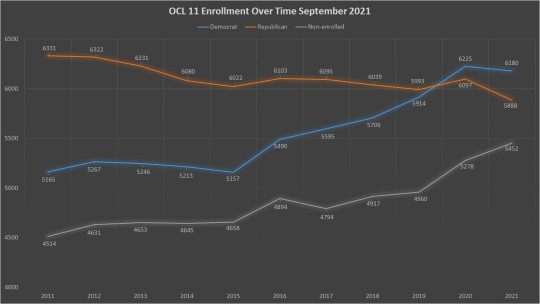
This suburban district is showing dramatic change from the last redistricting, Democrats have gained 1,015 voters while the GOP has lost 443. Non-enrolled voters have also seen significant growth gaining 938 voters. Once again the suburban backlash to 2016 seems to be the catalyst for the growth of Democratic enrollment. However GOP enrollment has seen a steady decline since 2011. There is also a curious sharp drop off since last year as Democrats have stayed about even and non-enrolled have grown. This indicates a significant shedding of the party label on the R side of the electorate.
The Camillus portion of the district may be smaller, but it is driving the Democratic lean of the district. In the Camillus portion Democrats outnumber the GOP by nearly 200 voters and the non-enrolled is less than 100 voters behind. The Onondaga portion of the district is more even. Democrats only outnumber the GOP by 5 voters. The non-enrolled in Onondaga are still several 300 voters behind.
In 2011 Patrick Kilmartin (R) was challenged by Buffy Quinn (D). The newly formed district worked in the way it was designed by nearly doubling up the margin. Kilmartin won that race by 1285 votes. Maggie Mahoney (D) than challenged Kilmartin in 2013 and nearly halved that margin losing by only 677 votes. The Democrats did not offer a candidate in 2015 and then Kilmartin decided not to run for re-election to become a Town Justice. In 2017 in an open seat John McBride (R) ran against Chuck Keller (D) and the margin closed to just 408 votes. In 2019 running as an incumbent McBride bested Irene Workman (D) by 621 votes. In both McBride races though, the Democrats won vote totals on the Democratic Line versus the GOP line, and it was minor parties that brought McBride home. McBride was also working for then Senator DeFrancisco and Antonacci in his races and benefited from those connections.
The comparative races are our show a district that performs better for the GOP that county averages, but if you look at just suburban districts it is one of the better performers for Democrats. In 2019 Ryan McMahon won handedly in the district by close to 13 points, better than his overall county win margin but much less than his totals in another suburban district. The same story for Lisa Dell for County Clerk who won by 16 points, in a rare performance better than McMahon. Matt Beadnell only won this town by less than 3 points, showing the district rejects ultra-conservative Trumpian candidates. In 2020 Balter lost this district over 14 points with nearly 5 points on the WFP line, however again it performed better than another suburban district. John Mannion won a sizable victory for State Senate here winning by nearly 6 points. President Biden won this district by over 12 points. This shows this district to be a swing district and ripe for a Democrat to perform well in.

Ryan Suser (D) is the Democratic candidate for this district. He is a first-time candidate, lawyer, and family man. He successfully defended the Democrats when the GOP, including his opponent, tried to knock Working Families Party members off the ballot. Ryan can be found at Facebook https://www.facebook.com/RyanSuser & Twitter https://twitter.com/ryansuser & on the web at https://vote-ryan.com/
0 notes
Text
My Testimony to the NYS Senate Elections Committee Hearing on BOE Reform 9/21/21
(Below is my written testimony as submitted to the NYS Elections Committee Hearing on BOE Reform in Albany, NY on September 21, 2021. I present this to the public in an effort to further educate on elections matters as well as being transparent.)
My name is Dustin M. Czarny and I am the Democratic Caucus Chair of the New York State Elections Commissioner Association. I have also served as Onondaga County’s Democratic Elections Commissioner since 2013. Previously I spent 4 years as Legislative Chair for the NYSECA. Before becoming Commissioner I had an extensive portfolio of work with the Onondaga County Democratic Committee and local campaigns. I would like to thank Senator Myrie and the NY Senate Elections Committee for the opportunity to once again provide testimony on this important subject.
Throughout my entire political life I have worked on making it easier for citizens to vote. This quickly led to my interest in the cause of Election Reform. Throughout my time as a volunteer campaign worker, I had been frustrated at New York’s low turnout rates and the lack of voting opportunities. I was surprised that a liberal state such as New York was consistently behind major election reforms. Early Voting, No Fault Absentees, Automatic, Online, and Same-day registration were tools that other states, even deep red states like Texas, had that New York didn’t.
I fought for election reform before becoming Commissioner and I fight for it every day since. As I have navigated the New York electoral system I have become frustrated with the slow legislative process. The glacial pace of New York election reform turned into a flood in 2019 with the unified Democratic legislature. Long needed reforms such as Early Voting , June Primary, portable registration, electronic poll books, uniform primary polling hours, state-wide re-canvass provisions of close elections, increased election district sizes, and online & automatic voter registration have been passed by this body. In addition, the voter will have a choice of adding no-fault absentee and Same-day registration to our arsenal of improvements this November.
It is an exciting time to be both an Elections Commissioner as well as reformer. That being said the pace of these reforms have not always been matched with funds and time to adjust. Many of these changes have been implemented during the height of the COVID-19 pandemic straining the meager funding and even the health of Elections Commissioners. In my testimony today I hope to provide avenues that we can enhance and strengthen our Board of Elections to meet the needs of New Yorkers today and into the future.
Bipartisan Boards of Elections are our best tools to serve New York Voters
It is my strong belief that the bi-partisan model for New York Election Administration remains the best model for serving the voters of New York. The county party nominated and legislature approved Elections Commissioners from both of the major parties gives a uniquely local perspective to Election Administration. In its best practice the commissioners work as a team identifying needs of the local community. They work with the legislature to adequately fund the elections board with as little influence as possible. They work with community non-profits and government agencies to identify polling places. They work with their local parties to recruit and staff those polling places.
In the age of hyper partisanship, the New York Board Bi-Partisan electoral system has served as a bulwark against the vitriol we have seen in other places in the country. Having representatives of the major party intricately involved in every election aspect provides a checks and balance to assuring election law is followed. It also provides assurances to partisans that one party or ideology is not dominating or tainting the process. Election results are accepted and outcomes verified.
That does not mean that our system works perfectly nor does it always reach our highest ideals. The Boards of Elections are subject to the partisanship we see at local governments. Often County legislatures try to intercede in election administration by stripping budgets or even threatening nominations of individual Commissioners they disagree with. County Executives that cannot control the offices hiring treat Boards of Elections as bastard step-children with minimal funding allocations. Commissioners themselves often can disagree, especially where there is no legislative formula to reach a conclusion, on our most partisan matters.
The solutions though are not to scrap the entire system. Some advocates offer the solution would be to put non-partisan administrators into our jobs. I contend that this would create more problems while not dealing with the structural issues that causes failures now. Single administrators would have to be appointed and serve at the pleasure of local governments. In other states local elected leaders form hiring panels. This would allow partisans to gain control over local boards through the hiring, and firing process. In a deeply diverse state like New York, where upstate counties are dominated by Republican elected officials and downstate counties dominated by Democrats we could see vastly different electoral philosophies enacted creating confusion and tension. Our solutions must not create more problems than they hope to fix.
The differences in Upstate and New York City Boards
It is important to note that not all of electoral system in New York is the same. In fact, the structure of the New York City Board of Elections is vastly different than the rest of New York State. Throughout most of New York State, the Board of Elections is run by the two Elections Commissioners. These Elections Commissioners are usually full time county employees that run the day to day business in the office. Each side is afforded an equal amount of staffing and the individual commissioner has hiring power for their side, though it usually takes two commissioners to agree to fire an employee for cause. This gives the commissioners authority and responsibility over the day to day functions of the office.
In New York City the 5 counties are fused together into one agency. The Elections Commissioners form a ten person panel that meets on a monthly basis. The Commissioners themselves are not tasked with the day to day running of the office. They hire an Executive Director and Deputy executive Director from either party. Since the individual sides do not have hiring authority over their side and the two top positions are no co-equal in status this can lead to deal making and a lack of oversight and authority.
New York City is part of my caucus of commissioners and as such the caucus has taken a position on structural reform suggested for New York City. Furthermore, I am from upstate and never having been a citizen of New York City, I hesitate to weigh in on the many issues raised with New York City Board of Elections. However as a personal note I find the suggestions offered by New York State Board of Elections Commissioner Douglas Kellner more in line with how the rest of New York State operates. Having two full time Commissioners with equal power directly involved in the day to day operation of the Board of Elections is a model that generally works well.
Lessons from NY 22
Upstate New York Boards were the focus of the #NY22 Congressional Election. The various twists and turns of the absentee ballot count was part of a national spotlight. Certainly mistakes were made and the intensity of the national spotlight amplified these issues. It was an Election Administrator’s nightmare and though Onondaga County was not part of #NY22, I was in the same media market. In my opinion most of the issues such in this case can be summed up into three categories, the unprecedented use of absentee ballots, the staffing inequities of the 8 counties that made up #NY22, and the malfeasance of the Oneida County Board of Elections.
The unprecedented use of absentees caused unforeseen issues in our electoral process. Before 2020, New York was almost exclusively an in-person voting state with absentee voting limited to an excuse-based system. In a typical election, less than 3 percent of all ballots would be cast using this method. In 2020 with a pandemic raging in unvaccinated society, counties saw a dramatic increase in their use overnight as COVID-19 became a valid excuse for all citizens. My county saw an increase to 26% of our ballots cast in the 2020 General Election, and massive increase. The County Boards were incredibly successful at delivering the absentee ballots to the voters and deserve praise for this massive effort.
However, the large influx of absentees created an unanticipated challenge. In New York, absentees and affidavit ballots are not counted until after Election Day. With a large increase in absentee ballots the number of races without assumed winners on Election Night rose dramatically. Worsening matters was the fact that national political messaging created an absentee universe that was favored by one political party as Democrats took advantage of this election tool while Republicans shunned mail balloting for in person election-day voting. This created a perverse incentive to challenge mail-in ballots in all close contests. Our challenge system for absentees was antiquated and did not anticipate these once in a generation circumstances. Many of the failures of county boards in #NY22 and even in my own board dealt with this circumstance.
It is also important to note that many of the Boards of Elections involved in #NY22 are smaller boards with limited staff. These “micro-boards” often only consisted of two Commissioners and two deputies. Sometimes the Commissioners were full time, sometimes part-time. While there were some grants available to help temporarily increase staffing for the 2020 Election, much of those grants went to the inordinate cost increases with more mail balloting and budget cuts from the county levels in the middle of the pandemic. A simple fact is many counties have not allowed County Board of Elections to increase staff to meet the needs of all the reforms we have seen over the last few years. On top of that COVID-19 outbreaks limited staff in many boards during the time of the post-election canvass.
The most egregious issues in #NY22 were reserved to the Oneida County Board of Elections. During the court process we learned that hundreds of affidavit ballots were improperly ruled on as the procedures put in place for universal portability of voter registration. We also learned the structure they chose for challenges was inadequate and did not follow a chain of custody. However the most troubling was the late revelation of the failure to register several thousand DMV voter registrations. I can’t stress to you enough how horrendous this decision was. We may never know how many voters were turned away who properly registered and in a contest of less than 150 vote margin it is an inexcusable failure to do our most basic job. These decisions resulted in the eventual replacement of these Commissioners.
While many of the mistakes in #NY22 may not be repeated in non-pandemic years, it is important we learn from the shortcomings that were exploited. Mandatory training, oversight of the State Board of Elections, and proper funding of county Board of Elections will solve some of these issues. Wholescale election reforms of the way we count absentees anticipating a more universal use of this election process will also go a long way towards not repeating these mistakes in the future.
Future Legislation must not only provide resources but clear direction
The New York State Legislature has taken many steps to help voters over the last few years. These reforms are welcome by the Democratic Caucus of Legislators. In most cases, the Boards of Elections have been successful in implementing these reforms. We have also done that in the middle of a pandemic with ever increasing fiscal frugality. Where Boards of Elections have come up short is when funding for increase spending has not been provided and clearer direction not given by the legislature.
I have come to Albany yearly since 2014. I have stressed the need for the State Government to take a more active role in funding Boards of Elections. The New York State Legislature has responded and I want to thank you for your commitment to Democracy. I must emphasize though that New York State cannot solely fund elections. We need a commitment from our host counties to funding the building blocks of our Democracy. Often the increase in funding from the New York State would be used to offset budget cuts at the local level. New York State Election Law requires the counties to provide an adequate amount to run the Board of Elections. Often these counties reject or ignore the recommendations of its Commissioners often for petty partisan reasons. Standard staffing levels based on voter populations are desperately needed to continue to serve the voters.
We also need clearer guidance so we can adequately make decisions right for our community. Currently there is no requirement for annual training for Elections Commissioners. There is little in Election Law on transparency of data and commissioners disagree about what data is public and what is not. We don’t even have a mission statement on what our main purpose is. Many of us want to do everything we can to ensure the public’s right to vote but run into resistance from county lawmakers and even some Commissioners who believe our mission is to spend as little money as possible. While one size fits all legislation is frowned upon we can craft legislation that gives guidance based on voter registration to ensure that citizens in each county are offered a basic level of service they are entitled to.
The New York Legislature is already making changes in legislation that will help improve Board of Election functions. The mandatory expansion of Early Voting sites and counting of absentee ballots before Election Day will eliminate many of the tensions we have seen throughout the last few years. Once Constitutional Amendments for No-Fault Absentee and Same-Day Registration is enacted by the voters quickly coming up with enabling legislation will be important to giving Boards of elections time to implement those reforms. We also need to start mandating the use of technology like Electronic Poll Books and Ballot-On-Demand printers that will make implementing current and future reforms easier.
Funding and Empowering State Board of Elections is vital to a healthy electoral system
One tool we can utilize to bring about equity throughout New York is the State Board of Elections. Often we are burdening the State Board with the responsibility of carrying out some of New York’s most vital functions. In addition to Campaign Finance Enforcement, recording and now public finance, we are now asking them to handle online and automatic voter registration. While strives towards properly funding the State Board, it is my opinion they don’t have the adequate funds to achieve the many missions we have saddled them with.
We also need to give the State Board of Elections more authority to discipline and regulate County Board of Elections. The situation in Oneida County in #NY22 highlighted a loophole in our current system only the Governor can remove Elections Commissioners for cause yet the Governor’s office was unwilling to act. Furthermore the Executive Branch is not intimately involved with county Boards of Elections and cannot adequately ascertain issues before they reach a calamitous level. The NYSBOE already works with NYSECA on bi-annual conferences that can be the basis of training and certification for Elections Commissioners. We must make it mandatory, compelling counties to send Commissioners to these training sessions. We must also give the authority for removal and disciplinary actions to NYS Board of Elections and mandate they use it when warranted.
Giving County Commissioners freedom and authority to put the voters first
I believe it is important for local parties to be able to pick Commissioners that know their community can act in the best interest of the voters. Commissioners, however, are under partisan attack often from their own County Legislatures. This last year we have seen County Legislators try to block party nominees in Monroe and Chataqua County. These delays were not due to the merits of the party nominee but the preference of another candidate the county legislature wanted. We also routinely see salaries of Commissioners being threatened for going over budget or enacting pro-voter policies not favored by the County Legislature governing bodies. I experienced this myself in the wake of the 2020 election. Though that situation was resolved through massive public outcry, Election Commissioners should be protected from this partisan targeting so we can do our jobs.
To properly shield Elections Commissioners from these types of abuses small changes in election Law could be enacted. Four year terms will allow an Election Commissioner time to learn all of the cycles of our New York electoral landscape while not having to worry about running for re-election with every decision they make. Commissioners should have their terms staggered so we would lessen the possibility of two brand new Commissioners starting at the same time. We have a full time political calendar now in New York; we need dedicated full time Commissioners with salaries competitive with other county department heads in their county. Making these changes will attract Commissioners who want to put voters first and protect them while they do so.
Board of Election reform Recommendations
I urge the New York State Legislature to make the following reforms to Boards of Elections to help improve our electoral system, protect Election Administrators, and put voters first.
1.) Pass minimum staffing levels for County Board of Elections. Voters in every county should be treated with minimum services by our Boards of Elections. Counties should provide minimum staffing levels based on voter population so the voters have a fully staffed Board of Elections able to implement the voter reforms the legislature passes.
2.) Make annual training for Elections Commissioners mandatory and certified through New York State Board of Elections. By making training mandatory we will ensure all Commissioners are up to date on the ever changing landscape of our electoral process as well as ensuring their counties pay for and send them to this training.
3.) Give the State Board of Elections authority to remove and discipline non-compliant Commissioners. Currently there is little penalty for ignoring deadlines and election law. We need the NYSBOE to have the authority to discipline and remove non-compliant Commissioners to protect voters against incompetence or malice.
4.) Mandate all elections Commissioners are Full Time employees with competitive salaries. The New York Political Calendar is year round with election events in every part of the year. We need hand-on election Commissioners who can dedicate their time to running our most important building block of our Democracy, the county Board of Elections. Salaries should be commensurate with the mean of other county department heads in their counties to attract the best candidates.
5.) Mandate 4 year terms for Elections Commissioners with staggering terms. Four-year terms will give Commissioners time to learn the jobs and the distance from re-election to make unpopular but correct judgements that may go against their own party. Staggering the terms will decrease the possibility that two new commissioners will start together in the same office. Commissioners in the party that receives the most votes for Governor would have their four year term start in January of the Presidential Election, opposite party Commissioners could start in January of a Governor Election.
6.) Mandate for transparency for Boards of Elections. We should mandate that official Board of Elections meetings are subject to open meeting laws and must be properly noticed to the public. Boards of Election decisions should be transparent and open to public scrutiny. We also should be open to taking comments from the public to further the ultimate goal of having better elections. Decisions that affect the public should be made in the light of day and Commissioners should have to explain their rezoning.
7.) Mandate by 2024 the use of Electronic Poll Books on Election Day. While almost all Boards of Elections use Electronic Poll Books for Early Voting many have been resistant to implementing them on Election Day. To provide for counting of absentee ballots before Election Day and Same-Day Registration we need these tools at the polling places on Election Day. Ultimately this will save hundreds of staff hours in voter history recording post-election and make implementation of Same-Day Registration and vote-center models easier. Giving a date now will allow Boards to start the transition over the next few years.
8.) Have a dedicated stream of capital funding to invest in technology to make voting easier in New York. The key to making voting easier is to modernizing our fleet of voting machines, implementing electronic poll books, and investing in our Board of Election websites to give more accurate and vital information to voters. We need a dedicated predictable source of funding to help counties transition from equipment that may be over 15 years old to modern equipment that saves time, is more accurate, and ultimately produce better results.
9.) Allow technology to help reduce human error in the ballot re-canvass process. Last year, the Governor insisted on a statewide recanvas for close contests. While I was in favor of it in concept the resulting legislation is too broad and will drag some contests farther past Election Day without the possibility of changing the results. Instead of hand counting all races within .5% we should allow a separate scanner to scan ballots when the margin falls between .25% and .5% and only do a hand count for ultra-close contests under .25%. This way we are focusing on the races that can change while giving some assurances for most close races.
10.) Mandate data transparency for all interested parties in New York elections. The NYS legislature should empower the State Board of Elections to come up with regulations on which data held by Boards of Elections is public knowledge and how such data can be shared with interested parties. We should mandate scanned ballot images should be available to all interested parties post-election. By mandating this transparency we can give assurance in election outcomes while requiring all counties to provide a basic level of service.
11.) Move to a state-wide registration vendor. Currently in New York we allow each county to choose its own vendor for registering voters. Each vendor must comply with NYSVOTER as the statewide list is the official registration record. However it would behoove New York to have one vendor for all counties. This would make implementing automatic voter registration,
online registration, same-day registration, and a host of other election reforms easier and more cost efficient.
I believe by implementing these reforms, none of which require a constitutional amendment, we can see real and lasting results for New York voters as well as the Board of Elections. I am happy to work with the New York State legislature to craft legislation to meet these goals above and will gladly take any questions the committee may have.
Sincerely,
Dustin M. Czarny
Democratic Caucus Chair, NYS Elections Commissioner Association
Democratic Elections Commissioner, Onondaga County Board of Elections
1 note
·
View note
Text
Wonky Wednesday: Onondaga County Legislative District 10

Welcome back to Wonky Wednesday. Each week I do a deep dive into the election and registration data that makes up the electoral landscape of our home, Onondaga County. I hope by looking into this data we can glean that this everchanging county is not monolithic as once thought and competition for Democrats, and all registrations, can be found everywhere. This week start my #Fliptheleg series looking at each of the 17 Onondaga County Legislative races. Today I look at Onondaga County Legislative seat #10 wholly contained in the middle to Southeast corner of the Town of Manlius.
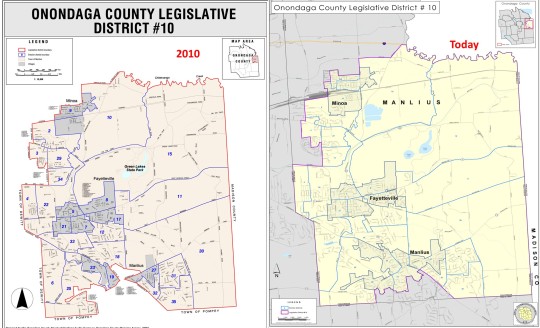
This was virtually unchanged from the 2010 version of the seat. At the time of redistricting Kevin Holmquist (R) was the incumbent legislator. Kevin was a former Minoa village board member, so it made sense that the only change the GOP majority on the redistricting commission made was to add more of the village of Minoa into the district avoiding the weird shapes many other districts fell victim to. They also added portions of the village of Manlius into the district as well so it was completely in the district. The district was already a solid GOP district and it didn’t need a shape change to give the GOP an advantage.

The district though has changed significantly. Once a solid red district, Democrats have now taken a sizeable plurality. Democrats account for 36% of the district while Republicans make up just 29%. Non-enrolled voters account for 28% of the registered voters coming within a couple hundred voters of overtaking the GOP. Since this district is totally inside one town we have to look at other ways to glean information. Luckily this district is the only one with 3 individual villages inside of it. The villages of Fayetteville (15%), Minoa (10%), & Manlius (15%) make up 10% of the voting population of the district.
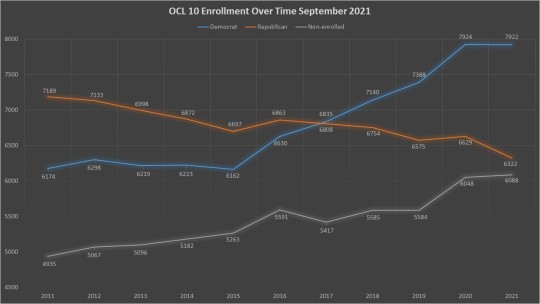
There is no district that has changed as drastically from 2011 as this one. The 10th district, like Manlius as a whole, is the perfect example of what has happened to the suburbs nationwide as Democrats have grown in strength and popularity during the Trump era. Democrats have gained 1,748 voters since 2011 while the GOP has lost 867 voters. The non-enrolled has gained the most though by increasing its population by 1,153 voters. This has flipped this district on its head. Where the GOP once had a 1,015 voter lead, the Democrats now hold an amazing 1600 voter lead.
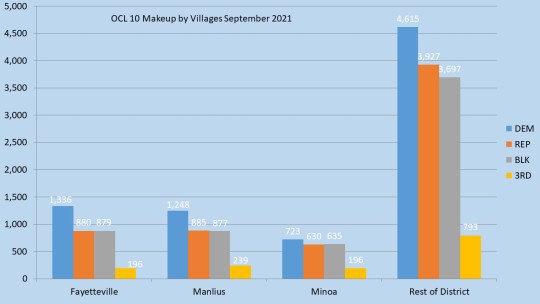
The three villages are as a whole are slightly more Democratic than the rest of this district. The village voters are 37.9% Democratic where the rest of the district is just 35.4% Democratic. Still even inside the villages there are differences with Fayetteville being the most Democratic at 40.6%, followed by the village of Manlius at 38.4%, and village of Minoa 33.1%. This makes Minoa one of the least Democratic areas in the district, though all 4 areas we are looking at lean Democratic like the district as a whole.
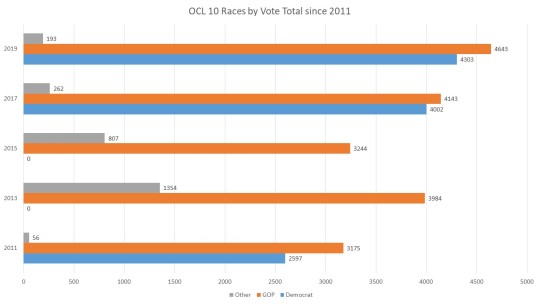
In 2011 Kevin Holmquist (R) was challenged by Gwen Mannion (D). It was a hard fought race however Holmquist survived by 578 votes. The Democrats than took two cycles off not challenging this seat in 2013 and 2015. However in the wake of the 2016 election the Manlius Democratic committee had a resurgence of new activists working along with established committee members. This resulted in full town slates including on the County legislative level. Mark Matt (D) ran in 2017 & 2019 against Kevin Holmquist (R). Though Matt lost by 141 and 340 votes they were within the absentee ballot marker. Another indication of how well the Democrats were performing was winning town wide seats in 2017 and 2019. Finally in all three contested races the Democrats ran even or better than the GOP on straight up party line comparison with the 3rd party votes putting Holmquist over the top.
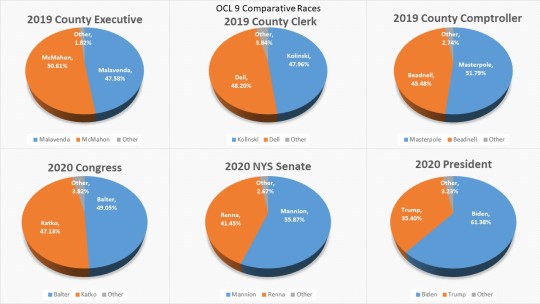
The comparative races are our best indication of a district primed for movement. Though in 2019 it did support Ryan McMahon it was only by a little over 3 points. The county Clerk race was virtually tied at .24% difference, and Masterpole really performed well here beating Beadnell by over 6 points. All 3 races performed better than the county averages. The Democrats really cleaned up in this district in 2020 with Balter almost having a 2 point lead on Katko making this one of her better suburban districts. John Mannion trounced Angie Renna by over 14 points, and President Biden almost had a 26 point lead over Trump. The residents of this district are consistently voting Democrat by larger shares than the county as a whole.
Heather Allison Waters (D) is the Democratic candidate for this district. She was part of the 2019 Democratic wave that took control of Town Government and was the highest vote getter. Kevin Holmquist (R) has decided not to run making this an open seat. With the voting history and strength of the Democratic candidate this is certainly a prime seat to watch for a possible flip. Heather can be found at Facebook https://www.facebook.com/electheatherwaters & Twitter https://twitter.com/ElectWaters
0 notes
Text
Wonky Wednesday: Onondaga County Legislative District 9

Welcome back to Wonky Wednesday. Each week I do a deep dive into the election and registration data that makes up the electoral landscape of our home, Onondaga County. I hope by looking into this data we can glean that this everchanging county is not monolithic as once thought and competition for Democrats, and all registrations, can be found everywhere. This week start my #Fliptheleg series looking at each of the 17 Onondaga County Legislative races. Today I look at Onondaga County Legislative seat #9 representing the mostly the Eastwood and Lincoln Hill portions of Syracuse but stretching into the university and East side along with a few blocks of Sedgewick.
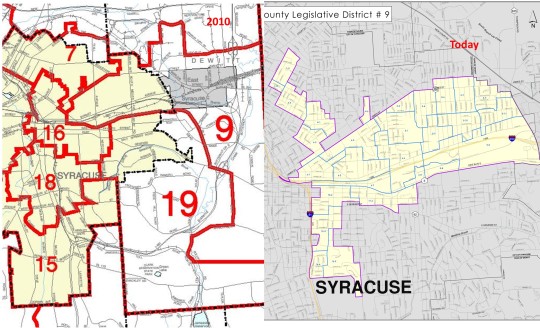
This seat went under dramatic changes in 2010 as it was basically combined with the old OCL 7 and drawn in a way to consolidate Democrats under one representative. Both Sam Laguzza (D) in neighboring OCL 16 and Tom Buckle (D) in neighboring OCL 7 were not running for re-election. This along with the loss of 2 OCL seats gave the GOP majority on the redistricting commission another opportunity to stack and crack Democrats into one district using weird shapes to re-draw districts to benefit a GOP supermajority. They took portions of OCL 7 and OCL 16 and packed them into the new OCL 9 making a very safe Democratic seat and even made sure OCL 9 extended a few blocks to encompass the house of OCL minority leader Mark Stanczyk (D). This assured a strong incumbent was relegated to a safe Democrat seat allowing Danny Liedka (R) to run for the newly drawn OCL 7 and win.
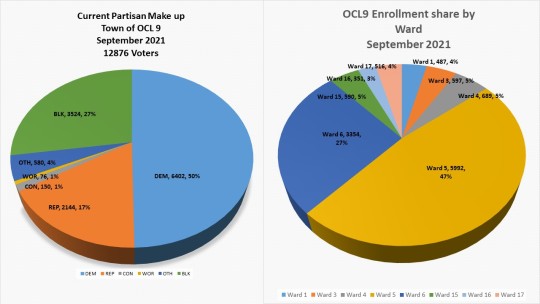
The redistricting created a legislative district that is overwhelmingly Democratic. Democrats account for 50% of the district while Republicans make up just 17%. Non-enrolled voters account for 27% of the registered voters outnumbering the GOP voters by quite a bit. This district is one of only two that is wholly inside the City of Syracuse. It is mostly dominated by Eastwood (Ward 5 47%) and Lincoln Hill (Ward 6 27%) but has portions of the Northside (Wards 1 4%, Ward 3 5%, Ward 4 5%) and the University (Ward 16 3%), and the east side (Ward 17 4%).
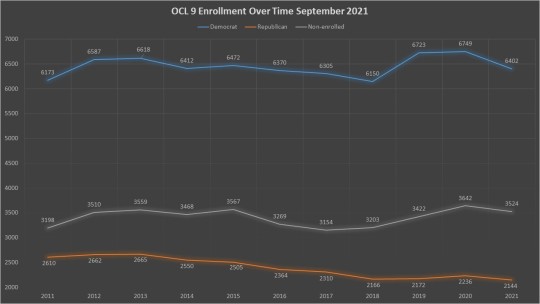
Like the City of Syracuse that encompasses it his Democratic district has only gotten more Democratic over time. Since 2011 the Democrats have gained 229 voters and the GOP has lost 466 voters. Non-enrolled has grown by 326 voters. All three populations have seen a decrease in enrollment since the 23020 election. This is because urban cores usually lost voters after a Presidential election when lists are cleaned up. This is especially so with university districts where graduating students move and incoming freshman may not decide to enroll in their new community right away.
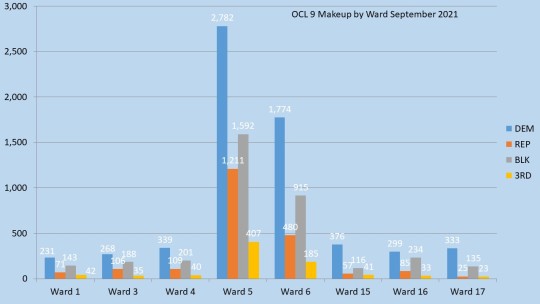
There really isn’t a GOP friendly portion of the district, though Eastwood (Ward 5) is less dominated by Democrats than the other portions of the district. There are 230 percent more Democrats than GOP in Ward 5, compare with 370 percent in Ward 6, and 403 percent more Democrats in the rest of the district So Eastwood dominates the district in population and is slightly more conservative than the rest of the district.
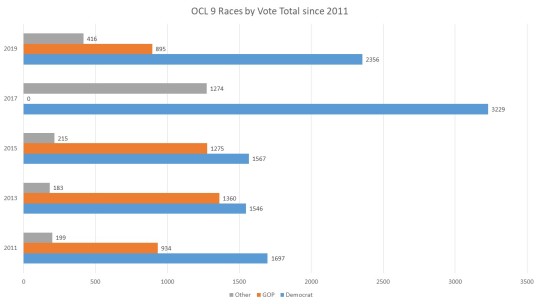
In 2011 Bob Andrews ® challenged incumbent Mark Stanczyk (D) and lost by 763 votes. The district was drawn to be Democratic and performed that way. Mark Stanczyk then took a job with Onondaga County in 2014 and Bob Andrews was selected by then County Executive Joannie Mahoney to fill his vacancy. It was short lived though. Even the power of incumbency and name recognition could not save this seat for the GOP. Peggy Chase (D) defeated Andrews by 186 votes. Two years later in a re-match Peggy Chase successfully defended her seat winning by 292 votes. The GOP did not run a candidate in 2017 and in 2019 in a three way race Chase won over Kevin Kuehner (R) by 1461 votes.
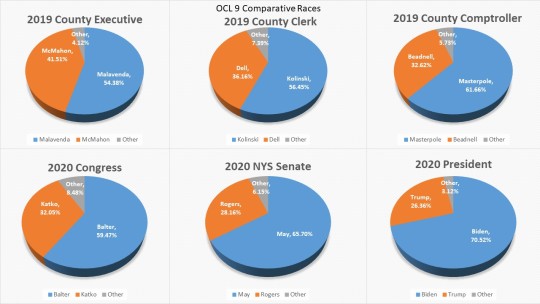
The comparative races also show a district that is dominated by Democrats. In 2019 the district supported the Democrat in all 3 races with a 13-point margin for Malevenda for County Executive, over 20-point margin for Kolinski for County Clerk, and an outstanding over 29-point margin for Marty Masterpole in the Comptroller race. In 2020 Dana Balter solidly beat Katko by over 27 points without even looking at the votes on the WFP line for another candidate who was left on the ballot due to an error. Rachel May dominated the NY Senate run winning over 37 points. Biden saw an overwhelming support with an over 44-point margin of victory.
Peggy Chase (D) is the current representative of OCL 9 and has a GOP challenger this year. Peggy is a dedicated retired nurse who fought for expanding healthcare services during the pandemic only to be shot down by the GOP caucus. Her GOP challenger is well funded and connected in Eastwood so this race may be more competitive than in past elections Peggy Chase can be found on Facebook at https://www.facebook.com/PeggyChaseForSYR and on Twitter at https://twitter.com/PeggyChaseSYR
0 notes
Text
Wonky Wednesday: Onondaga County Legislative Seat District 8

Welcome back to Wonky Wednesday. Each week I do a deep dive into the election and registration data that makes up the electoral landscape of our home, Onondaga County. I hope by looking into this data we can glean that this everchanging county is not monolithic as once thought and competition for Democrats, and all registrations, can be found everywhere. This week start my #Fliptheleg series looking at each of the 17 Onondaga County Legislative races. Today I look at Onondaga County Legislative seat #8 representing the west side of Syracuse and a portion of Geddes.
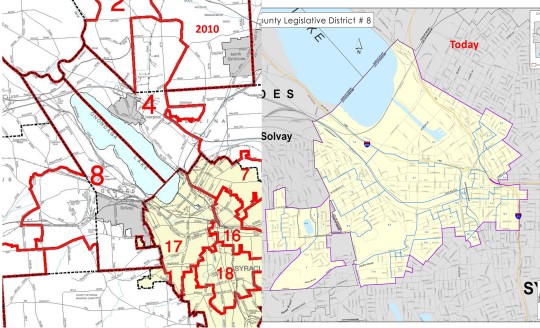
In 2011 this seat radically different then today. The 8th legislative seat was wholly in the town of Geddes and represented by James Corbett (R). The neighboring district, OCL 17 inside the City of Syracuse was represented by Martin Masterpole (D). Both Corbett and Masterpole had decided not to seek re-election. This gave the GOP majority on the redistricting commission another opportunity to utilize weird shapes to re-draw districts to benefit a GOP supermajority. They took the Lakeland portion of and moved it into the district 4 to make it more of an even district. They then took Solvay and other portions of Geddes and put it into OCL 15 a snake like district that benefitted commission member Ryan McMahon in his eventual run. Finally knowing Chris Ryan had announced plans to run they extended the old 17 into the portion of Geddes where he lived. While this was eventually good for Chris Ryan, the moves benefitted 2 other GOP hopefuls to create the supermajority they coveted. It is the very definition of stacking and cracking.
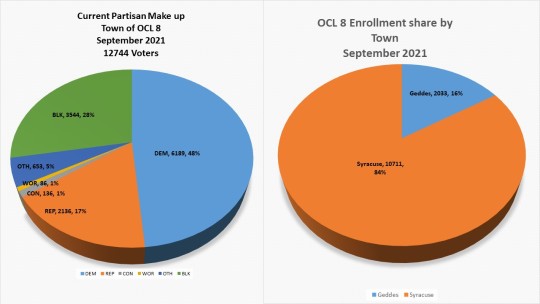
The redistricting created a legislative district that is overwhelmingly Democratic. Democrats account for 48% of the district while Republicans make up just 17%. Non-enrolled voters account for 28% of the registered voters outnumbering the GOP voters by quite a bit. The city of Syracuse dominates the district with 84% of the voters. The Geddes portion of the district, nicknamed the Ryan peninsula, has just 16% of the voters.
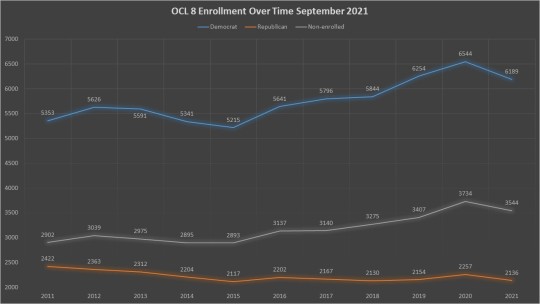
This Democratic district has only gotten more Democratic over time. Since the city dominates this district, it reflects the City of Syracuse ever increasing Democratic enrollment. Since 2011 Democrats have gained 836 voters. The GOP has lost 286 voters and started off in a major deficit. The non-enrolled has grown by 642 voters.
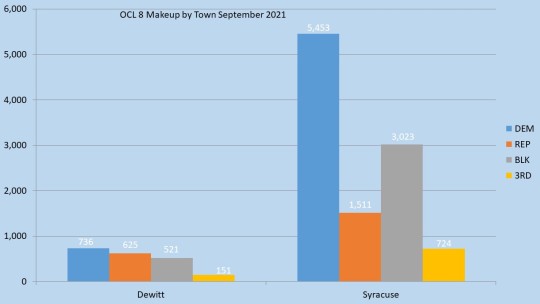
The city portion of the district not only dominates in enrollment numbers but drives the partisan split in the district. The Syracuse portion of the district is dominated by the Democrats. The GOP runs a distant third to the non-enrolled. The Geddes portion of the district is a bit more even. Democrats have a small plurality, and the GOP is in a close second with the non-enrolled right behind. This tends to mimic Geddes overall as the Syracuse side of the district mimics the city enrollment.

It is important to remember this district was drawn to not be competitive. They stacked as many Democrats into this district as well as an emerging Democratic candidate to protect other suburban seats. This worked so well the GOP barely puts up candidates. Chris Ryan ran unopposed in his first election in this district in 2011 as the GOP focused on solidifying their super majority. In 2013 Russ Andrews a former county legislator came out of retirement to challenge Chris Ryan and was easily defeated losing by 913 votes. In 2015 Chris Ryan once again was unchallenged. In 2017 little known GOP candidate James Laspino challenged Ryan and fared even worse, losing by 1924 votes. In 2019 and again this year Chris Ryan faces no challenger.
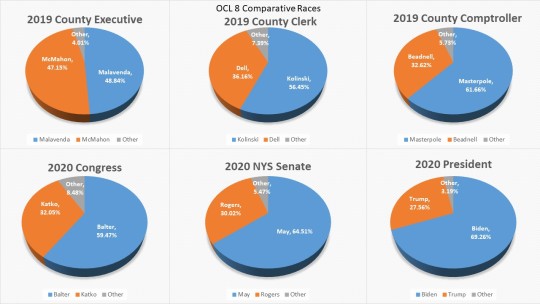
The comparative races show a district that is dominated by Democrats. In 2019 the distractive supported the Democrat in all 3 races with less than 2-point margin for Malevenda for County Executive, almost over 20-point margin for Kolinski for County Clerk, and an outstanding over 31-point margin for Marty Masterpole in the Comptroller race. In 2020 Dana Balter solidly beat Katko by over 27 points without even looking at the votes on the WFP line for another candidate who was left on the ballot due to an error. Rachel May dominated the NY Senate run winning over 34 points. Biden saw an overwhelming support with a nearly 47-point margin of victory.
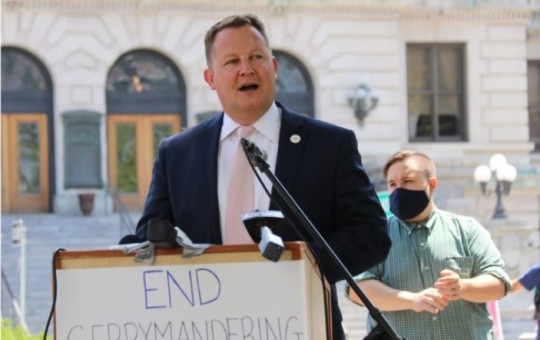
Chris Ryan is the current county legislator in OCL 8 and is running for re-election. He was a redistricting champion bringing the issue of gerrymandering to the County Legislature and City of Syracuse. If you live in OCL 8 you can follow him race on Facebook at www.facebook.com/Christopher-Ryan-8th-District-County-Legislator-445512279140528/
0 notes