
Don't wanna be here? Send us removal request.
Statistics
We looked inside some of the posts by econ23econlive and here's what we found interesting.
Average Info
Notes Per Post
0
Likes Per Post
0
Reblog Per Post
0
Reply Per Post
0
Time Between Posts
21 days
Number of Posts By Type
Text
17
Last Seen Tumblr Blogs


Fun Fact
In 2020, 44% of users from Denmark used Tumblr daily.
Text
The Societal Cost of Smoking
https://docs.google.com/presentation/d/10JEdc9nwI3RA20ipa_s7o7W524ExDDJ6DCyqD7Wbj34/edit?usp=sharing
Econ 23 Discussion on Tuesdays @ 7PM
Owen Bacus (ID #: 62602128)
Kaito Usui (ID #: 77292897)
0 notes

Text
Economics of Graphics Cards
As an avid gamer and a computer enthusiast, the price of PC components is something I keep an eye on. In particular, graphics cards(GPU). GPUs are responsible for compiling and rendering display data for computer monitors. This is very important for getting the best visual experience in video games. Graphics cards can be the single most expensive component and provide the best price to increase performance to a custom PC regardless if it is a brand new build or upgrading an older rig. My vested interest in GPUs as a product has led to further interest in the current market state of GPUs.
The current market type that best describes the GPU market is an oligopoly albeit a unique one. If one were to go online or the electronic store one will see many different brands of GPUs, but upon closer analysis will notice that on the boxes will have the brand and then its reference card. The reference card is the base chipset or ‘type of GPU’ i.e RTX 4080 or Radeon RX 6000. Only 3 companies design and produce these reference cards: Nvidia, AMD, and Intel. Nvidia and AMD are long time players in this market and compete with each other for who makes the best product, Intel has restarted their GPU line and are attempting to make their space in the market. These references cards are then sent to other companies who then design the printed circuit board (PCB), the housing that facilitates connection to all the components involving the electronics, and then have a cooler attached to them as these chips can generate a lot of heat to be then ready for the consumer to install into a PC.The uniqueness of this oligopoly stems from that while these three companies design and produce these reference cards for other companies/brands to then be completed as fully functional GPUs, they themselves also produce full GPUs that are ready to install. To summarize the supply chain of a gpu, first it starts with the raw materials and the refinement of raw materials, then it goes to reference cards producers, computer hardware companies, and then to retail. Nvidia, AMD, and Intel are not only the main pillars in the supply chain to these computer hardware companies, but they are also competing with those same computer hardware companies on fully assembled GPUs.
Since Nvidia, AMD, and Intel provide reference cards and produce their own GPUs this leads to their product being more competitive in the market. Using the RTX 4090 reference card as an example and StockX, a website where customers can resell products, for data we can compare the Nvidia offering GeForce RTX 4090 Founder’s Edition retailing at $1599.00 and Asus, a computer hardware company, offering ROG Strix Geforce RTX 4090 OC Edition retailing at $1999.99. First thing we can compare is the 12-month historical Number of sales. On the Nvidia product the quantity is 492 while the Asus product quantity is 56. Next we compare the average sale price of Nvidia: $1865 and Asus: $2054. These numbers can be further broken down by looking at the average profit by Ave. Profit = Ave. Sale price - Retail price.
Nvidia: $165.01
Asus: $54.01
Comparing the average profit and the quantity we can see that the Nvidia product is much more desirable than the Asus product. This one example of many which shows this trend where the reference card producer GPU is much more desirable than the third party computer hardware product.
Sources
StockX, NVIDIA Founders GeForce RTX 4090 24GB Graphics Card 900-1G136-2530-000. StockX. https://stockx.com/nvidia-founders-geforce-rtx-4090-24gb-graphics-card-900-1g136-2530-000
StockX, NVIDIA ASUS ROG Strix GeForce RTX 4090 OC Edition 24GB Graphics Card. StockX. https://stockx.com/nvidia-founders-geforce-rtx-4090-24gb-graphics-card-900-1g136-2530-000
Name: Hanul Kim
ID: 37025182
0 notes
Text
Tianci Liu
ID: 41503694
Discussion: Monday, 2:00pm - 2:50pm
0 notes
Text
The Late Night Snack
https://docs.google.com/presentation/d/16fbjcLAckaXqm9DNgpQmR0xx4hYL_pTDcIbCpVV6_9s/edit?usp=sharing
Name: Tyler Ignacio
ID: 43446899
Email: [email protected]
0 notes
Text
Ridiculous prices of Mountain Bikes
Mountain biking is an extreme sport, packed with speed and adrenaline, it has a cult like following among those that love it. However, with this extreme sport, extreme speed and extreme adrenaline, comes extreme prices.

The cost of an average mountain bike (for those serious about the sport) can range anywhere from $2000 to $10000 for a single bike(that's right ten thousand dollars!). Components can cost anywhere in the range of hundreds to thousands of dollars and given the nature of the sport, bike upkeep is extremely expensive. So why is it that these components are so expensive, is it simply because of manufacturer fixed costs or is there some markup explained by the bike market.
These exorbitant costs are probably not due to the manufacturers fixed costs. Compared to dirt bikes driven by engines and with higher performing components, a middle of the pack mountain bike is equally as expensive as an middle of the pack dirt bike.

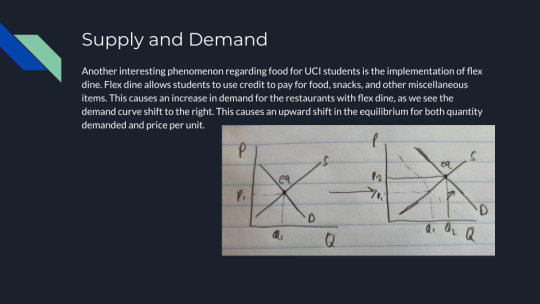
We can examine the mountain bike market from a simple supply and demand curve.
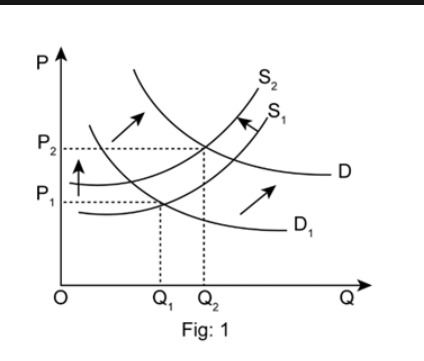
Compared to the dirt bike market, the supply for mountain bikes is much lower, there are less brands, less manufacturers and overall, just less bikes out there. In addition he demand is actually quite high, many mountain bikers will own multiple bikes at a single instant, and replace them every 5-7 years. So on the above curve we are at the intersection of the D curve and the S2 curve compared to the dirt bike market at the S1 (it has more supply) and lower demand. The lower demand is explained by the lifespan of the dirtbikes, lasting virtually 15-20 years. There may be more people that own dirt bikes but less dirtbikes are being sold yearly due to those who already have dirtbikes not buying new ones as frequently.
Another interesting point is that the consumer surplus is actually quite low. However, the top price that consumers are willing to pay is quite high. This is due the manufacturers setting a purposefully higher price (higher than what would be equilibrium) because they know the consumer is willing to pay. There is almost like a fashion industry in the bike community- having the newest and nicest components make you seem "cooler".
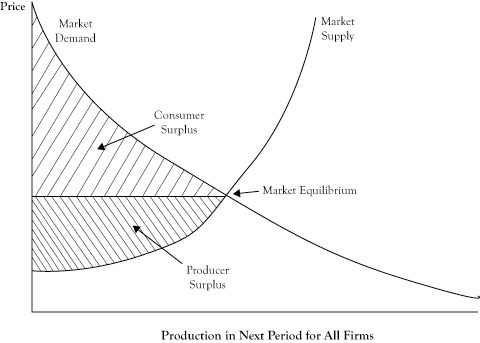
On the graph, the actual price charged is higher than the market equilibrium because of this markup and therefore even though the price the consumer is willing to pay is high, the difference between(which determines the consumer surplus) is quite low. In summary, these bikes are quite expensive due to the nature of the bike market, high demand and lower supply drive up the prices in addition to artificial markups that the firms can charge due to the fact that consumers are willing to pay a premium for these bikes that fuel their love for the sport.
Econ 23 7 Pm discussion Allen Hsing
88325485
0 notes
Text
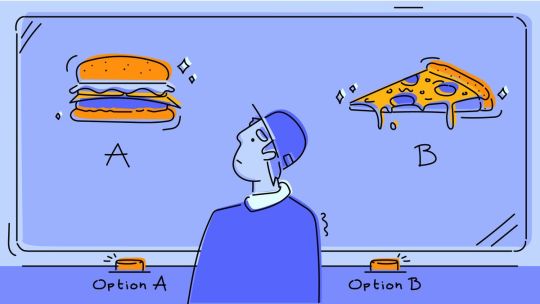
Opportunity Cost and Preferences In the Daily Life of a University Student.
What exactly is opportunity cost?
Opportunity cost is the potential benefits that an individual or a business misses out on when choosing one alternative over the others. Opportunity cost is not just a fundamental concept in economics, but it is also a prominent component that dictates our everyday lives.
In your daily life, you are constantly confronted with decisions and choices, such as waking up early to attend lectures or sleeping in and watching recorded lectures later. This decision can lead to different outcomes and influence how your day is going to be. Sleeping in means that your day starts later and you have less time to accomplish what you set out to do that day, which can lead to you sleeping late and waking up later the next day just to repeat the same process until you decide to wake up early. This highlighted the concept of opportunity cost and its influences on other decisions/outcomes of your life.
I will now discuss the decisions made and the opportunity cost of my usual daily routine on a Friday. (These decisions are based on the choices that I made today at the time I am doing this project.)
On Friday, I have classes from 10:00 am- 2:00 pm and I tend to wake up around 6:30 am to eat and workout at the gym before going to class. This is the first opportunity cost that I faced.
Wake up early, eat, and work out.
Sleep in and work out later in the afternoon.
I decided to wake up early at the cost of some more sleep. However, if I chose the latter, I would have to make up for the missed gym session and spend time later to work out, costing me time that I could otherwise use to study for doing things that I enjoy. If I decided not to work out entirely that day, I would then be disappointed in myself. This illustrated the ideas of how decisions and opportunity costs can snowball into other effects that can further influence your day.
After working out, I have 3 options:
Cut the workout session short to shower and head to class.
Go home, shower, and head to class late.
Go the class and shower later.
I chose to shower and be late for class. The opportunity cost here is that I would miss out on some important information that the professor said at the beginning of the class. However, I can ask a friend to relay that information to me. So, there aren't any opportunity costs of being late to class aside from the guilt of walking in late.
After the lecture, have a gap period before a lab and I can choose between 2 options:
Relax by eating and watching YouTube.
Eat after I get home from lab and do homework.
But no one like to do homework so I often choose to relax before lab. From choice, I get to enjoy my time and the trade-off is I have to do my homework when I get home later, lessening my free time at home.
After lab, I have 3 options:
Be proactive and stay on campus in the library to complete homework.
Go home and rest.
Hang out with friends.
Going out with friends here would mean that I lose the time that I can rest and do homework as well as the money that I am going to spend while out with them. However, nothing is more important than some good quality time with friends so I decided to do homework and rest can wait while I hung out with my friends.
While going out, we got hungry and decided to find a place to eat. We narrowed it down to 3, In and Out, Korean BBQ, and ramen. We then decided what to eat by voting. I prefer In and Out over Korean BBQ, Korean BBQ over ramen, and In and Out over ramen. The trade-off of my preferences is that In and Out is cheaper but it is the farthest from where we were. Thus, the opportunity cost of my choice is that I would have to spend more time traveling further and in return, I save money to use it elsewhere. On the other hand, my friends all agree that they prefer In and Out over ramen, Korean BBQ over In and Out, and ramen over Korean BBQ. However, this preference is irrational (not transitive) as they contradicted themselves by liking ramen, their supposed worst option over Korean BBQ, their supposed best option. As a result, I was able to convince them to go to In and Out.
After the fun, I looked at the clock and it was already 8:00 pm and I hadn’t even started my homework assignments. So I hurried back home and started working immediately. This is the opportunity cost of my decision to eat and rest during the break on campus and hang out with friends afterward. As a result, I have to rush my homework, putting stress on myself and potentially getting a bad grade on the assignments. So in the end, I trade fun for stress as the opportunity cost of previous choices.
Now it is midnight, and I can either choose
Think about my mental health and sleep early.
Sleep late and be tired the next day.
And of course, like any college student, I decided to sleep late as it was the weekend after all. Staying up late allows me to catch up on video games while sacrificing my sleep which I would eventually regret when waking up the next day.
In conclusion, opportunity cost is crucial in decision-making not just inside of the economic world but also in your daily life. Understanding that time is a limited resource and you need to decide how you want to spend it to maximize productivity and enjoyment.
Econ 23, Tuesday 7:00pm
Name: Quan Le
SID: 71725028
0 notes
Text
The Cost of Creative Parting: Adidas' Economic Loss post Kanye West and Yeezy Split
In the expansive world of sneakers, collaborations between brands and prominent individuals of society can often yield groundbreaking success. A particular collaboration that took the sneaker world by storm was Adidas' partnership with Kanye West, now known as Ye, resulting in the Yeezy brand. With Ye being such a controversial individual, often expressing his uncensored opinions and views on social media, Adidas recently found themselves forced to part ways with Ye and the Yeezy line. But what does this mean for Adidas from an economic standpoint?

Announced to the public in early 2021, the split between Adidas and Ye, stunned many in the industry. The Yeezy brand had become coveted for its hype and exclusivity, spiking sales and brand recognition for Adidas. With Ye’s visionary designs and Adidas' revolutionary manufacturing prowess, the collaboration seemed perfect to many who loved fashion and sneakers. However, creative differences and shifting market dynamics ultimately led to the end of their partnership.

The departure of Ye and Yeezy from Adidas inherently led to severe loss in revenue. The Yeezy sneakers produced by Adidas were among the most hyped shoes available in the market and would often be sold out within minutes of their release to the public. It was reported that Adidas faced their first net loss in three decades with supposedly 63 million dollars lost in revenue. Losing the Yeezy partnership came at a detrimental cost to Adidas, as it was responsible for over 40 percent of the company's profits. In the years leading up to the split, Yeezy was generating an estimated two billion dollars a year which was said to be approximately ten percent of Adidas’ total revenue.

Losing Kanye West and his Yeezy brand also proved to lose Adidas a large portion of their consumers. Ye brought about cultural relevance to the Adidas’ brand and attracted a whole new demographic of consumers, many of whom were already fans of Ye himself and his previous work in the fashion and music industries. Losing Ye’s creative genius and innovation raises questions as to whether or not Adidas will be able to retain their consumers even without Ye operating at the forefront of the brand.

Econ 23 Tuesday 7pm
Name: Joshua Nguyen
Student ID #: 59481074
Email: [email protected]
Name: Ravidu Wijesekare
Student ID #: 45236892
Email: [email protected]
0 notes
Text
Alexia Adhikary (SID: 27827637), Michelle Radecker (SID 74861745), and Kayla Garcia (SID 34212024)
Discussion Time: Monday 2pm
0 notes
Text
youtube
Econ Live by Spencer Lam (ID: 35031603) and Duyen Pham (ID:78586062)
Monday Discussion at 2pm
0 notes
Text
youtube
[Econ Live] Annie Nguyen (76528344) & John Nguyen (71649814) Monday Discussion @2:00-2:50pm
0 notes
Text
The Economics of Getting Lunch


Hieu Nguyen ID: 68941955 Discussion: Tuesday 7-7:50pm
0 notes
Text
Oligopolies in the fashion industry
Khine Thazin Myint
95032207
0 notes


Text
Pharmaceutical Evils: Mylan's EpiPen Monopoly
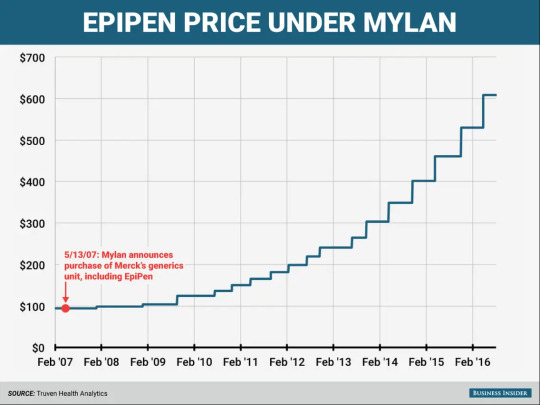
One of the largest evils committed by pharmaceutical companies is the infamous price gouging of the EpiPen. The EpiPen is a medical device that delivers a life-saving dose of epinephrine to individuals experiencing life threating allergic reactions. In 2007, Mylan purchased EpiPen’s generic drug, which at the time was $50 to $100. Now, the cost of this life-saving device has risen from around $50 per pen in 2007 to over $600 per pen today. As a result, those with low incomes are unable to afford it. It has been a source of public outrage that continues to pass right through the ears of Mylan and other pharmaceutical companies. By raising prices to maximize profits, Mylan is able to take advantage from consumers who are willing and able to pay more for the life-saving drug due to the lack of alternatives available on the market. Consequently, it has allowed them to increase their revenues from $200 million in 2008 to 1.3 billion in only a span of eight years.
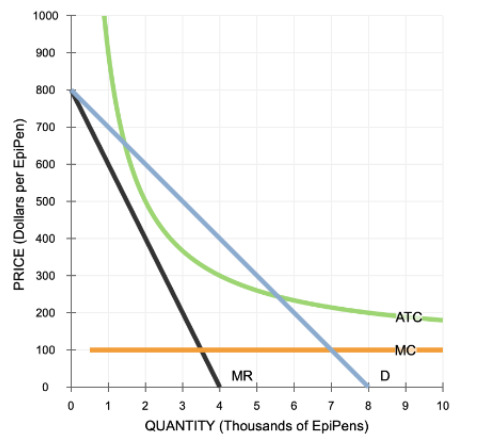
Now, let’s approach this from an economic perspective. Mylan has an exclusive patent agreement on the generic drug for EpiPen, leading to a lack of competition that prevents other companies from creating cheaper alternatives. Customers are given no choice but to succumb to these high prices as they are the only option. In addition, EpiPen has a naturally high demand as people are willing to pay as much as needed to have access to this life-saving drug, resulting in giving Mylan more pricing power. It allows Mylan to achieve the dream of any corporation and set the EpiPen prices at high levels without having to worry about losing market share to competitors. In the long run, they see no incentive to innovate and improve their product as they hardly have any competition and thus face no pressure to improve their product or lower their prices. Finally, after years of backlash and public scrutiny, regulators have pushed EpiPen to lower their prices
Provided is an approximate chart of Mylan’s monopoly (bottom) and their price trends ever since their acquisition (top). Their marginal cost is relatively low and static, as the company had already invested in the development of the product, and the cost of producing an additional unit is effective and cheap. This is a monopoly and not a competitive market, thus the marginal revenue is less than the product’s price. The average total cost is high only because Mylan had the ability to charge high prices and still make a profit.
Sources:
https://www.washingtonpost.com/business/economy/2016/08/25/7f83728a-6aee-11e6-ba32-5a4bf5aad4fa_story.html
Marc Haddad
ID: 67734308
Econ 23. Disc: 7:00 PM Tuesday
0 notes
Text
Genshin Impact: A Monopolist's Dream
A certain game has held a special place in my heart: Genshin Impact. Released in September of 2020, it's now heading into its 3rd anniversary. With beautiful graphics and rich, multi-layered storytelling rivaling that of games by high-budget publishers, the game has captured my attention and has not let go since.
miHoYo, the developer of the top-selling mobile game, exists in a monopoly due to the game being the first of its kind in the market for open world gacha games, which is a combination of two previously unrelated genres: open-world and gacha.
Traditionally, video game companies make profit by selling individual units or copies of the software. Gacha games, on the other hand, are distributed on the internet for free as downloadable apps. Players collect an in-game currency for a chance to obtain characters and items. A certain amount of currency is available through simply playing the game for free, but a far greater amount can be bought with real life money. Thus, players are incentivized to spend money to secure better odds of winning.
As explained previously, miHoYo, as a monopoly, can set the price as whatever it wants since there are no competitors.

Let us define that monopoly price as P_M. The area A represents the consumers with a higher willingness to pay than the monopoly price, and area B plus the area below D = MC on the demand curve represents the consumers priced out of the market by the monopoly price.
Gacha games, with its unique in-game economy, can capture ALL of that untapped consumer surplus and turn it into producer surplus by simply not setting a single price and allowing players to spend however much money as they want. This way, the biggest spenders and the most frugal players both get what they want, thus also maximizing consumer welfare.
Even though I personally did not spend any money, I still got to enjoy the gameplay experience. The real price, however, is the opportunity cost of the hundreds of hours I spent on the game that could have been used to do something with my life...
Michinobu Itasaka
ID: 54409183
0 notes
Text
The Economics of Pianos
When I was 5 years old, my mother began to teach me the piano, which I strongly disliked. I also took lessons for a few years while hating every minute of it, until eventually I was allowed to move onto a different instrument. Years later and the piano is by far my favorite instrument, as it produces the most beautiful sound I have ever heard and playing it is one of my favorite pastimes. I live in a small space, so there is neither space nor the funds for an actual piano, so I make do with an old keyboard. Taking this class made me wonder about different piano producers, as well as how the market reacted to digital pianos (keyboards) since their introduction in the early 1980’s.
There are currently nine piano producers in the United States, with Baldwin Piano & Organ Co., Steinway & Sons, Yamaha Corp. of America, and Kawai America Corp. dominating domestic production. Korean companies Young Chang and Samick, as well as Yamaha and Kawai, are leading suppliers from Asia that import pianos into the US, though for some of these companies most pianos are manufactured on US soil in order to save on the cost of transportation, as though not as heavy as grand pianos (700-1200 lbs), upright pianos are still 300-500 lbs. The market for pianos is divided into 7 groups: parents of beginner piano students, parents of advanced piano students, married, young, childless professionals with dual income, adult piano students, professional musicians, educational and cultural institutions, and the hospitality industry. Each group looks for a different and specific type of piano at different qualities, functions, and most importantly costs. There are also demographic factors that affect the overall market size, being the number of children between ages 5-14 and the number of retirees. More children in the age group of 5-14 increases the size of the market as this is the typical age when children begin to play the piano, and a greater number of retirees in a given period increases the supply of used pianos and decreases the demand for new ones. This was especially evident in Japan as the aging population as well as a financial crisis caused a large increase in the availability of used pianos, and strong demand in the United States led to an increase of imports of these used pianos from Japan in recent years, from aforementioned companies such as Yamaha and Young Chang.
Interestingly and very different from my prediction, the emergence of digital pianos since the 80s came to represent an entirely different market, wherein these pianos are considered substitutes for vertical pianos for beginner-level consumers or to consumers who lack a strong preference. In these instances, the price is the only factor in purchasing. Because there is such a large disparity between musicians and music teachers that heavily prefer the quality, touch, and longevity of acoustic pianos and young people and beginners that like the technology and cheaper price, it appears that while electronic pianos are in demand as substitutes for acoustic pianos, they also represent a separate market. The greater availability of substitutes tends to make demand more price-elastic.
Digital pianos have gained market share at the expense of beginner-level acoustic pianos, though this trend has stabilized since due to the rising demand for acoustic pianos has matched that of digital pianos. In essence, digital keyboards appeal to a larger market of beginners and casual players with disposable income that do not know nor care for the quality of their piano, as opposed to the smaller and more passionate market of musicians and music teachers that specifically search for such qualities.
Source: Lundy, D. (n.d.). Pianos: Economic and competitive conditions affecting the U.S. Retrieved from https://www.usitc.gov/publications/docs/pubs/332/pub3196.pdf
Sean Yoon
UCI ID: 91422545
Section: Tues 7-8pm

0 notes