
Nice to meet you! I'm Brazilian, starting at my early 30's my studies in the area of Technology (Programming, B.I., Data science and etc...)
Don't wanna be here? Send us removal request.
Statistics
We looked inside some of the posts by eduardopagnemassaro-blog and here's what we found interesting.
Average Info
Notes Per Post
1
Likes Per Post
1
Reblog Per Post
0
Reply Per Post
0
Time Between Posts
4 days
Number of Posts By Type
Text
4
Last Seen Tumblr Blogs


Fun Fact
12.7% of mobile users access Tumblr.
Text
Week 4 - Data Management and Visualization.
Input
NOTE: I had to change de file.csv and data because the variables I had choose and the file, do not accept the command to change the type of variables to numeric.
#import the necessary libraries
import pandas
import numpy import seaborn import matplotlib.pyplot as plt
#import the entire dataset to memory data = pandas.read_csv(‘mydataset.csv’, low_memory=False)
#upper-case all Dataframe column names data.columns = map(str.upper, data.columns)
#bug fix for display formats to avoid run time errors pandas.set_option('display.float_format’, lambda x:’%f’%x)
#Set PANDAS to show all columns in Dataframe #pandas.set_option('display.max_columns’, None)
#Set PANDAS to show all rows in Dataframe #pandas.set_option('display.max_rows’, None)
#number of observations (rows) print(len(data))
#number of variables (columns) print(len(data.columns))
sub1=data[(data['H1DA4’]>=1) & (data['H1DA4’]<=3) & (data['H1DA5’]>=1) & (data['H1DA5’]<=3) & (data['H1DA6’]>=1) & (data['H1DA6’]<=3) ] sub2=data[(data['H1DA4’]==0) & (data['H1DA5’]==0) & (data['H1DA6’]==0) ]
#make a copy of my new subsetted data sub3=sub1.copy() sub4=sub2.copy()
print(“it will be examined only for the students who are participating in sport at least once a week”) print(“Mathematics - 1=A, 2=B, 3=C, 4=D or lower, 5=didn’t take the subject, 6=not graded, 96=refused, 97=skip, 98=don’t know”) print(“percentage”) a22 = sub3[“H1ED12”].value_counts(sort=False, normalize=True) print (a22)
####
print(“On a scale of 1 to 5, where 1 is low and 5 is high, how much do you want to go to college - 6=refused, 8=don’t know”) print(“percentage”) b12 = sub3[“H1EE1”].value_counts(sort=False, normalize=True) print (b12)
#setting aside missing data sub3[“H1EE1”] = sub3[“H1EE1”].replace([6,8], numpy.nan)
#print with nan print(“Nan : On a scale of 1 to 5, where 1 is low and 5 is high, how much do you want to go to college - 6=refused, 8=don’t know”) b11n = sub3[“H1EE1”].value_counts(sort=False, dropna=False) print (b11n) print(“Nan : percentage”) b12n = sub3[“H1EE1”].value_counts(sort=False, normalize=True) print (b12n)
########### #setting aside missing data sub3[“H1ED12”] = sub3[“H1ED12”].replace([5,6,96,97,98], numpy.nan)
#print for NAN print(“Nan : Mathematics - 1=A, 2=B, 3=C, 4=D or lower, 5=didn’t take the subject, 6=not graded, 96=refused, 97=skip, 98=don’t know”) print(“Nan: percentage”) a22n = sub3[“H1ED12”].value_counts(sort=False, normalize=True) print (a22n)
#change format from numeric to categorical and creation of graphs
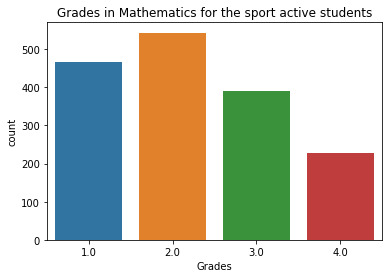
sub3[“H1ED12”] = sub3[“H1ED12”].astype('category’) seaborn.countplot(x=“H1ED12”, data=sub3) plt.xlabel('Grades’) plt.title('Grades in Mathematics for the sport active students’)
#bivariate graph seaborn.factorplot(x=“H1ED12”, y=“H1EE1”, data=sub3, kind=“bar”, ci=None) plt.xlabel('Grades in Mathematics for the sport active students’) plt.ylabel('Willingness to go to College’)
#######################################
print(“it will be examined only for the students who are not participating in sport”)
print(“Mathematics - 1=A, 2=B, 3=C, 4=D or lower, 5=didn’t take the subject, 6=not graded, 96=refused, 97=skip, 98=don’t know”) print(“percentage”) c22 = sub4[“H1ED12”].value_counts(sort=False, normalize=True) print (c22)
####
print(“On a scale of 1 to 5, where 1 is low and 5 is high, how much do you want to go to college - 6=refused, 8=don’t know”) print(“percentage”) d12 = sub4[“H1EE1”].value_counts(sort=False, normalize=True) print (d12)
#setting aside missing data sub4[“H1EE1”] = sub4[“H1EE1”].replace([6,8], numpy.nan)
#print with nan print(“Nan : On a scale of 1 to 5, where 1 is low and 5 is high, how much do you want to go to college - 6=refused, 8=don’t know”) #print(“Nan : percentage”) d12n = sub4[“H1EE1”].value_counts(sort=False, normalize=True) print (d12n)
##########
#setting aside missing data sub4[“H1ED12”] = sub4[“H1ED12”].replace([5,6,96,97,98], numpy.nan)
print(“Nan : Mathematics - 1=A, 2=B, 3=C, 4=D or lower, 5=didn’t take the subject, 6=not graded, 96=refused, 97=skip, 98=don’t know”) print(“Nan : percentage”) c22n = sub4[“H1ED12”].value_counts(sort=False, normalize=True) print (c22n)
#change format from numeric to categorical and creation of graphs sub4[“H1ED12”] = sub4[“H1ED12”].astype('category’) seaborn.countplot(x=“H1ED11”, data=sub4) plt.xlabel('Grades’) plt.title('Grades in Mathematics for the sport non active students’) print('Describe Mathematics grades for sport non active students’) desc1=sub4[“H1ED12”].describe() print(desc1)
#bivariate graph seaborn.factorplot(x=“H1ED12”, y=“H1EE1”, data=sub4, kind=“bar”, ci=None) plt.xlabel('Grades in Mathematics for the sport non active students’) plt.ylabel('Willingness to go to College’)
Output
Univariate Graph for Sport Active Students
Univariate Graph for Sport Non-Active Students

Bivariate Graph for Sport Active Students

Bivariate Graph for Sport Non-Active Students

The variables that I have chosen to use are:
the participation in sports
the performance in Mathematics
the willingness to go to college
The first graph shows the count of the Sport Active students that have received each grade in Mathematics, where 1=A, 2=B, 3=C, 4=D or lower
The second graph shows the count of the Sport Non-Active students that have received each grade in Mathematics, where 1=A, 2=B, 3=C, 4=D or lower
The third graph is the bivariate graph, that shows the dependency between the grades in Mathematics of the Sport Active students and their willingness to go to college
The fourth graph is the bivariate graph, that shows the dependency between the grades in Mathematics of the Sport Non-Active students and their willingness to go to college
Comparing the graphs between the sport active students and the sport non active students it can be deducted, that the sport active students with higher performance show a higher willingness to go to college.
0 notes
Text
Week 3 - Data Management and Visualization
Input
# -*- coding: utf-8 -*- """ Created on Mon Sep 16 15:22:18 2019
@author: Eduardo """
#import the necessary libraries import pandas import numpy import seaborn import matplotlib.pyplot as plt
#import the entire dataset to memory data = pandas.read_csv('addhealth.csv', low_memory = False)
#upper-case all DataFrame column names data.columns = map(str.upper, data.columns)
#bug fix for display formats to avoid run time errors pandas.set_option('display.float_format', lambda x:'%f'%x)
#number of observations (rows) print(len(data)) #number of observations (rows) print(len(data.columns))
data['H1ED5'] = data['H1ED5'].apply(pandas.to_numeric, errors='coerce') data['H1ED7'] = data['H1ED7'].apply(pandas.to_numeric, errors='coerce') data['H1ED16'] = data['H1ED16'].apply(pandas.to_numeric, errors='coerce') data['H1ED17'] = data['H1ED17'].apply(pandas.to_numeric, errors='coerce') data['H1WP2'] = data['H1WP2'].apply(pandas.to_numeric, errors='coerce') data['H1WP6'] = data['H1WP6'].apply(pandas.to_numeric, errors='coerce') data['H1PF3'] = data['H1PF3'].apply(pandas.to_numeric, errors='coerce') data['H1PF4'] = data['H1PF4'].apply(pandas.to_numeric, errors='coerce')
data['H1ED5']=data['H1ED5'].replace(6, numpy.nan) data['H1ED5']=data['H1ED5'].replace(8, numpy.nan) data['H1ED7']=data['H1ED7'].replace(6, numpy.nan) data['H1ED7']=data['H1ED7'].replace(8, numpy.nan) data['H1ED16']=data['H1ED16'].replace(6, numpy.nan) data['H1ED16']=data['H1ED16'].replace(7, numpy.nan) data['H1ED16']=data['H1ED16'].replace(8, numpy.nan) data['H1ED17']=data['H1ED17'].replace(6, numpy.nan) data['H1ED17']=data['H1ED17'].replace(7, numpy.nan) data['H1ED17']=data['H1ED17'].replace(8, numpy.nan) data['H1WP2']=data['H1WP2'].replace(6, numpy.nan) data['H1WP2']=data['H1WP2'].replace(7, numpy.nan) data['H1WP2']=data['H1WP2'].replace(8, numpy.nan) data['H1WP2']=data['H1WP2'].replace(9, numpy.nan) data['H1WP6']=data['H1WP6'].replace(6, numpy.nan) data['H1WP6']=data['H1WP6'].replace(7, numpy.nan) data['H1WP6']=data['H1WP6'].replace(8, numpy.nan) data['H1WP6']=data['H1WP6'].replace(9, numpy.nan) data['H1PF3']=data['H1PF3'].replace(6, numpy.nan) data['H1PF3']=data['H1PF3'].replace(7, numpy.nan) data['H1PF3']=data['H1PF3'].replace(8, numpy.nan) data['H1PF3']=data['H1PF3'].replace(9, numpy.nan) data['H1PF4']=data['H1PF4'].replace(6, numpy.nan) data['H1PF4']=data['H1PF4'].replace(7, numpy.nan) data['H1PF4']=data['H1PF4'].replace(8, numpy.nan) data['H1PF4']=data['H1PF4'].replace(9, numpy.nan)
print ("Counts for H1ED5 - Students who have already repeated a grade \n0 = NO, \n1 = YES") ct1 = data.groupby('H1ED5').size() print ("_____________________________________________________________") print(ct1) print("\n")
print ("Percentages for H1ED5 - Students who have already repeated a grade \n0 = NO, \n1 = YES") pt1 = data.groupby('H1ED5').size() * 100 / len(data) print ("_____________________________________________________________") print(pt1) print("\n")
print ("Counts for H1ED7 - Students who received suspension from school. \n0 = NO, \n1 = YES") c2 = data['H1ED7'].value_counts(sort=True) print ("_____________________________________________________________") print (c2) print("\n")
print ("Percentages for H1ED7 - Students who received suspension from school. \n0 = NO, \n1 = YES") p2 = data['H1ED7'].value_counts(sort=True, normalize=True) print ("_____________________________________________________________") print (p2) print("\n")
print ("Counts for H1ED16 - How often have you had trouble paying attention in school? \n0 = Never, \n1 = Just a few times, \n2 = About once a week, \n3 = Almost everyday, \n4 = Everyday") c3 = data['H1ED16'].value_counts(sort=True) print ("_____________________________________________________________") print (c3) print("\n")
print ("Percentages for H1ED16 - How often have you had trouble paying attention in school? \n0 = Never, \n1 = Just a few times, \n2 = About once a week, \n3 = Almost everyday, \n4 = Everyday") p3 = data['H1ED16'].value_counts(sort=True, normalize=True) print ("_____________________________________________________________") print (p3) print("\n")
print ("Counts for H1ED17 - How often have you had trouble getting your homework done? \n0 = Never, \n1 = Just a few times, \n2 = About once a week, \n3 = Almost everyday, \n4 = Everyday") c4 = data['H1ED17'].value_counts(sort=True) print ("_____________________________________________________________") print (c4) print("\n")
print ("Percentages for H1ED17 - How often have you had trouble getting your homework done? \n0 = Never, \n1 = Just a few times, \n2 = About once a week, \n3 = Almost everyday, \n4 = Everyday") p4 = data['H1ED17'].value_counts(sort=True, normalize=True) print ("_____________________________________________________________") print (p4) print("\n")
print ("Counts for H1WP2 - Do your parents let you make your own decisions about the people you hang around with you hang around with?. \n0 = NO, \n1 = YES") c5 = data['H1WP2'].value_counts(sort=True) print ("_____________________________________________________________") print (c5) print("\n")
print ("Percentages for H1WP2 - Do your parents let you make your own decisions about the people you hang around with you hang around with? \n0 = NO, \n1 = YES") p5 = data['H1WP2'].value_counts(sort=True, normalize=True) print ("_____________________________________________________________") print (p5) print("\n")
print ("Counts for H1WP6 - Do your parents let you make your own decisions about what time you go to bed on week nights? \n0 = NO, \n1 = YES") c6 = data['H1WP6'].value_counts(sort=True) print ("_____________________________________________________________") print (c6) print("\n")
print ("Percentages for H1WP6 - Do your parents let you make your own decisions about what time you go to bed on week nights? \n0 = NO, \n1 = YES") p6 = data['H1WP6'].value_counts(sort=True, normalize=True) print ("_____________________________________________________________") print (p6) print("\n")
print ("Counts for H1PF3 - When you do something wrong that is important, your mother talks about it with you and helps you understand why it is wrong. \n1 = Strongly agree, \n2 = Agree, \n3 = Neither agree nor disagree, \n4 = Disagree, \n5 = Strongly disagree") c7 = data['H1PF3'].value_counts(sort=True) print ("_____________________________________________________________") print (c7) print("\n")
print ("Percentages for H1PF3 - When you do something wrong that is important, your mother talks about it with you and helps you understand why it is wrong. \n1 = Strongly agree, \n2 = Agree, \n3 = Neither agree nor disagree, \n4 = Disagree, \n5 = Strongly disagree") p7 = data['H1PF3'].value_counts(sort=True, normalize=True) print ("_____________________________________________________________") print (p7) print("\n")
print ("Counts for H1PF4 - You are satisfied with the way your mother and you communicate with each other. \n1 = Strongly agree, \n2 = Agree, \n3 = Neither agree nor disagree, \n4 = Disagree, \n5 = Strongly disagree") c8 = data['H1PF4'].value_counts(sort=True) print ("_____________________________________________________________") print (c8) print("\n")
print ("Percentages for H1PF4 - You are satisfied with the way your mother and you communicate with each other. \n1 = Strongly agree, \n2 = Agree, \n3 = Neither agree nor disagree, \n4 = Disagree, \n5 = Strongly disagree") p8 = data['H1PF4'].value_counts(sort=True, normalize=True) print ("_____________________________________________________________") print (p8) print("\n")
# subset variables in new data frame, sub1 sub1=data[['H1ED5', 'H1ED16', 'H1WP6', 'H1PF3']]
#contitional for subset sub1=data[(data['H1ED5']==1) & (data['H1ED16']>=2) & (data['H1ED16']<=4) & (data['H1PF3']>=3) & (data['H1PF3']<=5) ]
#make a copy of my new subsetted data sub2=sub1.copy()
print('Count for students who have trouble paying attention in class.') c9 = sub2 ['H1ED16'].value_counts(sort=False) print ("_____________________________________________________________") print(c9) print("\n")
print('Percentages for students who have trouble paying attention in class.') p9 = sub2['H1ED16'].value_counts(sort=False, normalize=True) print ("_____________________________________________________________") print(p9) print("\n")
print('Sum of students who have trouble paying attention in class.') s9 = sum(sub2 ['H1ED16']) print ("_____________________________________________________________") print(s9) print("\n")
print('Count for Students who have already repeated a grade.') c10 = sub2['H1ED5'].value_counts(sort=False) print ("_____________________________________________________________") print(c10) print("\n")
print('Percentages for Students who have already repeated a grade.') p10 = sub2['H1ED5'].value_counts(sort=False, normalize=True) print ("_____________________________________________________________") print(p10) print("\n")
print('Count for Students who have poor relationship.') c11 = sub2['H1PF3'].value_counts(sort=False) print ("_____________________________________________________________") print(c11) print("\n")
print('Percentages for Students who have poor relationship.') p11 = sub2['H1PF3'].value_counts(sort=False, normalize=True) print ("_____________________________________________________________") print(p11) print("\n")
print('Sum of students who have poor relationship.') s11 = sum(sub2 ['H1PF3']) print ("_____________________________________________________________") print(s9) print("\n")
Output
runfile('C:/Users/Eduardo/Desktop/Data Management and Visualization/doZero.py', wdir='C:/Users/Eduardo/Desktop/Data Management and Visualization') 6504 2829 Counts for H1ED5 - Students who have already repeated a grade 0 = NO, 1 = YES _____________________________________________________________ H1ED5 0.000000 5093 1.000000 1397 dtype: int64
Percentages for H1ED5 - Students who have already repeated a grade 0 = NO, 1 = YES _____________________________________________________________ H1ED5 0.000000 78.305658 1.000000 21.479090 dtype: float64
Counts for H1ED7 - Students who received suspension from school. 0 = NO, 1 = YES _____________________________________________________________ 0.000000 4687 1.000000 1801 Name: H1ED7, dtype: int64
Percentages for H1ED7 - Students who received suspension from school. 0 = NO, 1 = YES _____________________________________________________________ 0.000000 0.722411 1.000000 0.277589 Name: H1ED7, dtype: float64
Counts for H1ED16 - How often have you had trouble paying attention in school? 0 = Never, 1 = Just a few times, 2 = About once a week, 3 = Almost everyday, 4 = Everyday _____________________________________________________________ 1.000000 2905 0.000000 1551 2.000000 1056 3.000000 640 4.000000 215 Name: H1ED16, dtype: int64
Percentages for H1ED16 - How often have you had trouble paying attention in school? 0 = Never, 1 = Just a few times, 2 = About once a week, 3 = Almost everyday, 4 = Everyday _____________________________________________________________ 1.000000 0.456259 0.000000 0.243600 2.000000 0.165855 3.000000 0.100518 4.000000 0.033768 Name: H1ED16, dtype: float64
Counts for H1ED17 - How often have you had trouble getting your homework done? 0 = Never, 1 = Just a few times, 2 = About once a week, 3 = Almost everyday, 4 = Everyday _____________________________________________________________ 1.000000 2633 0.000000 1892 2.000000 1004 3.000000 580 4.000000 258 Name: H1ED17, dtype: int64
Percentages for H1ED17 - How often have you had trouble getting your homework done? 0 = Never, 1 = Just a few times, 2 = About once a week, 3 = Almost everyday, 4 = Everyday _____________________________________________________________ 1.000000 0.413539 0.000000 0.297157 2.000000 0.157688 3.000000 0.091095 4.000000 0.040521 Name: H1ED17, dtype: float64
Counts for H1WP2 - Do your parents let you make your own decisions about the people you hang around with you hang around with?. 0 = NO, 1 = YES _____________________________________________________________ 1.000000 5420 0.000000 942 Name: H1WP2, dtype: int64
Percentages for H1WP2 - Do your parents let you make your own decisions about the people you hang around with you hang around with? 0 = NO, 1 = YES _____________________________________________________________ 1.000000 0.851933 0.000000 0.148067 Name: H1WP2, dtype: float64
Counts for H1WP6 - Do your parents let you make your own decisions about what time you go to bed on week nights? 0 = NO, 1 = YES _____________________________________________________________ 1.000000 4151 0.000000 2212 Name: H1WP6, dtype: int64
Percentages for H1WP6 - Do your parents let you make your own decisions about what time you go to bed on week nights? 0 = NO, 1 = YES _____________________________________________________________ 1.000000 0.652365 0.000000 0.347635 Name: H1WP6, dtype: float64
Counts for H1PF3 - When you do something wrong that is important, your mother talks about it with you and helps you understand why it is wrong. 1 = Strongly agree, 2 = Agree, 3 = Neither agree nor disagree, 4 = Disagree, 5 = Strongly disagree _____________________________________________________________ 2.000000 2807 1.000000 2264 3.000000 632 4.000000 336 5.000000 81 Name: H1PF3, dtype: int64
Percentages for H1PF3 - When you do something wrong that is important, your mother talks about it with you and helps you understand why it is wrong. 1 = Strongly agree, 2 = Agree, 3 = Neither agree nor disagree, 4 = Disagree, 5 = Strongly disagree _____________________________________________________________ 2.000000 0.458660 1.000000 0.369935 3.000000 0.103268 4.000000 0.054902 5.000000 0.013235 Name: H1PF3, dtype: float64
Counts for H1PF4 - You are satisfied with the way your mother and you communicate with each other. 1 = Strongly agree, 2 = Agree, 3 = Neither agree nor disagree, 4 = Disagree, 5 = Strongly disagree _____________________________________________________________ 2.000000 2502 1.000000 2399 3.000000 579 4.000000 489 5.000000 153 Name: H1PF4, dtype: int64
Percentages for H1PF4 - You are satisfied with the way your mother and you communicate with each other. 1 = Strongly agree, 2 = Agree, 3 = Neither agree nor disagree, 4 = Disagree, 5 = Strongly disagree _____________________________________________________________ 2.000000 0.408690 1.000000 0.391865 3.000000 0.094577 4.000000 0.079876 5.000000 0.024992 Name: H1PF4, dtype: float64
Count for students who have trouble paying attention in class. _____________________________________________________________ 3.000000 40 4.000000 11 2.000000 28 Name: H1ED16, dtype: int64
Percentages for students who have trouble paying attention in class. _____________________________________________________________ 3.000000 0.506329 4.000000 0.139241 2.000000 0.354430 Name: H1ED16, dtype: float64
Sum of students who have trouble paying attention in class. _____________________________________________________________ 220.0
Count for Students who have already repeated a grade. _____________________________________________________________ 1.000000 79 Name: H1ED5, dtype: int64
Percentages for Students who have already repeated a grade. _____________________________________________________________ 1.000000 1.000000 Name: H1ED5, dtype: float64
Count for Students who have poor relationship. _____________________________________________________________ 3.000000 40 4.000000 30 5.000000 9 Name: H1PF3, dtype: int64
Percentages for Students who have poor relationship. _____________________________________________________________ 3.000000 0.506329 4.000000 0.379747 5.000000 0.113924 Name: H1PF3, dtype: float64
Sum of students who have poor relationship. _____________________________________________________________ 220.0
In [7]:
Analysis
The variables that I have chosen to use are:
Students who have already repeated a grade
Students who have trouble paying attention in class
Poor Relationship with parents .
I could evaluate that crossing the 3 variables chosen through the conditional command line: sub1 = date [(date ['H1ED5'] == 1) & (date ['H1ED16']> = 2) & (date ['H1ED16'] <= 4) & (date ['H1PF3']> = 3 ) & (date ['H1PF3'] <= 5)]
the numbers have dropped dramatically, leading to the possible conclusion that poor relationship with parents does not always imply poor school performance, at least not in the data sample provided, which strangely goes against the articles and research used as a reference at the beginning. of course.
0 notes
Text
Week 2 - Data Management and Visualization
Input
# -*- coding: utf-8 -*- """ Spyder Editor
First experience with Phyton """ #import the necessary libraries import pandas import numpy
#import the entire dataset to memory data = pandas.read_csv('addhealth.csv', low_memory = False)
#upper-case all DataFrame column names data.columns = map(str.upper, data.columns)
#bug fix for display formats to avoid run time errors pandas.set_option('display.float_format', lambda x:'%f'%x)
#just trying the groupby command print ("Counts for H1ED5 - Students who have already repeated a grade \n0 = NO, \n1 = YES, \n6 = REFUSED, \n8 = Don't know") ct1 = data.groupby('H1ED5').size() print ("_____________________________________________________________") print (ct1) print("\n")
#just trying the groupby command print ("Percentages for H1ED5 - Students who have already repeated a grade \n0 = NO, \n1 = YES, \n6 = REFUSED, \n8 = Don't know") pt1 = data.groupby('H1ED5').size() * 100 / len(data) print ("_____________________________________________________________") print(pt1) print("\n")
print ("Counts for H1ED7 - Students who received suspension from school. \n0 = NO, \n1 = YES, \n6 = REFUSED, \nEmpty = missing, \n8 = Don't know") c2 = data['H1ED7'].value_counts(sort=True) print ("_____________________________________________________________") print (c2) print("\n")
print ("Percentages for H1ED7 - Students who received suspension from school. \n0 = NO, \n1 = YES, \n6 = REFUSED, \nEmpty = missing, \n8 = Don't know") p2 = data['H1ED7'].value_counts(sort=True, normalize=True) print ("_____________________________________________________________") print (p2) print("\n")
print ("Counts for H1ED16 - How often have you had trouble paying attention in school? \n0 = Never, \n1 = Just a few times, \n2 = About once a week, \n3 = Almost everyday, \n4 = Everyday, \n6 = Refused, \n7 = Legitimate skip, \n8 = don’t know") c3 = data['H1ED16'].value_counts(sort=True) print ("_____________________________________________________________") print (c3) print("\n")
print ("Percentages for H1ED16 - How often have you had trouble paying attention in school? \n0 = Never, \n1 = Just a few times, \n2 = About once a week, \n3 = Almost everyday, \n4 = Everyday, \n6 = Refused, \n7 = Legitimate skip, 8 = don’t know") p3 = data['H1ED16'].value_counts(sort=True, normalize=True) print ("_____________________________________________________________") print (p3) print("\n")
print ("Counts for H1ED17 - How often have you had trouble getting your homework done? \n0 = Never, \n1 = Just a few times, \n2 = About once a week, \n3 = Almost everyday, \n4 = Everyday, \n6 = Refused, \n7 = Legitimate skip, \n8 = don’t know") c4 = data['H1ED17'].value_counts(sort=True) print ("_____________________________________________________________") print (c4) print("\n")
print ("Percentages for H1ED17 - How often have you had trouble getting your homework done? \n0 = Never, \n1 = Just a few times, \n2 = About once a week, \n3 = Almost everyday, \n4 = Everyday, \n6 = Refused, \n7 = Legitimate skip, \n8 = don’t know") p4 = data['H1ED17'].value_counts(sort=True, normalize=True) print ("_____________________________________________________________") print (p4) print("\n")
print ("Counts for H1WP2 - Do your parents let you make your own decisions about the people you hang around with you hang around with?. \n0 = NO, \n1 = YES, \n6 = REFUSED, \n7 = legitimate skip, \n8 = Don't know, \n9 = not applicable") c5 = data['H1WP2'].value_counts(sort=True) print ("_____________________________________________________________") print (c5) print("\n")
print ("Percentages for H1WP2 - Do your parents let you make your own decisions about the people you hang around with you hang around with? \n0 = NO, \n1 = YES, \n6 = REFUSED, \n7 = legitimate skip, \n8 = Don't know, \n9 = not applicable") p5 = data['H1WP2'].value_counts(sort=True, normalize=True) print ("_____________________________________________________________") print (p5) print("\n")
print ("Counts for H1WP6 - Do your parents let you make your own decisions about what time you go to bed on week nights? \n0 = NO, \n1 = YES, \n6 = REFUSED, \n7 = legitimate skip [No parents], \n8 = Don't know, \n9 = not applicable") c6 = data['H1WP6'].value_counts(sort=True) print ("_____________________________________________________________") print (c6) print("\n")
print ("Percentages for H1WP6 - Do your parents let you make your own decisions about what time you go to bed on week nights? \n0 = NO, \n1 = YES, \n6 = REFUSED, \n7 = legitimate skip [No parents], \n8 = Don't know, \n9 not applicable") p6 = data['H1WP6'].value_counts(sort=True, normalize=True) print ("_____________________________________________________________") print (p6) print("\n")
print ("Counts for H1PF3 - When you do something wrong that is important, your mother talks about it with you and helps you understand why it is wrong. \n1 = Strongly agree, \n2 = Agree, \n3 = Neither agree nor disagree, \n4 = Disagree, \n5 = Strongly disagree, \n6 = Refused, \n7 = Legitimate skip [no resident MOM], \n8 = Don’t know, \n9 = Not applicable") c7 = data['H1PF3'].value_counts(sort=True) print ("_____________________________________________________________") print (c7) print("\n")
print ("Percentages for H1PF3 - When you do something wrong that is important, your mother talks about it with you and helps you understand why it is wrong. \n1 = Strongly agree, \n2 = Agree, \n3 = Neither agree nor disagree, \n4 = Disagree, \n5 = Strongly disagree, \n6 = Refused, \n7 = Legitimate skip [no resident MOM], \n8 = Don’t know, \n9 = Not applicable") p7 = data['H1PF3'].value_counts(sort=True, normalize=True) print ("_____________________________________________________________") print (p7) print("\n")
print ("Counts for H1PF4 - You are satisfied with the way your mother and you communicate with each other. \n1 = Strongly agree, \n2 = Agree, \n3 = Neither agree nor disagree, \n4 = Disagree, \n5 = Strongly disagree, \n6 = Refused, \n7 = Legitimate skip [no resident MOM], \n8 = Don’t know, \n9 = Not applicable") c8 = data['H1PF4'].value_counts(sort=True) print ("_____________________________________________________________") print (c8) print("\n")
print ("Percentages for H1PF4 - You are satisfied with the way your mother and you communicate with each other. \n1 = Strongly agree, \n2 = Agree, \n3 = Neither agree nor disagree, \n4 = Disagree, \n5 = Strongly disagree, \n6 = Refused, \n7 = Legitimate skip [no resident MOM], \n8 = Don’t know, \n9 = Not applicable") p8 = data['H1PF4'].value_counts(sort=True, normalize=True) print ("_____________________________________________________________") print (p8) print("\n")
Output
runfile('C:/Users/Eduardo/Desktop/Data Management and Visualization/Week_2_Script_1.py', wdir='C:/Users/Eduardo/Desktop/Data Management and Visualization') Counts for H1ED5 - Students who have already repeated a grade 0 = NO, 1 = YES, 6 = REFUSED, 8 = Don't know _____________________________________________________________ H1ED5 0 5093 1 1397 6 5 8 9 dtype: int64
Percentages for H1ED5 - Students who have already repeated a grade 0 = NO, 1 = YES, 6 = REFUSED, 8 = Don't know _____________________________________________________________ H1ED5 0 78.305658 1 21.479090 6 0.076876 8 0.138376 dtype: float64
Counts for H1ED7 - Students who received suspension from school. 0 = NO, 1 = YES, 6 = REFUSED, Empty = missing, 8 = Don't know _____________________________________________________________ 0 4687 1 1801 8 8 6 5 3 Name: H1ED7, dtype: int64
Percentages for H1ED7 - Students who received suspension from school. 0 = NO, 1 = YES, 6 = REFUSED, Empty = missing, 8 = Don't know _____________________________________________________________ 0 0.720633 1 0.276907 8 0.001230 6 0.000769 0.000461 Name: H1ED7, dtype: float64
Counts for H1ED16 - How often have you had trouble paying attention in school? 0 = Never, 1 = Just a few times, 2 = About once a week, 3 = Almost everyday, 4 = Everyday, 6 = Refused, 7 = Legitimate skip, 8 = don’t know _____________________________________________________________ 1 2905 0 1551 2 1056 3 640 4 215 7 128 8 5 6 4 Name: H1ED16, dtype: int64
Percentages for H1ED16 - How often have you had trouble paying attention in school? 0 = Never, 1 = Just a few times, 2 = About once a week, 3 = Almost everyday, 4 = Everyday, 6 = Refused, 7 = Legitimate skip, 8 = don’t know _____________________________________________________________ 1 0.446648 0 0.238469 2 0.162362 3 0.098401 4 0.033057 7 0.019680 8 0.000769 6 0.000615 Name: H1ED16, dtype: float64
Counts for H1ED17 - How often have you had trouble getting your homework done? 0 = Never, 1 = Just a few times, 2 = About once a week, 3 = Almost everyday, 4 = Everyday, 6 = Refused, 7 = Legitimate skip, 8 = don’t know _____________________________________________________________ 1 2633 0 1892 2 1004 3 580 4 258 7 128 8 5 6 4 Name: H1ED17, dtype: int64
Percentages for H1ED17 - How often have you had trouble getting your homework done? 0 = Never, 1 = Just a few times, 2 = About once a week, 3 = Almost everyday, 4 = Everyday, 6 = Refused, 7 = Legitimate skip, 8 = don’t know _____________________________________________________________ 1 0.404828 0 0.290898 2 0.154367 3 0.089176 4 0.039668 7 0.019680 8 0.000769 6 0.000615 Name: H1ED17, dtype: float64
Counts for H1WP2 - Do your parents let you make your own decisions about the people you hang around with you hang around with?. 0 = NO, 1 = YES, 6 = REFUSED, 7 = legitimate skip, 8 = Don't know, 9 = not applicable _____________________________________________________________ 1 5420 0 942 7 131 8 7 6 3 9 1 Name: H1WP2, dtype: int64
Percentages for H1WP2 - Do your parents let you make your own decisions about the people you hang around with you hang around with? 0 = NO, 1 = YES, 6 = REFUSED, 7 = legitimate skip, 8 = Don't know, 9 = not applicable _____________________________________________________________ 1 0.833333 0 0.144834 7 0.020141 8 0.001076 6 0.000461 9 0.000154 Name: H1WP2, dtype: float64
Counts for H1WP6 - Do your parents let you make your own decisions about what time you go to bed on week nights? 0 = NO, 1 = YES, 6 = REFUSED, 7 = legitimate skip [No parents], 8 = Don't know, 9 = not applicable _____________________________________________________________ 1 4151 0 2212 7 131 8 7 6 2 9 1 Name: H1WP6, dtype: int64
Percentages for H1WP6 - Do your parents let you make your own decisions about what time you go to bed on week nights? 0 = NO, 1 = YES, 6 = REFUSED, 7 = legitimate skip [No parents], 8 = Don't know, 9 not applicable _____________________________________________________________ 1 0.638223 0 0.340098 7 0.020141 8 0.001076 6 0.000308 9 0.000154 Name: H1WP6, dtype: float64
Counts for H1PF3 - When you do something wrong that is important, your mother talks about it with you and helps you understand why it is wrong. 1 = Strongly agree, 2 = Agree, 3 = Neither agree nor disagree, 4 = Disagree, 5 = Strongly disagree, 6 = Refused, 7 = Legitimate skip [no resident MOM], 8 = Don’t know, 9 = Not applicable _____________________________________________________________ 2 2807 1 2264 3 632 7 370 4 336 5 81 8 8 6 5 9 1 Name: H1PF3, dtype: int64
Percentages for H1PF3 - When you do something wrong that is important, your mother talks about it with you and helps you understand why it is wrong. 1 = Strongly agree, 2 = Agree, 3 = Neither agree nor disagree, 4 = Disagree, 5 = Strongly disagree, 6 = Refused, 7 = Legitimate skip [no resident MOM], 8 = Don’t know, 9 = Not applicable _____________________________________________________________ 2 0.431581 1 0.348093 3 0.097171 7 0.056888 4 0.051661 5 0.012454 8 0.001230 6 0.000769 9 0.000154 Name: H1PF3, dtype: float64
Counts for H1PF4 - You are satisfied with the way your mother and you communicate with each other. 1 = Strongly agree, 2 = Agree, 3 = Neither agree nor disagree, 4 = Disagree, 5 = Strongly disagree, 6 = Refused, 7 = Legitimate skip [no resident MOM], 8 = Don’t know, 9 = Not applicable _____________________________________________________________ 2 2502 1 2399 3 579 4 489 7 370 5 153 8 8 6 3 9 1 Name: H1PF4, dtype: int64
Percentages for H1PF4 - You are satisfied with the way your mother and you communicate with each other. 1 = Strongly agree, 2 = Agree, 3 = Neither agree nor disagree, 4 = Disagree, 5 = Strongly disagree, 6 = Refused, 7 = Legitimate skip [no resident MOM], 8 = Don’t know, 9 = Not applicable _____________________________________________________________ 2 0.384686 1 0.368850 3 0.089022 4 0.075185 7 0.056888 5 0.023524 8 0.001230 6 0.000461 9 0.000154 Name: H1PF4, dtype: float64
Frequency Tables
Behavior and school performance. Relationship with parents.

Analysis
The variables that I have chosen to use are:
School suspensions and expulsions
School trouble
These two variables above, I used to form Behavior and school performance.
3. Relationship with parents
First for variables 1 and 2, my intention is to find out if there is a relationship between them, that is, if the student who has bad behavior tends to have school difficulties as well and vise versa.
With the questionnaire applied to a sample of 6504 adolescents, we had close numbers among the adolescents who have trouble paying attention at school once a week (1056) to Almost every day (640) they reach (1696) and those already had some kind of suspension (1801) or repeated a grid (1397). So it is valid to assume that these variables are related, ie, students who have already been suspended from school and (or) have failed a grade are likely to have problems with attention and homework, because adolescents who have problems to perform their homework they also reach nearby numbers (1842).
Summing up:
Suspension = 1801 Attention issues = 1696 Failed in a grid = 1397 Problems with Homework = 1842
The third variable, Relationship with parents, was added to try to understand if there is a relationship between a teenager who has school problems with a weak relationship and little control by parents.
Summing up:
When you do something wrong, your mother talks about it with you ?
Neither agree nor disagree = 632 Disagree = 336 Total (1049) Strongly disagree = 81
You are satisfied with the way your mother and you communicate with each other?
Neither agree nor disagree = 579 Disagree = 489 Total (1221) Strongly disagree = 153
We can see from the above summary that the numbers are also close, not so much as between the previous analysis, but it is plausible to say that there is a relationship between the three variables, that is, a student who has a less satisfactory parenting relationship. with less control, tends to have poor behavior and school performance.
0 notes
Text
Week 1 - Data Management and Visualization
STEP 1: Choose a data set that you would like to work with.
Among the supplied codebooks and datasets, my choice was "Addhealth", and I will focus on the data set of the Personality and Family, Relation with Parents and Academics and Education
STEP 2. Identify a specific topic of interest.
More specifically, I would like to examine the correlation between performance and interest in school and the close relationship with parents. In other words, the research question is, "Is a bad relationship with parents related to poor school performance?"
STEP 3. Prepare a codebook of your own (i.e., print individual pages or copy screen and paste into a new document) from the larger codebook that includes the questions/items/variables that measure your selected topics).
To get information for my research question, I need to determine how close and participative parents are to students and how disciplined they are in school. For this reason, at first, I included in my codebook all the variables I found that might relate to the research question.
In total, I initially selected 21 variables, the first 8 being part of the Academics and Education group, referring to student performance and interest in school.
The next 5 variables are part of the Relations with Parents group which relate to how concerned and how close parents are to their children.
Finally, we have 8 more questions from the Personality and Family group that relate to how closely lovingly speaking children feel about their parents.
I know there are many questions initially, but as I have no experience in the area at first I will leave them all, and as I proceed with the project I can narrow them down according to their perceived relevance.
STEP 4. Identify a second topic that you would like to explore in terms of its association with your original topic.
The second topic, which I will explore in association with my original topic, is how much the relationship with parents is linked to student behavior and school performance.
STEP 5. Add questions/items/variables documenting this second topic to your personal codebook.
The third variable, Relationship with parents, was added to try to understand if there is a relationship between a teenager who has school problems with a weak relationship and little control by parents.
STEP 6. Perform a literature review to see what research has been previously done on this topic. Use sites such as Google Scholar (http://scholar.google.com) to search for published academic work in the area(s) of interest. Try to find multiple sources, and take note of basic bibliographic information.
After reading several articles on my topic of choice, I selected a particular article to highlight that is directly related to my research question, and is called "Home Environment and Behavior Problems presented by Poorly Performing Children" written by Marlene de Cássia Trivellato Ferreira from the University of São Paulo and Edna Maria Marturano also from the University of São Paulo.
Both in the article cited above and in the others listed as reference below, they conclude that a bad family relationship can directly and negatively influence the performance and behavior of children and youth in school. "This interpretation is strengthened by the results related to family life, because the group with problems presents a higher rate of problems in parental relationships, with more indicators of family instability, a condition that has been pointed out as particularly harmful to the child's development (Ackerman et al By contrast, the group of children without behavioral problems seems to be favored by a more supportive and supplying environment, as found in the resource findings. environmental issues. "
References:
http://www.scielo.br/pdf/prc/v15n1/a05v15n1
Ackerman, B.P., Kogos, J., Youngstom, E., Schoff, K. & Izard, C. (1999). Family instability and the problem behaviors of children from economically disadvantaged families. Developmental Psychology, 35, 258-268.
Graminha, S. S. V. (1994). Rutter's Child Behavioral Scale A2: Studies of adaptation and reliability. Psychology Studies, 11, 34-42
Graminha, S. S. V. (1992). Emotional / behavioral problems and educational level of the child [Abstract]. In Brazilian Society of Psychology (Org.), Scientific Communications of the XXII Annual Meeting of Psychology (p. 22). Ribeirão Preto, SP: SBP
Parreira, V. L. C. (1995). Behavior problems in children with learning disabilities, according to mothers' report. Unpublished Master's Dissertation, Postgraduate Mental Health Course, University of São Paulo, Ribeirão Preto, SP
Thompson, R.J., Lampron L.B., Johnson, D.F. & Eckstein, T.L. (1990). Behavior problems in children with the presenting problem of poor school performance. Journal of Pediatric Psychology, 15, 3-20.
Topic used for research: Relationship between poor family relationship with school behavior.
STEP 7. Based on your literature review, develop a hypothesis about what you believe the association might be between these topics. Be sure to integrate the specific variables you selected into the hypothesis.
Taking into consideration the article by Marlene de Cássia Trivellato Ferreira and Edna Maria Marturano (2001) and the others cited in the references, I concluded that students who feel estranged or, without the supervision of their parents, are more likely to present misbehavior. school performance compared to students who feel close and do not have many problems with their parents.
Some variables used for the conclusion:
How close do you feel to your parents?
Have you ever been kicked out of school?
Do you feel happy at school?
1 note
·
View note