
Don't wanna be here? Send us removal request.
Statistics
We looked inside some of the posts by fatihbagci-ds-journey and here's what we found interesting.
Average Info
Notes Per Post
0
Likes Per Post
0
Reblog Per Post
0
Reply Per Post
0
Time Between Posts
2 days
Number of Posts By Type
Text
17
Last Seen Tumblr Blogs


Fun Fact
Tumblr was the first site to host the blog for President Barack Obama in 2011.
Text
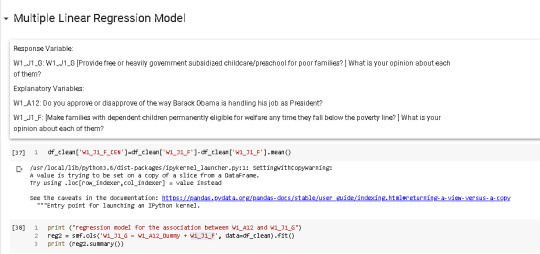
Multiple regression model
After adjusting for potential confounding factors , W1_A12 (Beta=1.87, p=.0000) was significantly and positively associated with W1_J1_G. W1_J1_F was also significantly associated with W1_J1_G, (Beta= 0.46, p=.0000). Residual errors shows qqplot show that errors are not distributed with fully normal distribution. Leverages show tat otutliers migh detoriorate the model. However, we have better model than previous single variable model.


0 notes


Text
Resume
Education
September 2008 - May 2011 Koc University, Istanbul, Turkey
MSc in Industrial Engineering & Operations Management (GPA 3.67/4.00, 1st at department)
Concentration in Robust and Stochastic Optimization
September 2004 - May 2008 Koc University, Istanbul, Turkey
BSc in Industrial Engineering (GPA 3.01/4.00)
September 2000 - May 2003 Science School, Gaziantep, Turkey (GPA 5.00/5.00)
Business Experience
May 2020 - YAPI KREDI BANK – Credit Risk Management, Istanbul
Private Individual Credit Risk Strategies Manager
• Analyzing policy rules performances and applying fine tunings on Credit Decision Support System with Powercurve
May 2016 - May 2019 YAPI KREDI BANK – Unicredit Group, Credit Risk Management, Istanbul
Private Individual Credit Risk Analytics Manager
• Managed multiple Risk Projects (Meeting various business units to identify their problem, working with credit, sales and marketing teams, defining the target according to these problems, designing the road map, providing solutions with respect to the project timeline and presenting the results)
May 2014 - May 2015 YAPI KREDI BANK – Unicredit Group, Credit Risk Management, Istanbul
Credit Risk Ratings Specialist
• Performed Risk management and data mining processes (Data preparation, user acceptance tests, statistical modelling, implementation, monitoring and documentation)
0 notes
Text
EDUCATION
September 2008 - May 2011 Koc University, Istanbul, Turkey
MSc in Industrial Engineering & Operations Management (GPA 3.67/4.00, 1st at department)
Concentration in Robust and Stochastic Optimization
September 2004 - May 2008 Koc University, Istanbul, Turkey
BSc in Industrial Engineering (GPA 3.01/4.00)
September 2000 - May 2003 Science School, Gaziantep, Turkey (GPA 5.00/5.00)
0 notes
Text
Write Captions and Descriptions about Your Work
This project was comprehensive and strategic It helped my company give underwriting decisions autamtically. I am delighted about project and the results.
0 notes
Text
Caption
Here is a project that I supervised for Private Individual customers at my bank in 2019.
0 notes
Text
Summary
I am Credit Risk Manager with 10 years experience. I am hoping you will look at my site and letting me know what you think. I am motivated and confident professional.
I am analyzing and managing the automated decision processes for Private Individual Loans and Credit Cards in terms of auto approval/rejectionI supervised the credit risk model governance studies in the scope of IFRS, IRB and all credit risk business processes. I developed and implemented new income estimation models & affordability calculation approaches
I’m flexible, respectful, responsive and eager to learn. I am experienced in team management. I build honest and close relationships with my team in order to achieve our goals in collaboration.
0 notes
Text
Headline
Credit Risk Strategies Manager: Managing multiple Credit Risk Projects to meet various business units
0 notes
Text
Writing About Your Data - - The 2012 Outlook Surveys
Summary:
The 2012 Outlook Surveys, conducted by GfK Knowledge Networks on behalf of the University of California Irvine, were designed to study political and social attitudes in the United States. The project included two surveys fielded between August and December 2012 using a sample from an Internet panel. A total of 2,294 respondents participated in this study during Wave 1 and 1,601 were interviewed during Wave 2. The target population was comprised of four groups: African American/Black males aged 18 and older, African American/Black females aged 18 and older, White/other race males aged 18 and older, and White/other race females aged 18 older, all non-institutionalized and residing in the United States. The survey considered the ways in which social class, ethnicity, marital status, feminism, religiosity, political orientation, sexual behavior, and cultural beliefs or stereotypes influence opinion and behavior. Participants were asked an array of questions pertaining to voting preference, party identification, respondent perception of opportunity for success, and views on interracial dating. These variables and questions examine political and social attitudes in the United States. Additional questions addressed issues such as common fate, nationalism, equality, discrimination, and relations with law enforcement. Demographic variables include race ethnicity, age, gender, religious involvement, sexual orientation, citizenship, annual income, and education.
Methodology
Study Purpose: The purpose of the 2012 Outlook Surveys were to study political and social attitudes in the United States. The specific purpose of the survey is to consider the ways in which social class, ethnicity, marital status, feminism, religiosity, political orientation, and cultural beliefs or stereotypes influence opinion and behavior.
Study Design: The project included two surveys fielded between August and December 2012 using a sample from an Internet panel. A total of 2,294 respondents participated in this study; 1,601 were re-interviewed. The survey also contained a large oversample of Black ethnics.
Sample: Participants were drawn from the GfK Knowledge Network, a web panel designed to be representative of the Unites States population. Panel members are randomly recruited through probability-based sampling, and households are provided with access to the Internet and hardware if needed. Random-digit dialing and address-based sampling methodologies are used. The target population were non-institutionalized adults 18 years of age and older. Time Method: Cross-sectional , Cross-sectional ad-hoc follow-up
Kind of Data: quantitative
Mode of Data Collection: web-based survey
Description of Variables: The data include variables pertaining to social class, ethnicity, marital status, feminism, religiosity, and political orientation. In addition there are variables pertaining to gender, household composition and size, household income, employment status, education, and marital status.
Response Rates: Wave 1: 55.3 percent response rate. Wave 2: 75.1 percent response rate.
0 notes
Text
Pearson Correlation with Moderator
Pearson Correlation between two variables(explained below) is 0.59 and p value is below 0.05. It shows that there is positive linear correlation between these varibles and this statistics is significant. However, this correlation is not so strong.
After that I examined the varable “ W1_A12″ in order to examine it is moderator or not.
It seems that this variable did not change the sigh of the correlation and it did not change the magnitude of the correlation so much. Then, I conclude that it is not a moderator between W1_J1_G and W1_J1_F.
#W1_J1_G: [Provide free or heavily government subsidized childcare/preschool for poor families? ] What is your opinion about each of them?
#W1_J1_F: [Make families with dependent children permanently eligible for welfare any time they fall below the poverty line? ] What is your opinion about each of them?
#W1_A12: Do you approve or disapprove of the way Barack Obama is handling his job as President?
Please find my codes below,


0 notes
Text
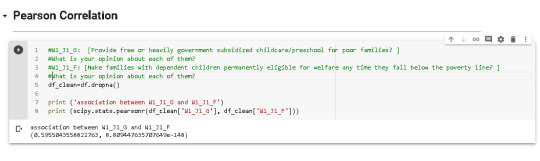
Pearson Correlation Analysis
Pearson Correlation between two variables(explained below) is 0.59 and p value is below 0.05. It shows that there is positive linear correlation between these varibles and this statistics is significant. However, this correlation is not so strong.
#W1_J1_G: [Provide free or heavily government subsidized childcare/preschool for poor families? ] What is your opinion about each of them?
#W1_J1_F: [Make families with dependent children permanently eligible for welfare any time they fall below the poverty line? ] What is your opinion about each of them?
Please find my codes below,
0 notes
Text
Running a Chi-Square Test of Independence
Please find my codes and comments in the pictures below. Best regards


0 notes
Text
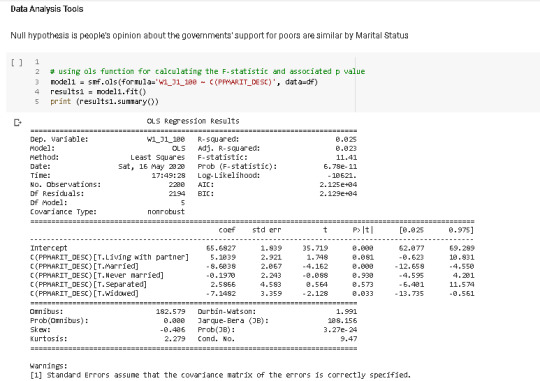
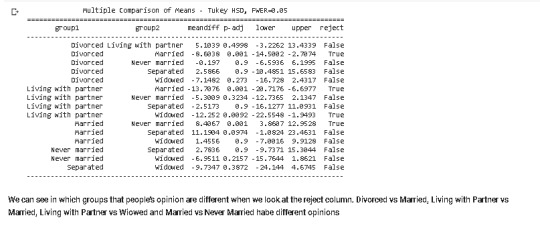
Running an analysis of variance
Please find my comments and codes in the photos. Best regards

0 notes
Text
Data Management and Visualization_Coursera week4
My Code is below;
# -*- coding: utf-8 -*- """Data Management and Visualization_Coursera.ipynb
Automatically generated by Colaboratory.
Original file is located at https://colab.research.google.com/drive/146xYDqig6qfpJ8y8mCn4uErXNhADpFUG
Importing Libraries """
import pandas as pd import numpy as np
import seaborn import matplotlib.pyplot as plt
"""Importing Data and Preview of Data"""
df = pd.read_csv('ool_pds.csv',index_col=0) df.head()
print (len(df)) #number of observations (rows) print (len(df.columns)) # number of variables (columns)
"""Converting Data Types"""
#W1_E2: How optimistic are you that you will develop a serious and/or marital relationship? df["W1_E1"] = df["W1_E1"].apply(pd.to_numeric, errors='coerce') #W1_E3: Some people engage in interracial relationships, while others do not. Have you dated outside of your racial group? df["W1_E3"] = df["W1_E3"].apply(pd.to_numeric, errors='coerce') #PPMARIT: Marital Status df["PPMARIT"] = df["PPMARIT"].apply(pd.to_numeric, errors='coerce') #W1_J1_G: W1_J1_G [Provide free or heavily government subsidized childcare/preschool for poor families? ] What is your opinion about each of them? df["W1_J1_G"] = df["W1_J1_G"].apply(pd.to_numeric, errors='coerce')
#W1_J1_F: [Make families with dependent children permanently eligible for welfare any time they fall below the poverty line? ] What is your opinion about each of them? df["W1_J1_F"] = df["W1_J1_F"].apply(pd.to_numeric, errors='coerce')
"""The frequency distributions of selected variables"""
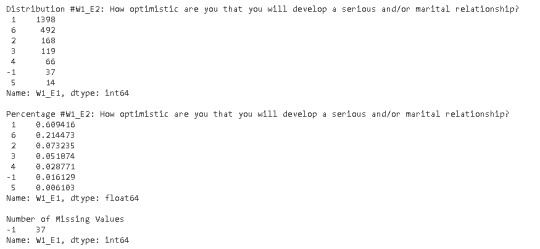
print('Distribution #W1_E2: How optimistic are you that you will develop a serious and/or marital relationship?') d1 = df['W1_E1'].value_counts(sort=True, dropna=False) print(d1) print('') print ('Percentage #W1_E2: How optimistic are you that you will develop a serious and/or marital relationship?') p1= df['W1_E1'].value_counts(sort=True, normalize=True) print (p1) print('') print ('Number of Missing Values') print (d1.iloc[5:6])
print('Distribution #W1_E3: Some people engage in interracial relationships, while others do not. Have you dated outside of your racial group?') d1 = df['W1_E3'].value_counts(sort=True, dropna=False) print(d1) print('') print ('Percentage #W1_E3: Some people engage in interracial relationships, while others do not. Have you dated outside of your racial group?') p1= df['W1_E3'].value_counts(sort=True, normalize=True) print (p1) print('') print ('Number of Missing Values') print (d1.iloc[2:3])
print('Distribution #PPMARIT: Marital Status') d1 = df['PPMARIT'].value_counts(sort=True, dropna=False) print(d1) print('') print (' Marital Status') p1= df['PPMARIT'].value_counts(sort=True, normalize=True) print (p1) print (' No Missing Values')
print('Distribution #W1_J1_G [Provide free or heavily government subsidized childcare/preschool for poor families? ] What is your opinion about each of them? ') d1 = df['W1_J1_G'].value_counts(sort=True, dropna=False) print(d1) print('') print ('Percentage W1_J1_G [Provide free or heavily government subsidized childcare/preschool for poor families? ] What is your opinion about each of them? ') p1= df['W1_J1_G'].value_counts(sort=True, normalize=True) print (p1) print('') print ('Number of Missing Values') print (d1.iloc[9:10])
# recode missing values to python missing (NaN) df["W1_E1"]=df["W1_E1"].replace(-1, np.nan) df["W1_E3"]=df["W1_E3"].replace(-1, np.nan) df["W1_J1_G"]=df["W1_J1_G"].replace(-1, np.nan) df["W1_J1_F"]=df["W1_J1_F"].replace(-1, np.nan) df["PPMARIT"]=df["PPMARIT"].replace(-1, np.nan) d1 = df['W1_E1'].value_counts(sort=True, dropna=False) print(d1) d1 = df['W1_E3'].value_counts(sort=True, dropna=False) print(d1) d1 = df['W1_J1_G'].value_counts(sort=True, dropna=False) print(d1) d1 = df['PPMARIT'].value_counts(sort=True, dropna=False) print(d1)
#recoding values for PPMARIT into a new variable, PPMARIT_DESC recode1 = {1: "Married", 2: "Widowed", 3: "Divorced", 4: "Separated", 5: "Never married", 6: "Living with partner"} df["PPMARIT_DESC"]=df["PPMARIT"].map(recode1) df["PPMARIT_DESC"]
#secondary variable W1_J1_G into 100 , W1_J1_100 df['W1_J1_100']=df['W1_J1_G'] * 10 df['W1_J1_100']
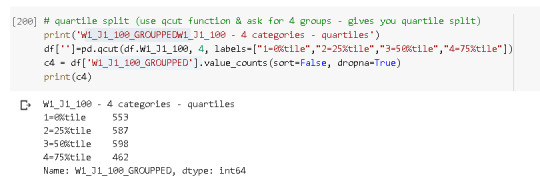
# quartile split (use qcut function & ask for 4 groups - gives you quartile split) print('W1_J1_100_GROUPPED W1_J1_100 - 4 categories - quartiles') df['W1_J1_100_GROUPPED']=pd.qcut(df.W1_J1_100, 4, labels=["1=0%tile","2=25%tile","3=50%tile","4=75%tile"]) c4 = df['W1_J1_100_GROUPPED'].value_counts(sort=False, dropna=True) print(c4)
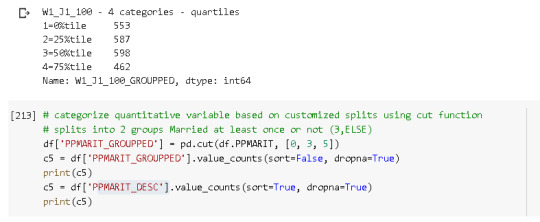
# categorize quantitative variable based on customized splits using cut function # splits into 2 groups Married at least once or not (3,ELSE) df['PPMARIT_GROUPPED'] = pd.cut(df.PPMARIT, [0, 3, 5]) c5 = df['PPMARIT_GROUPPED'].value_counts(sort=False, dropna=True) print(c5) c5 = df['PPMARIT_DESC'].value_counts(sort=True, dropna=True) print(c5)
print (pd.crosstab(df['PPMARIT_GROUPPED'], df['PPMARIT_DESC']))
#new ETHNICITY variable, categorical 1 through 6 def MARRIED_FLG (row): if row['PPMARIT'] == 1 : return 1 elif row['PPMARIT'] > 1 : return 0
df['MARRIED_FLG'] = df.apply (lambda row: MARRIED_FLG (row),axis=1)
print (pd.crosstab(df['MARRIED_FLG'], df['PPMARIT_DESC']))
"""Graphs and Viualization"""
seaborn.countplot(x="PPMARIT_DESC", data=df) plt.xlabel('Marital Status') plt.title('Marital Status Distrubiton in the OOL Study') plt.xticks(rotation=30)
#Univariate histogram for quantitative variable: seaborn.distplot(df["W1_J1_100"].dropna(), kde=False); plt.xlabel('Opinion of participants') plt.title('The distribution of opinion(1-100) of providig free or heavily government subsidized childcare/preschool for poor families?')
# standard deviation and other descriptive statistics for quantitative variables print('The distribution of opinion(1-100) of providig free or heavily government subsidized childcare/preschool for poor families?') desc1 = df['W1_J1_100'].describe() print(desc1)
size= df.groupby('W1_J1_100').size() mode= df['W1_J1_100'].mode() mean= df['W1_J1_100'].mean() print('size') print(size) print('mode') print(mode) print('mean') print(mean)
# bivariate bar graph C->Q seaborn.factorplot(x="PPMARIT_DESC", y="W1_J1_100", data=df, kind="bar", ci=None) plt.xlabel('Marital Status') plt.ylabel('opinion(1-100) of providig free or heavily government subsidized childcare/preschool for poor') plt.xticks(rotation=30)
scat1 = seaborn.regplot(x="W1_J1_G", y="W1_J1_F", fit_reg=False, data=df) plt.xlabel('[Provide free or heavily government subsidized for poor families? ] ') plt.ylabel('[Make families with dependent children permanently eligible? ]') plt.title(' Goverment Subsiziding Poors and Welfare Support')
Please find my visualizations below;


0 notes
Text
Data Management and Visualization_Coursera week3
# -*- coding: utf-8 -*- """Data Management and Visualization_Coursera.ipynb
Automatically generated by Colaboratory.
Original file is located at https://colab.research.google.com/drive/146xYDqig6qfpJ8y8mCn4uErXNhADpFUG
Importing Libraries """
import pandas as pd import numpy as np
"""Importing Data and Preview of Data"""
df = pd.read_csv('ool_pds.csv',index_col=0) df.head()
print (len(df)) #number of observations (rows) print (len(df.columns)) # number of variables (columns)
"""Converting Data Types"""
#W1_E2: How optimistic are you that you will develop a serious and/or marital relationship? df["W1_E1"] = df["W1_E1"].apply(pd.to_numeric, errors='coerce') #W1_E3: Some people engage in interracial relationships, while others do not. Have you dated outside of your racial group? df["W1_E3"] = df["W1_E3"].apply(pd.to_numeric, errors='coerce') #PPMARIT: Marital Status df["PPMARIT"] = df["PPMARIT"].apply(pd.to_numeric, errors='coerce') #W1_J1_G: W1_J1_G [Provide free or heavily government subsidized childcare/preschool for poor families? ] What is your opinion about each of them? df["W1_J1_G"] = df["W1_J1_G"].apply(pd.to_numeric, errors='coerce')
"""The frequency distributions of selected variables"""
print('Distribution #W1_E2: How optimistic are you that you will develop a serious and/or marital relationship?') d1 = df['W1_E1'].value_counts(sort=True, dropna=False) print(d1) print('') print ('Percentage #W1_E2: How optimistic are you that you will develop a serious and/or marital relationship?') p1= df['W1_E1'].value_counts(sort=True, normalize=True) print (p1) print('') print ('Number of Missing Values') print (d1.iloc[5:6])
print('Distribution #W1_E3: Some people engage in interracial relationships, while others do not. Have you dated outside of your racial group?') d1 = df['W1_E3'].value_counts(sort=True, dropna=False) print(d1) print('') print ('Percentage #W1_E3: Some people engage in interracial relationships, while others do not. Have you dated outside of your racial group?') p1= df['W1_E3'].value_counts(sort=True, normalize=True) print (p1) print('') print ('Number of Missing Values') print (d1.iloc[2:3])
print('Distribution #PPMARIT: Marital Status') d1 = df['PPMARIT'].value_counts(sort=True, dropna=False) print(d1) print('') print (' Marital Status') p1= df['PPMARIT'].value_counts(sort=True, normalize=True) print (p1) print (' No Missing Values')
print('Distribution #W1_J1_G [Provide free or heavily government subsidized childcare/preschool for poor families? ] What is your opinion about each of them? ') d1 = df['W1_J1_G'].value_counts(sort=True, dropna=False) print(d1) print('') print ('Percentage W1_J1_G [Provide free or heavily government subsidized childcare/preschool for poor families? ] What is your opinion about each of them? ') p1= df['W1_J1_G'].value_counts(sort=True, normalize=True) print (p1) print('') print ('Number of Missing Values') print (d1.iloc[9:10])
# recode missing values to python missing (NaN) df["W1_E1"]=df["W1_E1"].replace(-1, np.nan) df["W1_E3"]=df["W1_E3"].replace(-1, np.nan) df["W1_J1_G"]=df["W1_J1_G"].replace(-1, np.nan) df["PPMARIT"]=df["PPMARIT"].replace(-1, np.nan) d1 = df['W1_E1'].value_counts(sort=True, dropna=False) print(d1) d1 = df['W1_E3'].value_counts(sort=True, dropna=False) print(d1) d1 = df['W1_J1_G'].value_counts(sort=True, dropna=False) print(d1) d1 = df['PPMARIT'].value_counts(sort=True, dropna=False) print(d1)
#recoding values for PPMARIT into a new variable, PPMARIT_DESC recode1 = {1: "Married", 2: "Widowed", 3: "Divorced", 4: "Separated", 5: "Never married", 6: "Living with partner"} df["PPMARIT_DESC"]=df["PPMARIT"].map(recode1) df["PPMARIT_DESC"]
#secondary variable W1_J1_G into 100 , W1_J1_100 df['W1_J1_100']=df['W1_J1_G'] * 10 df['W1_J1_100']
# quartile split (use qcut function & ask for 4 groups - gives you quartile split) print('W1_J1_100_GROUPPEDW1_J1_100 - 4 categories - quartiles') df['']=pd.qcut(df.W1_J1_100, 4, labels=["1=0%tile","2=25%tile","3=50%tile","4=75%tile"]) c4 = df['W1_J1_100_GROUPPED'].value_counts(sort=False, dropna=True) print(c4)
# categorize quantitative variable based on customized splits using cut function # splits into 2 groups Married at least once or not (3,ELSE) df['PPMARIT_GROUPPED'] = pd.cut(df.PPMARIT, [0, 3, 5]) c5 = df['PPMARIT_GROUPPED'].value_counts(sort=False, dropna=True) print(c5) c5 = df['PPMARIT_DESC'].value_counts(sort=True, dropna=True) print(c5)
print (pd.crosstab(df['PPMARIT_GROUPPED'], df['PPMARIT_DESC']))
#new ETHNICITY variable, categorical 1 through 6 def MARRIED_FLG (row): if row['PPMARIT'] == 1 : return 1 elif row['PPMARIT'] > 1 : return 0
df['MARRIED_FLG'] = df.apply (lambda row: MARRIED_FLG (row),axis=1)
print (pd.crosstab(df['MARRIED_FLG'], df['PPMARIT_DESC']))
Please find my outputs below;


0 notes
Text
Data Management and Visualization_Coursera week2
My Code is:
# -*- coding: utf-8 -*- """Data Management and Visualization_Coursera.ipynb
Automatically generated by Colaboratory.
Original file is located at https://colab.research.google.com/drive/146xYDqig6qfpJ8y8mCn4uErXNhADpFUG
Importing Libraries """
import pandas as pd import numpy as np
"""Importing Data and Preview of Data"""
df = pd.read_csv('ool_pds.csv',index_col=0) df.head()
print (len(df)) #number of observations (rows) print (len(df.columns)) # number of variables (columns)
"""Converting Data Types"""
#W1_E2: How optimistic are you that you will develop a serious and/or marital relationship? df["W1_E1"] = df["W1_E1"].apply(pd.to_numeric, errors='coerce') #W1_E3: Some people engage in interracial relationships, while others do not. Have you dated outside of your racial group? df["W1_E3"] = df["W1_E3"].apply(pd.to_numeric, errors='coerce') #PPMARIT: Marital Status df["PPMARIT"] = df["PPMARIT"].apply(pd.to_numeric, errors='coerce')
"""The frequency distributions of selected variables"""
print('Distribution #W1_E2: How optimistic are you that you will develop a serious and/or marital relationship?') d1 = df['W1_E1'].value_counts(sort=True, dropna=False) print(d1) print('') print ('Percentage #W1_E2: How optimistic are you that you will develop a serious and/or marital relationship?') p1= df['W1_E1'].value_counts(sort=True, normalize=True) print (p1) print('') print ('Number of Missing Values') print (d1.iloc[5:6])
print('Distribution #W1_E3: Some people engage in interracial relationships, while others do not. Have you dated outside of your racial group?') d1 = df['W1_E3'].value_counts(sort=True, dropna=False) print(d1) print('') print ('Percentage #W1_E3: Some people engage in interracial relationships, while others do not. Have you dated outside of your racial group?') p1= df['W1_E3'].value_counts(sort=True, normalize=True) print (p1) print('') print ('Number of Missing Values') print (d1.iloc[2:3])
print('Distribution #PPMARIT: Marital Status') d1 = df['PPMARIT'].value_counts(sort=True, dropna=False) print(d1) print('') print (' Marital Status') p1= df['PPMARIT'].value_counts(sort=True, normalize=True) print (p1)
Results are shown below;


0 notes
Text
Democracy and Women Workforce
After looking through the codebook for the portion of the GapMinder data includes one year of numerous country-level indicators of health, wealth and development. I have decided that I am particularly interested in Democracy score . I am not sure which variables I will use regarding Democracy score (e.g. symptoms or diagnosis), so for now I will include all of the relevant variables in my personal codebook.
While Democracy score is a good starting point, I need to determine what it is about Democracy score that I am interested in. It strikes me that how the other factors such as oil consumption, female employment etc. affects the development in democracy.
I decide that I am most interested in exploring the association between democracy score and female employment. I add to my codebook all variables since all I want to examine the other ones and my number variables are few. However, I strongly believe that while female employment increases, democray will be strong and I will examine this with data.
There are many articles about the relation with female employment and political democracy such as:
Work and Power: The Connection Between Female Labor Force Participation and Female Political Representation
(https://wcfia.harvard.edu/files/wcfia/files/iversen_workandpower.pdf)
Democracy, Representation, and Women: A Comparative Analysis
(https://www.jstor.org/stable/24719397?seq=1)
Female Empowerment as a Core Driver of Democratic Development: A Dynamic Panel Model from 1980 to 2005
(https://linkinghub.elsevier.com/retrieve/pii/S0305750X13001502)
All researchers try to find relation with the female participation in workforce and democracy and they try to explain how this is possible.
It seems that economic development increases the workforce in females and also democraticness of the country.
0 notes