
Weekly tutorials, how to's and explanatory articles about Google Analytics and Google Tag Manager.
Don't wanna be here? Send us removal request.
Statistics
We looked inside some of the posts by google-analytics-digest-blog and here's what we found interesting.
Average Info
Notes Per Post
1
Likes Per Post
1
Reblog Per Post
0
Reply Per Post
0
Time Between Posts
13 days
Number of Posts By Type
Text
3
Last Seen Tumblr Blogs


Fun Fact
In 2020, 27% of US Tumblr users had an annual household income of over $100,000.
Text
How to install Mixpanel via Google Tag Manager
Mixpanel is one of the best tracking tool for SAAS companies or web applications, which involve users logging in to get access to product or service. Mixpanel offers granular detail that’s essential for monitoring user behavior for such type of websites, which often, is very hard to track with Google Analytics.
While Google Analytics works best at helping you understand which traffic sources generate more conversions, Mixpanel is better at measuring how users are interacting and using the website – a need which most of the SAAS companies have.
And since it is so much convenient to have Mixpanel installed on the site via Google Tag Manager, in this post we will analyze how to get the tracking set up via GTM.
First and foremost, you need to create an account both on Mixpanel and for GTM. After this, you need to install the Mixpanel library by adding the library’s code snippet in GTM.
For this you need to copy the snippet from the JavaScript integration page and replace ‘Your Token’ with the token from your project page.
The Javascript code should look something like this:
<!-- start Mixpanel -->
<script type="text/javascript"> (function(c,a){if(!a.__SV){var b=window;try{var d,m,j,k=b.location,f=k.hash;d=function(a,b){return(m=a.match(RegExp(b+"=([^&]*)")))?m[1]:null};f&&d(f,"state")&&(j=JSON.parse(decodeURIComponent(d(f,"state"))),"mpeditor"===j.action&&(b.sessionStorage.setItem("_mpcehash",f),history.replaceState(j.desiredHash||"",c.title,k.pathname+k.search)))}catch(n){}var l,h;window.mixpanel=a;a._i=[];a.init=function(b,d,g){function c(b,i){var a=i.split(".");2==a.length&&(b=b[a[0]],i=a[1]);b[i]=function(){b.push([i].concat(Array.prototype.slice.call(arguments,
0)))}}var e=a;"undefined"!==typeof g?e=a[g]=[]:g="mixpanel";e.people=e.people||[];e.toString=function(b){var a="mixpanel";"mixpanel"!==g&&(a+="."+g);b||(a+=" (stub)");return a};e.people.toString=function(){return e.toString(1)+".people (stub)"};l="disable time_event track track_pageview track_links track_forms track_with_groups add_group set_group remove_group register register_once alias unregister identify name_tag set_config reset opt_in_tracking opt_out_tracking has_opted_in_tracking has_opted_out_tracking clear_opt_in_out_tracking people.set people.set_once people.unset people.increment people.append people.union people.track_charge people.clear_charges people.delete_user people.remove".split(" ");
for(h=0;h<l.length;h++)c(e,l[h]);var f="set set_once union unset remove delete".split(" ");e.get_group=function(){function a(c){b[c]=function(){call2_args=arguments;call2=[c].concat(Array.prototype.slice.call(call2_args,0));e.push([d,call2])}}for(var b={},d=["get_group"].concat(Array.prototype.slice.call(arguments,0)),c=0;c<f.length;c++)a(f[c]);return b};a._i.push([b,d,g])};a.__SV=1.2;b=c.createElement("script");b.type="text/javascript";b.async=!0;b.src="undefined"!==typeof MIXPANEL_CUSTOM_LIB_URL?
MIXPANEL_CUSTOM_LIB_URL:"file:"===c.location.protocol&&"//cdn.mxpnl.com/libs/mixpanel-2-latest.min.js".match(/^\/\//)?"https://cdn.mxpnl.com/libs/mixpanel-2-latest.min.js":"//cdn.mxpnl.com/libs/mixpanel-2-latest.min.js";d=c.getElementsByTagName("script")[0];d.parentNode.insertBefore(b,d)}})(document,window.mixpanel||[]);
mixpanel.init("YOUR TOKEN"); </script>
<!-- end Mixpanel -->
After we have copied the code, in GTM we need to create a new Custom HTML tag, paste the code in it, give it a descriptive name and save the tag. As a targeting rule, we should set it to fire on All pages. We also need to set the firing priority to 0 by clicking on the Advanced button when creating the tag,

Tracking page views
After installing the Mixpanel library, we need to create a simple pageview event that dynamically includes the page’s path (e.g., /contact/) as an event property. For this, we need to enable the built-in ‘page path’ variable in GTM
To start tracking page views, we will use the standard mixpanel.track()function.
For this, we need to create a new custom HTML tag and enter this code snippet tag in the "Configure" tag step:
var pagePath = {{Page Path}}; mixpanel.track("Page Loaded", {"Page Path": pagePath});
Then for the trigger, we can use the same All pages trigger which we used previously. After this we click on Save and out pageview tracking is ready.
Since Google Tag manager fires on every page on which it’s implemented, we don’t need to worry about adding this code manually to each new page.
Tracking Link Clicks
To add the link click tracking, we need to enable the Click Text default GTM variable, then we need to create a new Custom HTML tag and paste the below code in it:
<script type="text/javascript">
var linkID = {{Click Text}} ;
mixpanel.track("Link Clicked", {"Link Name": linkID});
</script>

Then, as a trigger we need to create a simple Link Click trigger and use it for this tag. Then we click on save and our link click tracking is ready. And this is how to set up the basic pageview and link click tracking in Mixpanel with Google Tag Manager.
0 notes
Text
Google Analytics extension for Google Sheets Guide
If you have ever felt that the default Google Analytics interface is limiting you to view and explore the data of your website, then this post is for you.
If you work with the default Google Analytics interface, sooner or later you will want to view some data which is not offered by the build-in reports from GA. A classic example of this might be a pivot table with 2 or more custom dimensions, which cannot be viewed by default.
And for these specific cases, you can use the Google Analytics add-on extension from Google Sheets to view the data in any way you need.
1. How to install the Google Analytics extension
Open a blank spreadsheet and from the top menu, go to Add-ons / Get add-ons. In the window which appeared, type “Google Analytics” in the search bar and once the search results appear, click on the “Free” button from the right to install it.
After several seconds, the new add-on will be installed and you can access it from the Add-on menu.
2. How to configure the add-on to import data from Google Analyitcs
Go to Add-ons from the main menu, then navigate to “Google Analytics” then select “Create New Report”.

In the window that appeared, you need to enter a name for your report, select the account, property and view from which you want to get the data and then you need to enter the metrics and dimensions you want to import. After this click on “Create report” from the bottom.

After this a new sheet called “Report Configuration” will appear in which you can see the previous configurations you entered with some additional options like start date, end date, filter, segments, etc.
The following parameters need to be added in the configuration before you can run the query:
Report Name - In this field you need to enter the report name. It will also be the name of the sheet where the report data is written.
View ID - The ID of the Google Analytics view. You can get this value from the Google Analytics account admin.
Start Date - The start date for which you want to get Analytics data. The format can be as YYYY-MM-DD, or as a relative date (e.g., today, yesterday, or NdaysAgo where N is a positive integer).
End Date - The end date from which you want to get Analytics data. The format can be as YYYY-MM-DD, or as a relative date (e.g., today, yesterday, or NdaysAgo where N is a positive integer).
Metrics and dimensions - A list of metrics to query. Some examples include: ga:sessions,ga:bounces, ga:sessions. ga:bounces. The full list of dimensions and metrics and their valid combinations is available using the Dimensions and Metrics Explorer.
3. How to get data to Google Sheets
After we have configured the Google Analytics add-on, we need to run the query by going to Add-ons / Google Analytics / Run report. This will connect to Google Analytics and extract the data and save it in a new sheet with the same name as your report name.
0 notes
Text
Google Analytics for Newbies: What is it, how does it work and what can you do with it.
Google Analytics is one of the many free tools offered by Google to help you and your team to analyze your website traffic and track your digital marketing efforts effectiveness, that is why in this article we want you to get the basic Google Analytics help so that you would have a general idea of what is it, how it works and how you can use it.
Known for its ease of use and installation, Google Analytics is considered the gold standard when it comes to online tracking. It gives powerful insights and actionable information as soon as you add the script on your internet site, this is why more than 50 million websites all over the world use it for tracking user behavior and website interaction.
Even though “web analytics” seems to be a really small part of your business digital presence, the implications of Google Analytics are huge and often missed by the marketing team.
This is because for the majority of online companies, their website is the center of all their digital traffic. If you're running any marketing activities such as Twitter or Facebook ads, or Google Ads, your users are likely going to see your website somewhere along their user journey. And this is even more true if you run remarketing campaign.
With this in mind, tracking your website and how user interact with it is the best solution to offer you a 360-degree view of how your marketing campaigns run and if they are effective or not.
In a nutshell, Google tracking works by adding a small bit of Javascript code on your website, which in turn gathers data about your website visitors and how they choose and interact with your website. The tracking code looks like in the screenshot below:

When you create your Google Analytics account, you will need to include this script in your website and you'll start receiving data in your account. By default, you will track only the basic information such as pageviews, where are users from, how they got to the site, etc.
Once it's setup, Google Analytics will drop a cookie in the user's browser for the website. It will help to track (almost) every interaction that user performs in your site. By default events such as video views, scroll tracking, button clicks, etc are not tracked and the tracking needs to be manually installed by a Google Analytics expert.
An interaction is any form of actions users perform in your website. They can be as simple as loading a page or something more specific like clicking an external link or a video play or pause button.With each user interaction on your website, the tracking code sends a bit of information to Google Analytics about your users and their interactions in your website. The information sent by the tracking code is called a hit (commonly referred to as a payload hit).
A payload hit is a URL string with parameters of detailed information about your users which looks something just like the code in the image below.
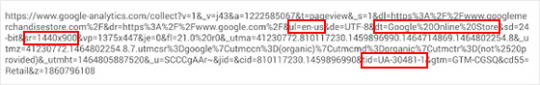
The URL string shown in the image above passes some specific information to Analytics about the user that triggered the hit. The highlighted parts are what information we are able to see when we breakdown the string. It usually contains information about:
User's browser language;
Google Analytics ID which allows you to see the data in your account;
The page path user is viewing and its name;
Screen resolution, browser, operating system and device which the user is using;
Moreover, Google Analytics expands the collected data using other sources like IP address, server-log files, and other ad-serving data. Using the widened additional data, it can understand things such as a user's location, age, gender, their browser, os, etc.
The information passed through the hits varies by different types of user interactions. Most common hit types are:
Pageview hit: This is by far the most common used hit type. It's triggered when a person loads a webpage with the tracking code in your site.
Event hit: An event hit is sent when a person interacts with a specific element in your website like a button or a form submission. It has 3 main components: Event category, action and label.
Transaction hit: The transaction hit passes data in related to ecommerce activities, usually purchases and it includes product being purchased, its name, id, some attributes like color, size, shipping, etc.
Other than these common hits, there are also social hits which are used to track social shares action on a website, like when a user clicks on Share to Facebook button, but they are not that popular or easy to install.
In a best case scenario, GA can be used by your marketing team to enhance their decision making process by shifting the reason from personal ideas or ‘hunches’ to data driven decisions backed up by data.
By default, the data and insights provided by Google Analytics can be access in the following reports:
Acquisition – Shows the traffic sources that users used to arrive to your website;
Audience – A collection of reports that show demographic like characteristics of your users and their interactions with the site.
Behavior – Shows what pages users visited, how long they spent on the pages, where they exited and the overall site navigation.
Conversions – This is one of the most important reports and it shows how many conversions users made on the site, which in turn allows you to see which are the more valuable traffic sources or paid advertising campaigns and to shift your focus on them.
Hope this article provided value and tackled some of the questions which you might have had about Google Analytics. If you still have a particular question in mind, feel free to post a comment.
1 note
·
View note