~~~ Artistic, yet scientifically accurate maps from a geographer. ~~~ Grasshopper Geography actually grew from some hobby projects and maps I shared on Imgur, ages ago. Becoming an independent artist was quite a rollercoaster, involving lots of sitting in cubicles, some traveling and volunteering, even working with whales and orangutans. For a short history and my works visit www.grasshoppergeography.com. Also, commissions are open, send an ask/message if interested. Cheers, Robert, a GIS Analyst / Digital Cartographer from Hungary
Don't wanna be here? Send us removal request.
Statistics
We looked inside some of the posts by grasshoppergeography and here's what we found interesting.
Average Info
Notes Per Post
3K
Likes Per Post
2K
Reblog Per Post
885
Reply Per Post
17
Time Between Posts
4 days
Number of Posts By Type
Text
14
Photo
3
Last Seen Tumblr Blogs


Fun Fact
130K people were victims of a chain letter scam that affected Tumblr in May 2011.
Text
Show Your Stripes

It's #ShowYourStripes day!
Created by Ed Hawkins, the warming stripes are "visual representations of the change in temperature as measured in each country over the past 100+ years. Each stripe or bar represents the temperature in that country averaged over a year. For most countries, the stripes start in the year 1901 and finish in 2021."
One of the best ways to fight climate change is to talk about it, and these stripes are clearly great conversation starters. If not today, then when?
Check your own country and cry. Then show it to the world, so they can cry too.
16 notes
·
View notes
Photo
It's Cascadia Day today!
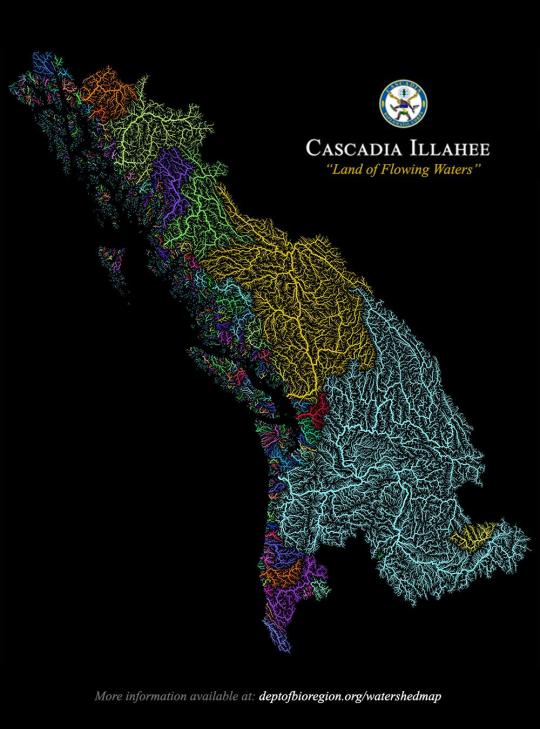
River basins of the Pacific Northwest.
170 notes
·
View notes


Text

Some OSR style hexes I made just for fun.
201 notes
·
View notes
Text
"Earth's Treasure"

Streams of blue and yellow braid across Iceland’s volcanic landscape in this award-winning photo from Miki Spitzer. Glacial water shows an icy blue and sediments glisten in gold. Together, their interplay creates an arresting delta viewed from above. (Image credit: M. Spitzer; via WNPA) Read the full article
357 notes
·
View notes
Text
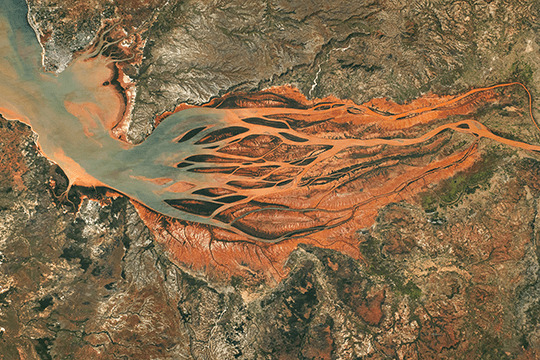
Melting Permafrost Stains Alaskan Rivers Orange
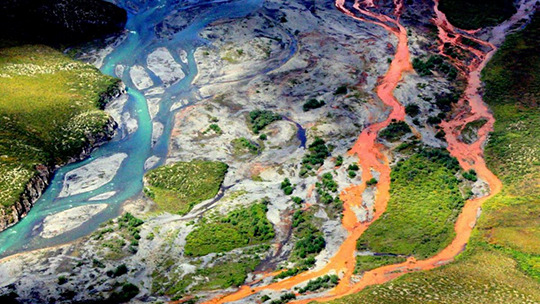
The swiftly melting permafrost of the Arctic is releasing toxic metals like zinc, cadmium, and iron into Alaskan waterways. The contaminant levels are so high that it’s staining many rivers orange – a feature that can be seen from space. (Image credit: K. Hill/National Park Service; research credit: J. O'Donnell et al.; via LiveScience; submitted by Emily R.) Read the full article
163 notes
·
View notes
Text
Sediment Swirls

Turbulent flows feature swirling eddies over a range of sizes – the larger the size range, the higher the Reynolds number. In this satellite image, sediment highlights these eddies in shades of turquoise, showing off the complexity of the flows created where rivers, ocean, and tides meet. (Image credit: L. Dauphin; via NASA Earth Observatory) Read the full article
153 notes
·
View notes
Text
"Colors of Glacial Rivers"

As glaciers flow, they grind down rock, creating fine sediment that dyes waterways a milky color. In Jan Erik Waider’s aerial film, we get a bird’s eye view of the result, watching pockets of sediment move downstream in pulsating waves and swirls. (Image and video credit: J. Waider; via Colossal) Read the full article
76 notes
·
View notes
Text
If you want to know more about the Colorado River and its watershed or if you're interested in helping, LIVING RIVER is a good starting point:
Who Killed the Colorado River?

From its source high in the snowy Rocky Mountains, the Colorado River runs through two countries and five states on its way to the Gulf of California. Or at least it used to. The river hasn’t met the sea in decades. (Video and image credit: PBS Terra) Read the full article
163 notes
·
View notes
Text
Growing Downstream
This astronaut photo shows Madagascar’s largest estuary, as of 2024. On the right side, the Betsiboka River flows northwest (right to left, in the image). (Image credit: NASA; via NASA Earth Observatory) Read the full article
87 notes
·
View notes
Text
Tracking Coastal Sediment Loss

Shorelines rely on an influx of sediment to counter what’s lost to erosion by waves and currents. But tracking that sediment flux is challenging in coastal regions where salt, waves, and storms batter delicate instruments. (Image credit: NASA; research credit: W. Teng et al.; via Eos) Read the full article
110 notes
·
View notes
Text
Mapping the Oceans With Seals

Elephant seals are harbingers – canaries in the coal mine – for climate change. A long-running experiment tracks northern elephant seal populations using a combination of sensor tags and field measurements. (Video and image credit: Science) Read the full article
77 notes
·
View notes
Text
My US river basin map is in this video :)
The above link seems to be broken, watch the video here:
Why Nature Loves Fractals

Trees, blood vessels, and rivers all follow branching patterns that make their pieces look very similar to their whole. We call this repeating, self-similar shape a fractal, and this Be Smart video explores why these branching patterns are so common. (Video and image credit: Be Smart) Read the full article
100 notes
·
View notes
Text
"Lively"
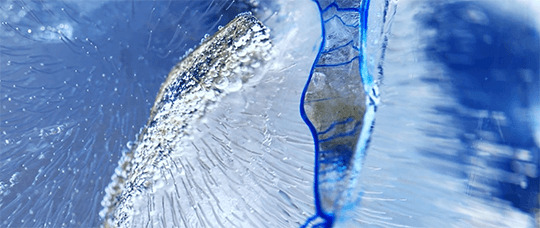
In “Lively,” filmmaker Christopher Dormoy zooms in on ice. He shows ice forming and melting, capturing bubbles and their trails, as well as the subtle flows that go on in and around the ice. (Video and image credit: C. Dormoy) Read the full article
48 notes
·
View notes
Photo
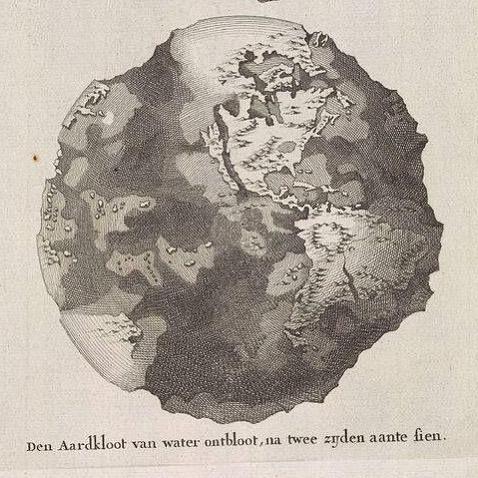
Earth without water, by Thomas Burnet, ca. 1700⠀ ⠀ Note California depicted as an island. See more maps depicting California adrift from the mainland here — https://publicdomainreview.org/collection/maps-showing-california-as-an-island
73 notes
·
View notes
Photo
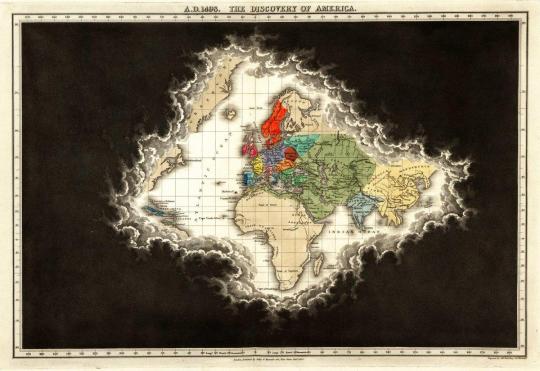
The 19 maps in Edward Quin’s Historical Atlas (1830) show the limits of the “known world” at certain points in history (and from the very specific perspective of the Judeo-Christian West) via swathes of globe glimpsed through a mass of black cloud: https://publicdomainreview.org/collection/edward-quin-historical-atlas
154 notes
·
View notes