
Don't wanna be here? Send us removal request.
Statistics
We looked inside some of the posts by htavakoli-blog and here's what we found interesting.
Average Info
Notes Per Post
0
Likes Per Post
0
Reblog Per Post
0
Reply Per Post
0
Time Between Posts
2 months
Number of Posts By Type
Text
3
Last Seen Tumblr Blogs


Fun Fact
Tumblr posted its first advertisements in May 2012 and subsequently earned $13M in revenue.
Text
Lasso model for physical activity
I examined the associations among the physical activity of the individual in add health database with the educational related variables. The average of following variables are used to calculate new variable named physical activity;
During the past week, how many times did you do exercises, such as jogging, walking, karate, jumping rope, gymnastics or dancing? (H1DA6)
During the past week, how many times did you play an active sport, such as baseball, softball, basketball, soccer, swimming, or football?(H1DA5)
During the past week, how many times did you go roller-blading, roller-skating, skate-boarding, or bicycling?(H1DA4 )
During the past week, how many times did you do work around the house, such as cleaning, cooking, laundry, yard work, or caring for a pet? (H1DA1)
For the exposure variables, I used the variables of Section 10: Feelings Scale and section 5 (Academics and Education). A total of 30 school and educational related variables and gender as the categorical variable included into the model.
I splinted data into training and test data set which contained 70% (n= 4224) and 30%(n= 1809) individuals ,respectively . I used the glmselect procedure for running lasso regression with the least angle regression algorithm on training data set. After validating the model on test data set, I used the TEST ASE for identifying the best set of the variable as the exposures.
Of 30 variables included into model 16 variables are selected to be the best predictors for physical activity score.
Top 5 variables are listed below:
1. You feel like you are part of your school.
2. what was your grade in science?
3. Male gender
4. what was your grade in mathematics?
5. You were happy?
This model can explain 8% of the variability in data.
Figure 1 : 16 selected variables
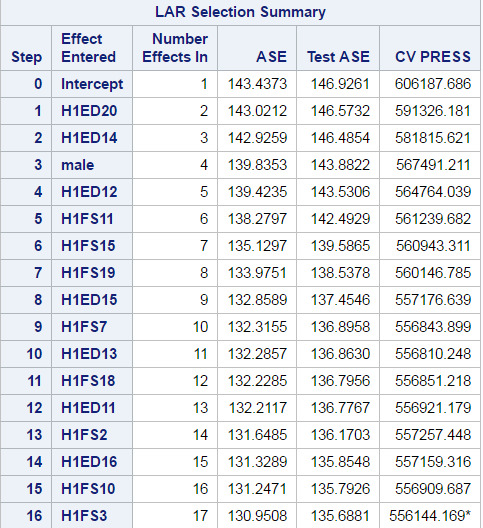
Figure 2 : Coefficient progression for physical activity
�y�vD
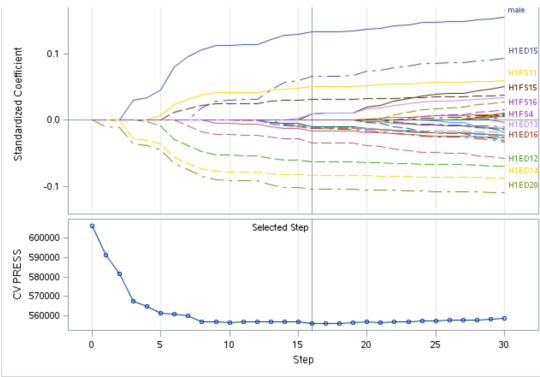
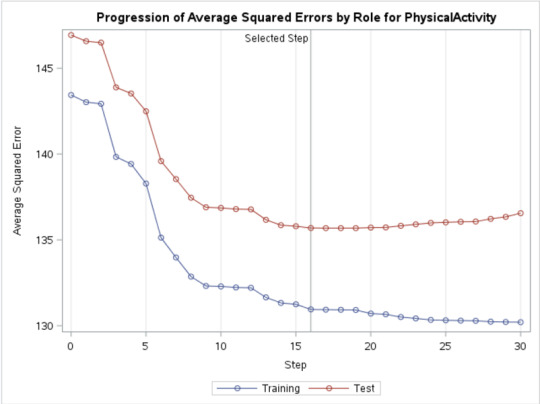
Figure 3 : Progression of average squared errors by role for physical activity
SAS Code:
libname mydata "/courses/d1406ae5ba27fe300" access=readonly;
DATA new;
set mydata.addhealth_pds;
*I used proc contents to extract variales list from the email dataset ;
PROC SORT; BY AID;
proc contents data =new out=contents ;
data contents ;
set contents ;
n=_n_;
run;
proc sql;
select NAME into: KeepVars separated by ' ' from contents
where (substr(name,1,4) in ( "H1DA","H1TS" ,"H1ED" ,"H1FS" ) or 0<n<20) ;
run;
%Put &KeepVars ;
proc sql;
select NAME into: lassovars separated by ' ' from contents
where n>14 and substr(name,1,4) in ( "H1FS" );
run;
%Put &lassovars ;
proc freq data =new;
table H1DA6
H1DA5
H1DA4
H1DA1
H1GH50 ;
run;
*Dropped variables which are all missing;
data Clean (drop= CHINESE AID CORE1 CORE2 CUBAN DISABLE FR_FLAG);
set new ;
if H1DA6 in (6,8) then H1DA6=.;
if H1DA5 in (6,8) then H1DA5=.;
if H1DA4 in (6,8) then H1DA4=.;
if H1DA1 in (6,8) then H1DA1=.;
PhysicalActivity= 100*mean(H1DA6/5 , H1DA5/5 , H1DA4/5, H1DA1/5);
if bio_sex=1 then male=1;
if bio_sex=2 then male=0;
if H1ED20 in(6,7,8) then H1ED20=.;
keep &KeepVars PhysicalActivity male;
if H1ED11 in (96, 98, 97) then H1ED11=.;
if H1ED12 in (96, 98, 97) then H1ED12=.;
if H1ED13 in (96, 98, 97) then H1ED13=.;
if H1ED14 in (96, 98, 97) then H1ED14=.;
if H1ED15 in (96, 98, 97) then H1ED15=.;
if H1ED16 in (6, 7,8) then H1ED16=.;
if H1ED17 in (6, 7,8) then H1ED17=.;
if H1ED18 in (6, 7,8) then H1ED18=.;
if H1ED19 in (6, 7,8) then H1ED19=.;
if H1ED20 in (6, 7,8) then H1ED20=.;
run;
proc sgplot data =clean;
histogram PhysicalActivity;
run;
data Clean2(drop=bio_sex);
set Clean;
if cmiss(of _all_) then delete;
run;
ods graphics on;
* Split data randomly into test and training data;
proc surveyselect data=Clean2 out=traintest seed = 12345
samprate=0.7 method=srs outall;
run;
proc freq data =traintest ;
table selected;
run;
ods graphics on;
* lasso multiple regression with lars algorithm k=10 fold validation;
proc glmselect data=traintest plots=all seed=12345;
partition ROLE=selected(train='1' test='0');
model PhysicalActivity = male &lassovars H1ED11 H1ED12 H1ED13 H1ED14 H1ED15 H1ED16 H1ED17 H1ED18 H1ED19 H1ED20/selection=lar(choose=cv stop=none) cvmethod=random(10);
run;
0 notes
Text
Random forest to predict marijuana users
I used “add health” data set and created a new binary variable for using marijuana. if individual have any experience of marijuana in his or her life I assigned 1 to this person and while have no experience of marijuana I assigned 0.
I removed first 10 variables which address the id and other questionnaire’s date and times.
I created two groups of nominal and interval variables and save them into two string object in SAS and eventually passed these two variables to the SAS input.
Following is my code:
LIBNAME mydata "/courses/d1406ae5ba27fe300 " access=readonly;
*I used email dataset which contains information about spam and non-spam email;
DATA new;
set mydata.addhealth_pds;
*I used proc contents to extract variales list from the email dataset ;
PROC SORT; BY AID;
proc contents data =new out=contents ;
proc sort ;
by varnum ;
run;
proc freq data =new;
table H1TO31;
run;
data new ;
set new;
if 0<H1TO31<=900 then Marij_1=1;
else if H1TO31 =997 then Marij_1=0;
else Marij_1=.;
run;
proc freq data =new;
table Marij_1;
run;
data _null_;
length allvars $1000;
retain allvars ' ';
set contents end=eof;
where type=2 and varnum not in
(1:10);
allvars = trim(left(allvars))||' '||left(name);
if eof then call symput('CatVars', allvars);
run;
%put &CatVars;
data _null_;
length allvars $1000;
retain allvars ' ';
set contents end=eof;
where type=1 and varnum not in
(1:10,2228);
allvars = trim(left(allvars))||' '||left(name);
if eof then call symput('NumVars', allvars);
run;
%put &NumVars;
ods graphics on;
PROC HPFOREST;
target Marij_1/level=nominal;
input &CatVars /level=nominal;
input &NumVars /level=interval;
RUN;
Results
A total of 6283 records out of 6504 are used . Baseline Fit Statistics shows that misclassification rate is 0.251 which means 75% of test dataset have been classified correctly.(table 1)
Table 2 shows the top 2 and last 2 records of fit statistics table which demonstrated the process of growing forest and effect of it on OOB indicator.
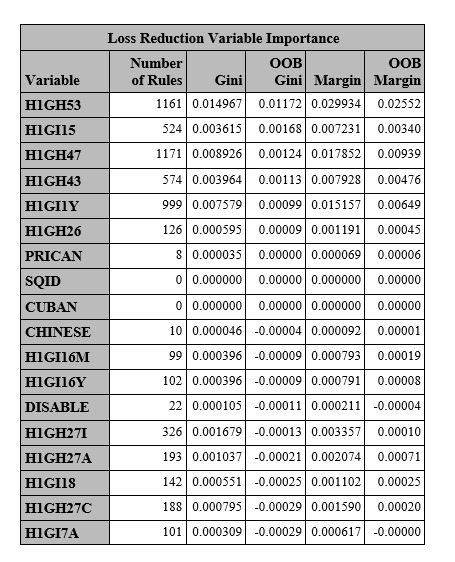
The final results show that a group of the variable can predict the probability of being marijuana user among the individuals of the current study.(table 3)
Interestingly the following variable has the most impact on predicting marijuana utilization
During the past 12 months, have you ever spent the night away from home without permission? (H1GH53)
Have you ever been married? (H1GI15)
How many people do you know who have had another sexually transmitted disease, such as gonorrhea or genital herpes? (H1GH47)
During the past 30 days, how often did you drive a car or other vehicle when you had been drinking alcohol? (H1GH43)
What is your birth date? [month and] year? (H1GI1Y)
Has there been any time over the past year when you thought you should get medical care, but you did not? (H1GH26)
Having Puerto Rican or Cuban background.
Table 1
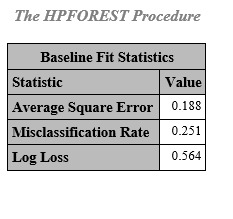
Table 2
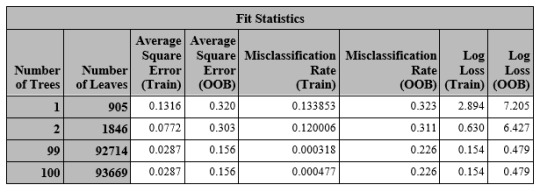
Table 3
0 notes
Text
Machine learning first assignment
List of contents:
1-SAS codes
2- Results
3- Conclusion
1-SAS codes
LIBNAME mydata "/courses/d1406ae5ba27fe300 " access=readonly;
*I used email dataset which contains information about spam and non-spam email;
DATA new; set mydata.email; if spam=0 then spam=2; *I used proc contents to extract variales list from the email dataset ; PROC SORT; BY Var1; proc contents data =new out=contents ; proc sort ; by varnum ; run; *I created two string arrays, 1-CatVars and 2-NumVars; *Following code look at the content dataset which is a meta-data about the email dataset and creates two sets of variable name to use in decision tree procedure;
data _null_; length allvars $1000; retain allvars ' '; set contents end=eof; where type=2 and name not in ("VAR1","spam","sent_email","exclaim_subj","re_subj","urgent_subj","password" ,"exclaim_mess","from"); allvars = trim(left(allvars))||' '||left(name); if eof then call symput('CatVars', allvars); run; %put &CatVars;
data _null_; length allvars $1000; retain allvars ' '; set contents end=eof; where type=1 and name not in ("VAR1","spam","exclaim_subj","re_subj","urgent_subj","password" ,"exclaim_mess","from"); allvars = trim(left(allvars))||' '||left(name); if eof then call symput('NumVars', allvars); run; %put &NumVars; proc freq data =mydata.email; table spam; run;
*Following is the hpsplit procedure in which I used two group of categorical and nmerical variables;
ods graphics on;
proc hpsplit seed=1531 data=new; class spam &CatVars ; model spam=&CatVars &NumVars; grow entropy; prune costcomplexity;
RUN;
2- Results
3- Conclusion
My project was to identify the spam emails from non-spam emails based on the email characteristics. In the email data set two groups of the numeric and categorical variable have been used to explain the probability of an email being a spam one. For this I changed the non-spam emails to 2, to model the probability of being spam vs non-spam.
For categorical variables I took following explanatory variables:
to_multiple ( if it is sent to multiple people), cc ( if it is cc’d to another person) ,image( having image attachment), attach( any attachment), dollar( dollar sign in body of message), winner( having word of winner in email’s body), inherit( having word of winner in email’s body) ,format( if email body is formatted), number( having number in body). For the numerical variables, I used num_char( number of characters) and line_breaks to create DT model.
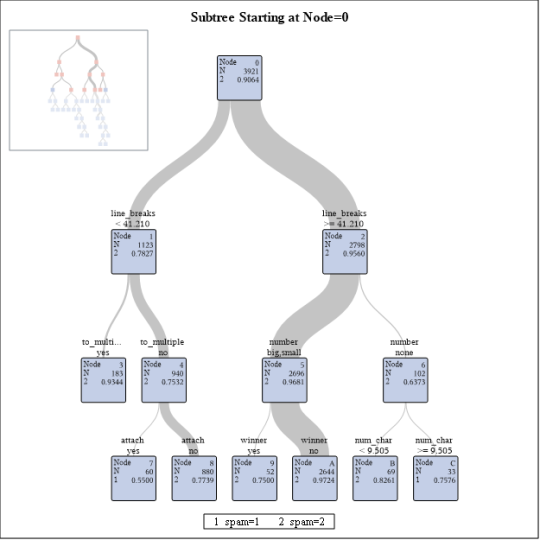
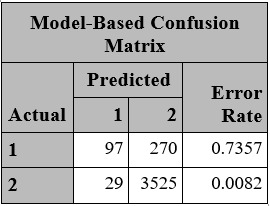
Because of prevalence of non-spam emails in current data set, the model has high specificity (able to identify non-spam email correctly 99% accuracy but low power of sensitivity to recognize spam emails ( 26% accuracy)
According to this model , emails with line break number less than 41.2 has 22% chance of being spam while emails with more than 42.2 line break have almost 5% chance of being spam. Totally , emails with attachments which haven’t been sent to multiple people and contains less than 41.2 line breaks , has 45% chance of being spam.
0 notes