
Last Seen Blogs

s0upyboy
normal guy :3

amashelle
Echoes of Camelot

imsoglitter
Gender? I barely know 'er?

akuras-stash
Akura loves art and memes (sideblog)

Text
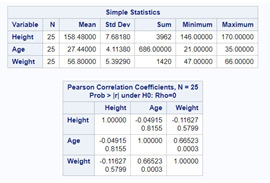
Correlation Coefficients of Age, Height and Weight
The age, height and weight of 25 adults were measured to determine if age can be a factor to height and weight. The explanatory variable is age, and the response variable are weight and height.
For the association between age and height, the correlation coefficient is -0.04915 and also has a p-value of 0.8155 . This tells us that the relationship is statistically not significant, and has a strong negative positive correlation. It means that age has no factor in height increase or decrease. While for the association between the age and weight, the correlation coefficient is 0.66523 and also has a significant p-value of 0.0003. This tells us that the relationship is statistically significant, and has a strong positive correlation. It generally implies that weight increase/decrease can be associated with age in 25 adults.
DATA Weight;
INPUT Height Age Weight;
CARDS;
165 21 48
158 21 51
169 22 50
154 23 53
150 23 57
158 24 59
153 24 47
168 25 49
164 25 54
147 26 50
150 26 60
162 27 54
146 27 62
168 28 58
153 28 59
169 29 63
170 29 64
156 30 66
157 30 57
154 31 58
158 32 61
163 33 60
168 33 58
147 34 64
155 35 58
;
RUN;
PROC CORR; VAR Height Age Weight;
RUN;
PROC CORR DATA=Weight PEARSON SPEARMAN KENDALL FISHER(BIASADJ=NO);
VAR Age;
WITH Weight;
TITLE "CORRELATION COEFFICIENTS";
RUN;
PROC CORR DATA=Weight PEARSON SPEARMAN KENDALL FISHER(BIASADJ=NO);
VAR Age;
WITH Height;
TITLE "CORRELATION COEFFICIENTS";
RUN;
PROC CORR DATA=Weight PEARSON SPEARMAN KENDALL FISHER(BIASADJ=NO);
VAR Weight;
WITH Height;
TITLE "CORRELATION COEFFICIENTS";
RUN;
1 note
·
View note
Photo

There are six (6) core factors that a Dairy Farm should have. These are the 1) Animals, 2) Feed & Nutrition, 3) Housing, 4) Skilled Worker/Labor, 5) Maintenance and 6) Machinery. These aspects are the primary component in the success of a Dairy Farm for optimal production and sustainability.
0 notes
Text
Growth of Microbes in Two Treatment with Storage Condition as the Moderating Variable.
The growth of microbes under two different treatments are highly significant. And under a certain condition (the third variable: such as normal and rapid condition) moderates the association between the growth and the treatment.
DATA Treatment;
INPUT Storage $ Treatment $ Growth;
CARDS;
Normal A 231
Normal A 242
Normal A 231
Normal B 198
Normal �� B 189
Normal B 172
Rapid A 233
Rapid A 249
Rapid A 235
Rapid B 350
Rapid B 360
Rapid B 379
;
RUN;
%* ANOVA using SAS;
PROC SORT; BY Storage;
PROC ANOVA Data=Treatment;
CLASS Growth;
MODEL Treatment=Growth;
MEANS Growth/TUKEY; BY Storage;
RUN;
PROC ANOVA Data=Treatment;
CLASS Treatment;
MODEL Growth =Treatment;
MEANS Treatment/TUKEY; BY Storage;
RUN;
0 notes
Text
Correlation Coefficients
Age and weight were measured in 25 adults.
For the association between age and weight, the correlation coefficient is 0.66 and also has a significant p-value of 0.0003.
Code were:
DATA Weight;
INPUT Subject Age Weight;
CARDS;
01 21 48
02 21 51
03 22 50
04 23 53
05 23 57
06 24 59
07 24 47
08 25 49
09 25 54
10 26 50
11 26 60
12 27 54
13 27 62
14 28 58
15 28 59
16 29 63
17 29 64
18 30 66
19 30 57
20 31 58
21 32 61
22 33 60
23 33 58
24 34 64
25 35 58
;
RUN;
PROC CORR DATA=Weight PEARSON SPEARMAN KENDALL FISHER(BIASADJ=NO);
VAR Age;
WITH Weight;
TITLE "CORRELATION COEEFFICIENTS";
RUN;
PROC CORR; VAR Subject Age Weight;
RUN;
0 notes
Text
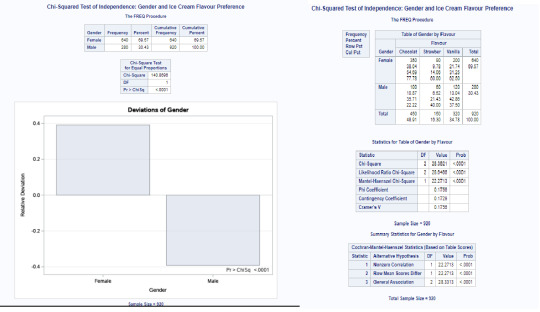
SAS Output: Chi Square
Chi-Squared Test of Independence: Gender and Ice Cream Flavour Preference
There is an association between Gender and Ice Cream Flavour
Data Gender_IceCream;
Input Gender $ Flavour $ Count @@;
Datalines;
Male Chocolate 100
Male Vanilla 120
Male Strawberry 60
Female Chocolate 350
Female Vanilla 200
Female Strawberry 90
;
Run;
PROC FREQ output;
Title 'Chi-Squared Test of Independence: Gender and Ice Cream Flavour Preference';
Run;
PROC FREQ;
TABLES Gender/CHISQ cmh;
Weight Count;
Run;
PROC FREQ;
TABLES Gender*Flavour/CHISQ cmh;
Weight Count;
Run;
0 notes
Text
SAS Output
pH*Time
There is a difference between pH values across time at 5% level of significance.
Data pH;
input time $ pH;
cards;
1 2.7
1 2.2
1 2.2
1 2.4
6 2.4
6 2.7
6 2.8
6 3.0
12 3.3
12 2.9
12 3.0
12 2.7
15 3.4
15 3.5
15 3.7
15 2.9
;
run;
%* ANOVA using SAS;
PROC ANOVA Data=pH;
Class Time;
MODEL pH =Time;
PROC ANOVA;
CLASS Time;
MODEL pH=Time;
MEANS Time/DUNCAN;
PROC ANOVA;
CLASS pH;
MODEL Time=pH;
MEANS pH/DUNCAN;
Run;
0 notes
Text
0 notes


Text
December
it's already 1st of December; and I can feel the cold inside out.
0 notes
Photo

Been sleeping for like 14 hours and out of boredom I sign up for tumblr.
0 notes