
Don't wanna be here? Send us removal request.
Statistics
We looked inside some of the posts by jiteshblog1 and here's what we found interesting.
Average Info
Notes Per Post
0
Likes Per Post
0
Reblog Per Post
0
Reply Per Post
0
Time Between Posts
1 day
Number of Posts By Type
Text
5
Last Seen Tumblr Blogs


Fun Fact
China blocked Tumblr because of pornography and censorship problems in 2013.
Text
Alcohol Consumption and Suicide rate relation
The following python code was written to add the dataset from GAPMINDER codebook to the python and do the data analysis.
Few observations and data analysis before we go to the code. The GAPMINDER code book was selected to analyse the “alcohol consumption per adult (age 15+), litres Recorded and estimated average alcohol consumption adult (15+) percapita consumption in litres pure alcohol for each country” and the “ 2005 Suicide, age adjusted, per 100 000 Mortality due to self-inflicted injury, per 100 000 standard population, age adjusted”
For this the data was imported from the csv in the python code. There were in total 213 countries which were the part of the survey. The variable that was used was “alcconsumption” and “ suicideper100TH “. The data was first sorted by removing the blank columns with nan so that python can differentiate from string and numeric.
First we will discuss the Alcohol Consumption data analysis:
Out of 213 countries only 187 countries had the data for the variable “alcconsumption” .
The value ranged from 0 to 21.03 ( The max value calculated from the max function in python. The data set was split into 4 sections to see answer the question “ How many countries have the consumption
1. above 0 but less than 5,
2 .above 5 and less than 15,
3. above 15 and less than 20
4. Above 20
To solve this a new variable was created and can been seen in the code.
The below is the code was written and we got the below frequency distributions analysis :
Result for Alcohol Consumption Question:
81 Countries which is 43.33% of total countries of which we had the percapita consumption in litres pure alcohol for adult above 15 years between 0 to 5.
95 Countries which is 50.8% of total countries of which we had the percapita consumption in litres pure alcohol for adult above 15 years between 5 to 15.
81 Countries which is 5.3% of total countries of which we had the percapita consumption in litres pure alcohol for adult above 15 years between 15 to 20.
81 Countries which is 0.053% of total countries of which we had the percapita consumption in litres pure alcohol for adult above 15 years above 20.
The above observations with Counts for Alcohol were plotted as well. As they are categorical we have bar graphs.

Now coming to the Suicide data analysis:
The intention was to have the frequency distribution for the data to see “ how many countries have suicide rate above and below the average suicuide rate.”
For this we created a new variable which has the value 0 for the countries having the suicide rate below the average and 1 for the countries above the average.
The code is very simplified and can be understood easily for this distribution.
Result for suicide question mention in above section:
57.06 Countries have suicide rate below average
42.93 have above average.
The above observations with Counts for Alcohol and Suicide patterns were plotted as well. As they are categorical we have bar graphs.
The above observations with Counts for Alcohol were plotted as well. As they are categorical we have bar graphs.
There was another question that we would like to answer was to have a correlation the alcohol Consumption and the Suicide rate per capita. As both are quantitative variables we saw the spread for same. That was caluclated from the describe function in python.
The output is as follows:

It can be seen that the spread is almost of similar nature for both variables. we then plotted the scatter plot using the seaborn package in python.

It can be seen that the countries which have higher suicide rate are somehow linked with the more suicide happening due to more alcohol consumption.
Python Code:
# -*- coding: utf-8 -*- """ Created on Sat May 2 02:17:20 2020
@author: 212415780 """
import pandas as pd import numpy import seaborn import matplotlib.pyplot as plt # any additional libraries would be imported here
# Import the entire data set to memory from the GAPMINDER CodeBook .csv file data = pd.read_csv('gapminder.csv', low_memory=False)
#upper-case all DataFrame column names - place afer code for loading data aboave #data.columns = map(str.upper, data.columns)
# bug fix for display formats to avoid run time errors - put after code for loading data above pd.set_option('display.float_format', lambda x:'%f'%x) print('Total Number of Samples in the Gapminder Codebook data file') print (len(data)) #number of observations (rows) print (len(data.columns)) # number of variables (columns)
#Getting Data from the csv file into Python with using Pandas data1=pd.DataFrame(data,columns=['country','alcconsumption','suicideper100th'])
#pd.to_numeric(s) data1['alcconsumption']=pd.to_numeric(data1['alcconsumption'],errors='coerce') data1['alcconsumption']=data1['alcconsumption'].sort_values(ascending=True) data1['suicideper100th']=pd.to_numeric(data1['suicideper100th'],errors='coerce') data1['suicideper100th']=data1['suicideper100th'].sort_values(ascending=True)
data1.sort_values(["alcconsumption"], axis=0,ascending=True, inplace=True)
#counts and percentages (i.e. frequency distributions) for each variable
print('Printing the Country List') t1=data1['country']
print ('Printing the 2008 alcohol consumption per adult (age 15+), litres Recorded and estimated average alcohol consumption') print('adult (15+) percapita consumption in litres pure alcohol for each country') c1 = data1['alcconsumption'].value_counts(sort=False) #print (c1)
p1 = data1['alcconsumption'].value_counts(sort=True, normalize=True) #print (p1)
#sFinding the countries which have per capita consumption more the 10 lts sub1=data1[(data1['alcconsumption']>=0)] sub2 = sub1.copy()
# frequency distritions on new sub2 data frame #print 'counts for AGE' c5 = sub2['alcconsumption'].value_counts(sort=False) #print(c5)
from numpy import mean #Caluculating the maximum adult (15+) percapita consumption in litres pure alcohol from the data in whole of data set max_alco=max(data1['alcconsumption']) print('Maximum Alcohol Consumption from Data set') print(max_alco)
#Caluculating the maximum adult (15+) percapita consumption in litres pure alcohol from the data in whole of data set min_alco=min(data1['alcconsumption']) print('Minimum Alcohol Consumption from Data set') print(min_alco)
avg_alco=mean(data1['alcconsumption']) print('Average Alcohol Consumption from Data set') print(avg_alco)
#new alcconsumption_split variable, categorical 1 through 6 def alcconsumption_split (row): if row['alcconsumption'] > 0 and row['alcconsumption']<=5: return 1 if row['alcconsumption'] >5 and row['alcconsumption']<=15 : return 2 if row['alcconsumption'] > 15 and row['alcconsumption']<=20: return 3 if row['alcconsumption'] > 20 : return 4
sub1['alcconsumption_split'] = sub1.apply (lambda row: alcconsumption_split (row),axis=1)
#print(a)
print('counts for alcohol comsumption splits ') c10 = sub1['alcconsumption_split'].value_counts(sort=False)
print(c10)
print('percentages for alcohol comsumption splits') p10 = sub1['alcconsumption_split'].value_counts(sort=False, normalize=True) p11=p10*100 print (p11)
print('2005 Suicide, age adjusted, per 100 000 Mortality due to self-inflicted injury, per 100 000 standard population,age adjusted')
sub3=data1[(data1['suicideper100th']>=0)] sub4 = sub3.copy()
max_suc=max(data1['suicideper100th']) print('Maximum number of suicide case per 100000 from Data set') print(max_suc)
#Caluculating the maximum adult (15+) percapita consumption in litres pure alcohol from the data in whole of data set min_suc=min(data1['suicideper100th']) print('Minimum number of suicide case per 100000 from Data set') print(min_suc)
avg_suc=mean(data1['suicideper100th']) print('Average number of suicide case per 100000 from Data set') print(avg_suc)
print(' The Purpose of code is to see the freqeuncy distribution of no of countries which has this rate belor or above average, for this we need to split the data') print('creating new variable')
def suic_split (row): if row['suicideper100th'] < avg_suc : return 0 if row['suicideper100th'] > avg_suc : return 1
sub3['suic_split'] = sub3.apply (lambda row: suic_split (row),axis=1)
#print(a)
print('Freqeuncy distribution for new variable suic_split which counts 0- no of countries with Suicide rate less than the average and 1 as the -no of countries with Suicide rate greater than the average ') c15 = sub3['suic_split'].value_counts(sort=False)
print(c15)
print('Perecnetage for new variable suic_split which counts 0- no of countries with Suicide rate less than the average and 1 as the -no of countries with Suicide rate greater than the average ') p15 = sub3['suic_split'].value_counts(sort=False, normalize=True) p16=p15*100 print (p16)
fig1 = plt.figure(1) sub1["alcconsumption_split"] = sub1["alcconsumption_split"].astype('category') t=seaborn.countplot(x="alcconsumption_split", data=sub1) plt.xlabel('1- Counteies with Alcohol Consumption more then 0 less than 5, 2- Counteies with Alcohol Consumption more then 5 less than 15,3- Counteies with Alcohol Consumption more then 15 less than 20,4- Counteies with Alcohol Consumption more then 20') plt.title('Alcohol Consumption Bar Graph') fig1.savefig('Plot1.png')
fig2 = plt.figure(2) sub3["suic_split"] = sub3["suic_split"].astype('category') y=seaborn.countplot(x="suic_split", data=sub3) plt.xlabel('Freqeuncy distribution Plot for new variable suic_split which counts 0- no of countries with Suicide rate less than the average and 1 as the -no of countries with Suicide rate greater than the average ') plt.title('Suicide Rate Bar Graph') fig2.savefig('PLot 2.png')
plt.show()
# standard deviation and other descriptive statistics for quantitative variables print ('describe number alcconsumption per capita ') desc1 = data1['alcconsumption'].describe() print(desc1)
print ('describe number Sucide per capita ') desc2 = data1['suicideper100th'].describe() print(desc2)
#basic scatterplot: Q->Q scat1 = seaborn.regplot(x="suicideper100th", y="alcconsumption", fit_reg=False, data=data) plt.xlabel('Suicide Rate') plt.ylabel('Alcohol Consumption') plt.title('Scatterplot for the Association Between Alcohol and Suicide vaiables ')
0 notes
Text
The following python code was written to add the dataset from GAPMINDER codebook to the python and do the data analysis.
Few observations and data analysis before we go to the code. The GAPMINDER code book was selected to analyse the “alcohol consumption per adult (age 15+), litres Recorded and estimated average alcohol consumption adult (15+) percapita consumption in litres pure alcohol for each country” and the “ 2005 Suicide, age adjusted, per 100 000 Mortality due to self-inflicted injury, per 100 000 standard population, age adjusted”
For this the data was imported from the csv in the python code. There were in total 213 countries which were the part of the survey. The variable that was used was “alcconsumption” and “ suicideper100TH “. The data was first sorted by removing the blank columns with nan so that python can differentiate from string and numeric.
First we will discuss the Alcohol Consumption data analysis:
Out of 213 countries only 187 countries had the data for the variable “alcconsumption” .
The value ranged from 0 to 21.03 ( The max value calculated from the max function in python. The data set was split into 4 sections to see answer the question “ How many countries have the consumption
1. above 0 but less than 5,
2 .above 5 and less than 15,
3. above 15 and less than 20
4. Above 20
To solve this a new variable was created and can been seen in the code.
The below is the code was written and we got the below frequency distributions analysis :
Result for Alcohol Consumption Question:
81 Countries which is 43.33% of total countries of which we had the percapita consumption in litres pure alcohol for adult above 15 years between 0 to 5.
95 Countries which is 50.8% of total countries of which we had the percapita consumption in litres pure alcohol for adult above 15 years between 5 to 15.
81 Countries which is 5.3% of total countries of which we had the percapita consumption in litres pure alcohol for adult above 15 years between 15 to 20.
81 Countries which is 0.053% of total countries of which we had the percapita consumption in litres pure alcohol for adult above 15 years above 20.
Now coming to the Suicide data analysis:
The intention was to have the frequency distribution for the data to see “ how many countries have suicide rate above and below the average suicuide rate.”
For this we created a new variable which has the value 0 for the countries having the suicide rate below the average and 1 for the countries above the average.
The code is very simplified and can be understood easily for this distribution.
Result for suicide question mention in above section:
57.06 Countries have suicide rate below average
42.93 have above average.
The snapshot of the data table and result is shown below:

Code:
# -*- coding: utf-8 -*- """ Created on Sat May 2 02:17:20 2020
@author: 212415780 """
import pandas as pd import numpy # any additional libraries would be imported here
# Import the entire data set to memory from the GAPMINDER CodeBook .csv file data = pd.read_csv('gapminder.csv', low_memory=False)
#upper-case all DataFrame column names - place afer code for loading data aboave #data.columns = map(str.upper, data.columns)
# bug fix for display formats to avoid run time errors - put after code for loading data above pd.set_option('display.float_format', lambda x:'%f'%x) print('Total Number of Samples in the Gapminder Codebook data file') print (len(data)) #number of observations (rows) print (len(data.columns)) # number of variables (columns)
#Getting Data from the csv file into Python with using Pandas data1=pd.DataFrame(data,columns=['country','alcconsumption','suicideper100th'])
#pd.to_numeric(s) data1['alcconsumption']=pd.to_numeric(data1['alcconsumption'],errors='coerce') data1['alcconsumption']=data1['alcconsumption'].sort_values(ascending=True) data1['suicideper100th']=pd.to_numeric(data1['suicideper100th'],errors='coerce') data1['suicideper100th']=data1['suicideper100th'].sort_values(ascending=True)
data1.sort_values(["alcconsumption"], axis=0,ascending=True, inplace=True)
#counts and percentages (i.e. frequency distributions) for each variable
print('Printing the Country List') t1=data1['country']
print ('Printing the 2008 alcohol consumption per adult (age 15+), litres Recorded and estimated average alcohol consumption') print('adult (15+) percapita consumption in litres pure alcohol for each country') c1 = data1['alcconsumption'].value_counts(sort=False) #print (c1)
p1 = data1['alcconsumption'].value_counts(sort=True, normalize=True) #print (p1)
#sFinding the countries which have per capita consumption more the 10 lts sub1=data1[(data1['alcconsumption']>=0)] sub2 = sub1.copy()
# frequency distritions on new sub2 data frame #print 'counts for AGE' c5 = sub2['alcconsumption'].value_counts(sort=False) #print(c5)
from numpy import mean #Caluculating the maximum adult (15+) percapita consumption in litres pure alcohol from the data in whole of data set max_alco=max(data1['alcconsumption']) print('Maximum Alcohol Consumption from Data set') print(max_alco)
#Caluculating the maximum adult (15+) percapita consumption in litres pure alcohol from the data in whole of data set min_alco=min(data1['alcconsumption']) print('Minimum Alcohol Consumption from Data set') print(min_alco)
avg_alco=mean(data1['alcconsumption']) print('Average Alcohol Consumption from Data set') print(avg_alco)
#new alcconsumption_split variable, categorical 1 through 6 def alcconsumption_split (row): if row['alcconsumption'] > 0 and row['alcconsumption']<=5: return 1 if row['alcconsumption'] >5 and row['alcconsumption']<=15 : return 2 if row['alcconsumption'] > 15 and row['alcconsumption']<=20: return 3 if row['alcconsumption'] > 20 : return 4
sub1['alcconsumption_split'] = sub1.apply (lambda row: alcconsumption_split (row),axis=1)
#print(a)
print('counts for alcohol comsumption splits ')http://www.mpc.berkeley.edu/mpc-course-material c10 = sub1['alcconsumption_split'].value_counts(sort=False)
print(c10)
print('percentages for alcohol comsumption splits') p10 = sub1['alcconsumption_split'].value_counts(sort=False, normalize=True) p11=p10*100 print (p11)
print('2005 Suicide, age adjusted, per 100 000 Mortality due to self-inflicted injury, per 100 000 standard population,age adjusted')
sub3=data1[(data1['suicideper100th']>=0)] sub4 = sub3.copy()
max_suc=max(data1['suicideper100th']) print('Maximum number of suicide case per 100000 from Data set') print(max_suc)
#Caluculating the maximum adult (15+) percapita consumption in litres pure alcohol from the data in whole of data set min_suc=min(data1['suicideper100th']) print('Minimum number of suicide case per 100000 from Data set') print(min_suc)
avg_suc=mean(data1['suicideper100th']) print('Average number of suicide case per 100000 from Data set') print(avg_suc)
print(' The Purpose of code is to see the freqeuncy distribution of no of countries which has this rate belor or above average, for this we need to split the data') print('creating new variable')
def suic_split (row): if row['suicideper100th'] < avg_suc : return 0 if row['suicideper100th'] > avg_suc : return 1
sub3['suic_split'] = sub3.apply (lambda row: suic_split (row),axis=1)
#print(a)
print('Freqeuncy distribution for new variable suic_split which counts 0- no of countries with Suicide rate less than the average and 1 as the -no of countries with Suicide rate greater than the average ') c15 = sub3['suic_split'].value_counts(sort=False)
print(c15)
print('Perecnetage for new variable suic_split which counts 0- no of countries with Suicide rate less than the average and 1 as the -no of countries with Suicide rate greater than the average ') p15 = sub3['suic_split'].value_counts(sort=False, normalize=True) p16=p15*100 print (p16)
0 notes
Text
Alcohol Consumption
The following python code was written to add the dataset from GAPMINDER codebook to the python and do the data analysis.
Few observations and data analysis before we go to the code. The GAPMINDER code book was selected to analyse the “alcohol consumption per adult (age 15+), litres Recorded and estimated average alcohol consumption adult (15+) percapita consumption in litres pure alcohol for each country”
For this the data was imported from the csv in the python code. There were in total 213 countries which were the part of the survey. The variable that was used was “alcconsumption” . Out of 213 only 187 countries had the data for the variable “alcconsumption” .The value ranged from 0 to 21.03 ( The max value calculated from the max function in python. The data set was split into 4 sections to see answer the question “ How many countries have the consumption
1. above 0 but less than 5,
2 .above 5 and less than 15,
3. above 15 and less than 20
4. Above 20
The below is the code was written and we got the below frequency distributions analysis :
81 Countries which is 43.33% of total countries of which we had the percapita consumption in litres pure alcohol for adult above 15 years between 0 to 5.
95 Countries which is 50.8% of total countries of which we had the percapita consumption in litres pure alcohol for adult above 15 years between 5 to 15.
81 Countries which is 5.3% of total countries of which we had the percapita consumption in litres pure alcohol for adult above 15 years between 15 to 20.
81 Countries which is 0.053% of total countries of which we had the percapita consumption in litres pure alcohol for adult above 15 yearsabove 20.
The
The snapshot of the data table and result is shown below:
Code:
#pd.to_numeric(s) data1['alcconsumption']=pd.to_numeric(data1['alcconsumption'],errors='coerce') data1['alcconsumption']=data1['alcconsumption'].sort_values(ascending=True) data1['suicideper100th']=pd.to_numeric(data1['suicideper100th'],errors='coerce') data1['suicideper100th']=data1['suicideper100th'].sort_values(ascending=True)
data1.sort_values(["alcconsumption"], axis=0,ascending=True, inplace=True)
#counts and percentages (i.e. frequency distributions) for each variable
print('Printing the Country List') t1=data1['country']
print ('Printing the 2008 alcohol consumption per adult (age 15+), litres Recorded and estimated average alcohol consumption') print('adult (15+) percapita consumption in litres pure alcohol for each country') c1 = data1['alcconsumption'].value_counts(sort=False) #print (c1)
p1 = data1['alcconsumption'].value_counts(sort=True, normalize=True) #print (p1)
#sFinding the countries which have per capita consumption more the 10 lts sub1=data1[(data1['alcconsumption']>=0)] sub2 = sub1.copy()
# frequency distritions on new sub2 data frame #print 'counts for AGE' c5 = sub2['alcconsumption'].value_counts(sort=False) #print(c5)
from numpy import mean #Caluculating the maximum adult (15+) percapita consumption in litres pure alcohol from the data in whole of data set max_alco=max(data1['alcconsumption']) print('Maximum Alcohol Consumption from Data set') print(max_alco)
#Caluculating the maximum adult (15+) percapita consumption in litres pure alcohol from the data in whole of data set min_alco=min(data1['alcconsumption']) print('Minimum Alcohol Consumption from Data set') print(min_alco)
avg_alco=mean(data1['alcconsumption']) print('Average Alcohol Consumption from Data set') print(avg_alco)
#new alcconsumption_split variable, categorical 1 through 6 def alcconsumption_split (row): if row['alcconsumption'] > 0 and row['alcconsumption']<=5: return 1 if row['alcconsumption'] >5 and row['alcconsumption']<=15 : return 2 if row['alcconsumption'] > 15 and row['alcconsumption']<=20: return 3 if row['alcconsumption'] > 20 : return 4
sub1['alcconsumption_split'] = sub1.apply (lambda row: alcconsumption_split (row),axis=1)
#print(a)
print('counts for alcohol comsumption splits ') c10 = sub1['alcconsumption_split'].value_counts(sort=False)
print(c10)
print('percentages for alcohol comsumption splits') p10 = sub1['alcconsumption_split'].value_counts(sort=False, normalize=True) p11=p10*100 print (p11)
0 notes
Text
My Blog 2
The following python code was written to add the dataset from GAPMINDER codebook to the python and do the data analysis.
import pandas as pd
import numpy # any additional libraries would be imported here
# Import the entire data set to memory from the GAPMINDER CodeBook .csv file data = pd.read_csv('gapminder.csv', low_memory=False)
#upper-case all DataFrame column names - place afer code for loading data aboave #data.columns = map(str.upper, data.columns)
# bug fix for display formats to avoid run time errors - put after code for loading data above pd.set_option('display.float_format', lambda x:'%f'%x) print('Total Number of Samples in the Gapminder Codebook data file') print (len(data)) #number of observations (rows) print (len(data.columns)) # number of variables (columns)
#setting variables you will be working with to numeric data1=pd.DataFrame(data,columns=['country','alcconsumption','suicideper100th'])
#pd.to_numeric(s) data1['alcconsumption']=pd.to_numeric(data1['alcconsumption'],errors='coerce') data1['alcconsumption']=data1['alcconsumption'].sort_values(ascending=True) data1['suicideper100th']=pd.to_numeric(data1['suicideper100th'],errors='coerce') data1['suicideper100th']=data1['suicideper100th'].sort_values(ascending=True)
data1.sort_values(["alcconsumption"], axis=0,ascending=True, inplace=True)
#counts and percentages (i.e. frequency distributions) for each variable
print('Printing the Country List') t1=data1['country']
print ('Printing the 2008 alcohol consumption per adult (age 15+), litres Recorded and estimated average alcohol consumption') print('adult (15+) percapita consumption in litres pure alcohol for each country') c1 = data1['alcconsumption'].value_counts(sort=False) print (c1)
p1 = data1['alcconsumption'].value_counts(sort=True, normalize=True) print (p1)
#sFinding the countries which have per capita consumption more the 10 lts sub1=data1[(data1['alcconsumption']>=10)] sub2 = sub1.copy()
# frequency distritions on new sub2 data frame #print 'counts for AGE' c5 = sub2['alcconsumption'].value_counts(sort=False) print(c5)
from numpy import mean #Caluculating the maximum adult (15+) percapita consumption in litres pure alcohol from the data in whole of data set max_alco=max(data1['alcconsumption']) print('Maximum Alcohol Consumption from Data set') print(max_alco)
avg_alco=mean(data1['alcconsumption']) print('Average Alcohol Consumption from Data set') print(avg_alco)
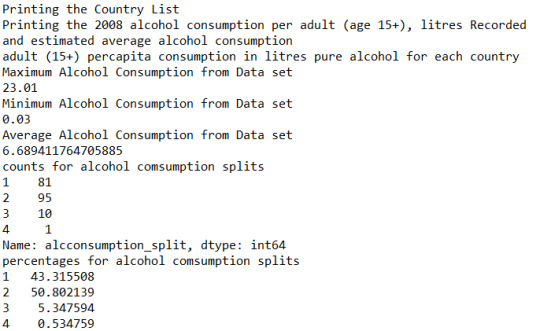
The fooling questions were part of the research:
1/ to find the maximum per capita alcohol consumption in the data set it was found to be 23..01.
2/ Average alcohol consumption from the data set.
I was calculated as 6.689411

0 notes
Text
My Blog 1
After going through the codebook for the GAPMINDER , I have decided that I am interested in the adults above 15 + on their per capita Alcohol Consumption in different countries. I am not sure for all the variables that I need to consider. For now I have considered “alcconsumption” variable from the codebook as the starting point.
While the data provided , it intrigued me about the linkage between the no of sucides that happen in a country, Are they show how linked to the alcohol consumption habits of the country. For this I have decided , exploring the association between two topics. I have added the “alcconsumption” and “suicideper100TH” variables from the code book for further study.
More literature review was done from below link: https://onlinelibrary.wiley.com/doi/full/10.1111/j.1530-0277.2006.00274.x
This study tells how alcohol addition lead to the Depression and as depression is directly linked to suicide rate , the correlation can be established.
0 notes