
This is a blog to share my work, insight, and progress as I go through Data Analysis and Interpretation Specialization provided by Wesleyan University on Coursera.
Don't wanna be here? Send us removal request.
Statistics
We looked inside some of the posts by kit-teee and here's what we found interesting.
Average Info
Notes Per Post
2
Likes Per Post
2
Reblog Per Post
0
Reply Per Post
0
Time Between Posts
1 day
Number of Posts By Type
Text
16
Last Seen Tumblr Blogs


Fun Fact
25% of US internet users with an annual income of $80-100K use Tumblr.
Text
k-Means Cluster Analysis
A k-means cluster analysis was conducted to identify underlying subgroups of adults who had cannabis disorder (either abuse, dependence or both) based on their similarity of responses on 6 variables that represent characteristic that could have an impact on duration of cannabis disorder episode. Clustering variables included binary categorical variable such as lifetime major depression (MAJORDEPLIFE), gender (MALE) and lifetime nicotine dependence (TABLIFEDX), as well as quantitative variables, e.g. age (AGE), frequency of cannabis use (converted to standard unit of number of days per month, FREQ), quantity of marijuana joints usually smoked per day (QUANTITY). All clustering variables were standardized to have a mean of 0 and a standard deviation of 1.
Data were randomly split into a training set that included 70% of the observations (N=2098) and a test set that included the remaining 30% of the observations (N=900). A series of k-means cluster analyses were conducted on the training data specifying k=1-9 clusters, using Euclidean distance. The average distance was plotted for each of the nine cluster solutions in an elbow curve to provide guidance for choosing the number of clusters to interpret.
Elbow curve of average distance for 1 - 9 cluster solutions:
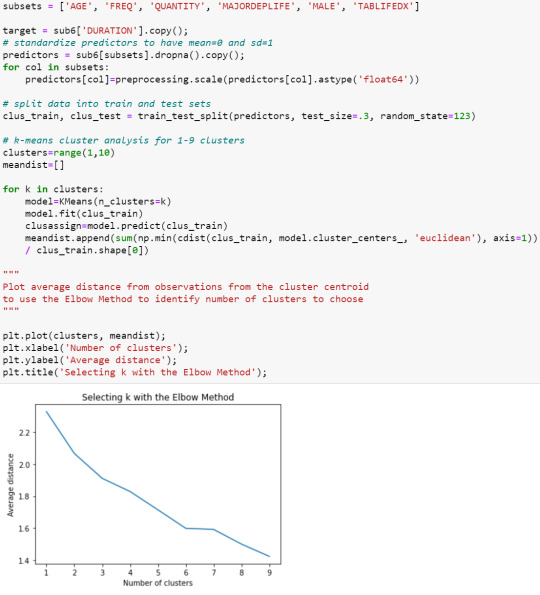
The elbow curve was inconclusive. The results below are for an interpretation of the
4-cluster
solution.
Plot of first 2 canonical variables for the clustering variables by cluster:

Canonical discriminant analyses was used to reduce the 6 clustering variable down a few variables that accounted for the most of the variance in the clustering variables. A scatterplot of the first 2 canonical variables by cluster indicated that observations in the 4 clusters are not very distinct and there are overlapping between clusters.
Cluster frequencies and means of the clustering variables:

The means on the clustering variables showed that cluster 0 has highest level of depression and high level of lifetime nicotine dependence, cluster 1 has lowest level of cannabis use (in terms of both frequency and quantity) and lowest proportion of male, cluster 2 has highest level of cannabis use (in terms of both frequency and quantity) and highest level of lifetime nicotine dependence, and cluster 3 has lowest level of lifetime major depression and highest proportion of male.
Analysis of variance and post hoc analysis:

In order to externally validate the clusters, an ANOVA was conducted to test for significant differences between the clusters on duration of cannabis disorder episode (DURATION). A tukey test was used for post hoc comparisons between the clusters. Results indicated significant differences between clusters on duration of cannabis disorder episode, with the exception that clusters 0 and 3 were not significantly different from each other. Participants in cluster 2 had the highest mean duration of cannabis disorder episode (mean=72.20) and cluster 1 had the lowest duration of cannabis disorder episode (mean=38.85).
0 notes
Text
Lasso Regression
A lasso regression analysis was conducted to identify a subset of variables from a pool of 15 categorical and quantitative predictor variables that best predicted a quantitative response variable measuring duration (months) of cannabis disorder (abuse/dependence) episodes. Categorical predictors included gender (MALE), and a series of 5 binary categorical variables for race and ethnicity (WHITE, BLACK, NAMERICAN, ASIANPAC, HISPANIC). Other binary categorical variables such as lifetime major depression (MAJORDEPLIFE), lifetime manic disorder (NMANDXLIFE), lifetime social phobia (SOCPDLIFE), lifetime generalized anxiety disorder (GENAXLIFE) and lifetime nicotine dependence(TABLIFEDX) were also included. Quantitative predictor variables include age (AGE), quantity of marijuana smoked per day (QUANTITY) and frequency of cannabis use (standardized to number of days/month, FREQ). All predictor variables were standardized to have a mean of zero and a standard deviation of one.
Data were randomly split into a training set that included 70% of the observations (N=2098) and a test set that included 30% of the observations (N=900). The least angle regression algorithm with k=10 fold cross validation was used to estimate the lasso regression model in the training set, and the model was validated using the test set. The change in the cross validation average (mean) squared error at each step was used to identify the best subset of predictor variables.


Change in the validation mean square error at each step:


Of the 15 predictor variables, 9 were retained in the selected model. During the estimation process, age and frequency were most strongly associated with the response variable, then followed by quantity of marijuana joints usually smoked per day. Other predictors associated with the duration of cannabis disorder episode included gender, black, native American, Asian ethnicities, lifetime major depression and lifetime nicotine dependence. These variables accounted for only 12.2% of the variance in the duration of cannabis disorder episode.
0 notes
Text
Random Forest
Random forest analysis was performed to evaluate the importance of a series of explanatory variables in predicting the diagnosis of cannabis disorders, either cannabis abuse, dependence or both (DIAGNOSIS). The following explanatory variables were included: gender (SEX), level of cannabis use (USELEVEL - estimated quantity of marijuana joints smoked per month collapsed into 4 categories - [0] smoked on average less than 1 marijuana joint/month, [1] smoked between 1 to 4 joints/month, [2] smoked between 4 to 30 joints/month, [3] smoked more than 30 joints/month), lifetime major depression (MAJORDEPLIFE) and whether blood/natural mother have drug problems (MOMDRUG).
Random forest (n_estimators=25) codes and outputs:

Feature importance:

Plot of model accuracy vs n_estimators:
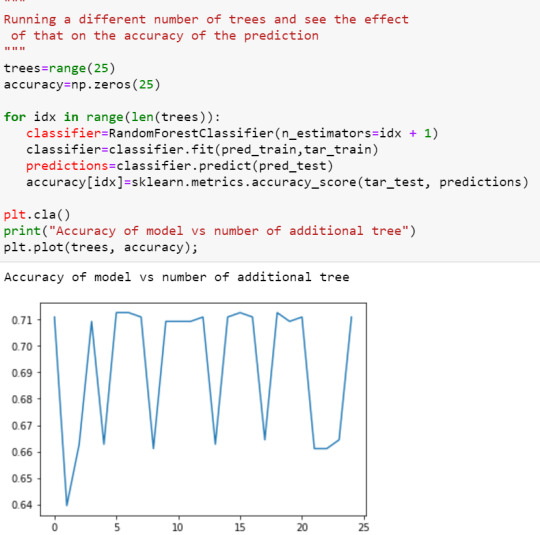
The explanatory variables with the highest relative importance scores were level of cannabis use. The accuracy of the random forest was 71%, with the subsequent growing of multiple trees rather than a single tree, adding no improvement to the overall accuracy of the model, and suggesting that interpretation of a single decision tree may be appropriate.
0 notes
Text
Decision Tree
Decision tree analysis was performed to test nonlinear relationships among a series of explanatory variables and a binary, categorical response variable, i.e. diagnosis of cannabis disorders (abuse, dependence or both).
The following explanatory variables were included as possible contributors to a classification tree model evaluating diagnosis of cannabis disorders (DIAGNOSIS): gender (SEX), lifetime major depression (MAJORDEPLIFE), quantity of marijuana joints smoked per month (collapsed into 4 categories, USELEVEL) and whether blood/natural mother ever had problems with drug (MOMDRUG).
Codes:

Final tree:

Level of cannabis use (USELEVEL, categorical variable: [0] smoked on average less than 1 marijuana joint/month, [1] smoked between 1 to 4 joints/month, [2] smoked between 4 to 30 joints/month, [3] smoked more than 30 joints/month) was the first variable to separate the sample into two subgroups. Respondents who smoked on average less than 4 joints per month were less likely to have cannabis disorders.
Overall, the total model classified 70.6% of the sample correctly, 61.3% of the participants who had cannabis disorders (sensitivity) and 76.4% of the participants without cannabis disorders (specificity).
0 notes
Text
Logistic Regression Model
One of my research questions was whether there is an association between level of cannabis use (USELEVEL - estimated quantity of marijuana smoked per month, collapsed into 2 categories: 0 - smoked less than 4 joints/month, 1 - smoked 4 or more joints/month) and diagnosis of cannabis disorders, either abuse, dependence or both (DIAGNOSIS: 0 - without cannabis disorders, 1 - with cannabis disorders). I hypothesized that higher level of cannabis use increases the risk of experiencing cannabis disorders.
The logistic regression results for my primary variables are as shown below:


Other explanatory variables such as sex (SEX_C: 0 - female, 1 - male) and lifetime major depression (MAJORDEPLIFE: 0 - without major depression, 1 - with major depression) were also included in my logistic regression analysis.
The logistic regression results for all explanatory variables combined are as follows:

After adjusting for potential confounding factors, the odds of having cannabis disorders were more than five times higher for respondents who smoked on average 4 cannabis joints or more per month than for those who smoked fewer (OR=5.0796, 95% CI=4.0398-6.3871, p<0.001). Marijuana user with major depression are 1.5 times more likely to experience cannabis disorders than for those without major depression (OR=1.5098, 95% CI=1.1877-1.9193, p=.0001). Sex was also significantly associated with diagnosis of cannabis disorders, such that male participants were significantly more likely to have experience cannabis disorders than female participants (OR= 1.5590, 95% CI=1.2241-1.9855, p<.001).
Since adding other explanatory variables did not changes the add ratio for level of cannabis use, there was no evidence of confounding for the association between my primary explanatory and response variables.
In conclusion, results from the analysis supported my hypothesis that higher level of cannabis use is associated with higher probability of having cannabis disorders.
1 note
·
View note
Text
Multiple Regression Model
One of my research questions was whether there is an association between quantity of marijuana smoked (FREQMON_C) and duration of cannabis disorder (abuse/dependence) episode (DURATION). I hypothesized that higher level of cannabis use increases the duration of cannabis disorders.
Apart from my primary explanatory variable, other explanatory variables, such as age (AGE_C), sex (SEX), lifetime major depression (MAJORDEPLIFE) and lifetime dysthymia (DYSLIFE), were included in my multiple regression analysis.
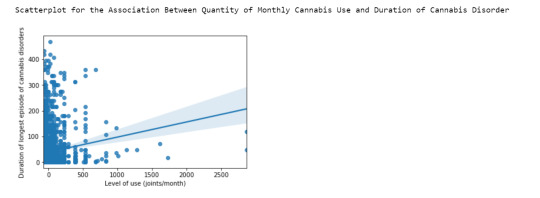
Scatterplot and ordinary least squares (OLS) regression of primary explanatory variable and response variable:

The multiple regression outputs are as shown below:

The results show that after adjusting for potential confounding factors, the primary explanatory (mean-centered quantity of marijuana joints smoked per month) was significantly and positively associated with the response variable (duration of cannabis disorders episode), Beta=0.0643, p<0.001, thus supporting my hypothesis. However, r-squared value shows that only 1.9% of the variability observed in the duration of cannabis disorder episode can be explained by the quantity of cannabis used. All other explanatory variables included were also significantly associated with the response variable, except for lifetime dysthymia, which has p=0.063. Together, all the explanatory variables account for 9% of variability in response variable.
The results also show that there was no evidence of confounding for the association between my primary explanatory and response variable by other explanatory variables investigated, since the beta coefficients were similar in linear regression and multiple regression models.
Regression diagnostic plots
Quantile-quantile (qq) plot:

The qq plot above indicates that our residuals did not follow normal distribution. This is expected as the scatter plot did not show strong linear association between the primary explanatory and response variable.
Simple residual plot:
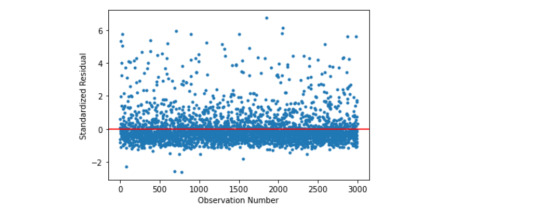
When we plot the standardized residuals from the model, we can see they majority of them are within 2 standard deviations from the mean, with quite a few samples having more than 3 standard deviations above the mean of 0. Thus, there appeared to be extreme outliers in the sample. In terms of evaluating the overall fit of the mode based on the distribution of the residuals, the model is a fairly poor fit to the observed data, more explanatory variables should be included to better explain the variability in the duration of cannabis disorder episode.
Other diagnostic plots generated using stats model library:
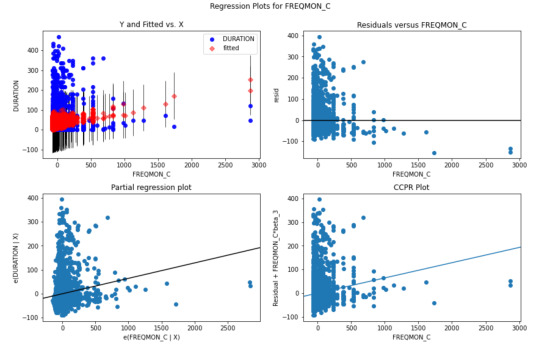
The plot in the upper right hand corner shows the residuals for each observation at different numbers of marijuana joints smoked. It shows that the absolute values of the residuals are significantly larger at lower numbers of marijuana joints smoked. This indicates that the model does not predict duration of cannabis disorder episode well for individuals that smoke lower quantity of marijuana joints.
Influence plot

The influence/leverage plot above shows that most outliers have low leverage except a few outliers that also have high influence on the estimation of the predicted value of response variable.
In conclusion, although there seem to be significant association between quantity of marijuana smoked and duration of cannabis disorder episode, the association is weak.
0 notes
Text
Basic Linear Regression Model
The association between quantity of cannabis joints smoked and duration of cannabis disorders was examined in this analysis.
The python program is as shown below:

Data was preprocessed by centering the quantitative explanatory variable, i.e. estimated number of marijuana joints smoked per month, to be 0, by subtracting its mean.
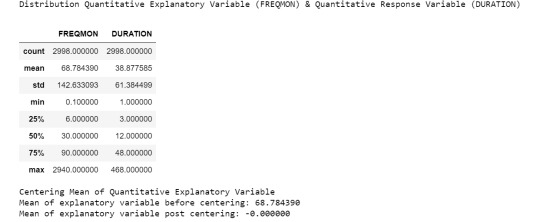
A scatter plot shows that the two variables are positively associated.
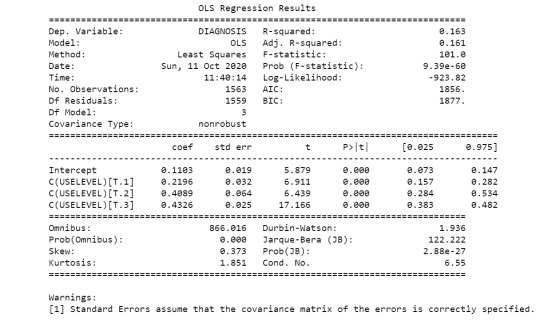
Ordinary Least Square (OLS) regression results are as follows:

The results of the linear regression model indicated that the quantity of marijuana joints smoked (Beta=0.0587, p<0.001) was significantly and positively associated with the duration of cannabis disorders episode.
0 notes
Text
About the data
Sample
The sample is from the first wave of the National Epidemiologic Survey on Alcohol and Related Conditions (NESARC), the largest nationwide longitudinal survey of alcohol and drug use and associated psychiatric and medical comorbidities in the United States conducted by the National Institute on Alcohol Abuse and Alcoholism (NIAAA). The analysis was reported individual level, participants (N=43,093) were civilian, non-institutionalized adult population of the United States, and included persons living in households, military personnel living off base, and persons residing in the following group quarters: boarding or rooming houses, non-transient hotels and motels, shelters, facilities for housing workers, college quarters and group homes. The NESARC included over sampling of Blacks, Hispanics and young adults aged 18 to 24 years. The data analytic sample for this study included adult participants who reported taken cannabis in the past 12 months (N=1563).
Procedure
Data were collected face-to-face, by trained U.S. Census Bureau Field Representatives during 2001-2002 through computer-assisted personal interviews (CAPI). One adult was selected for interview in each household, and interviews were conducted in respondent’s homes following informed consent procedures. The original purposes of the data collection were to determine the prevalence, incidence, stability and recurrence of alcohol use disorders (AUDs) and their associated disabilities in the general U.S. population, as well as to determine the associations between AUDs and their major physical and mental disabilities, differentiating drug-induced disorders from those reflecting true, independent mental conditions.
Measures
The association between level of cannabis use (categorical explanatory) and the diagnosis of cannabis disorders (categorical response) was being examined in current analysis.
The frequency of cannabis use [’S3BD5Q2C’] was converted into approximate number of days per month, then multiplied with the number marijuana joints usually smoked per day [’S3BQ3’], to estimate the number of cannabis joints smoked per month, which range from less than 1 to 1920 marijuana joints per month. The data were binned into four levels of cannabis use as categorical explanatory variable: level one - less than 1 joint per month, level two - 1 joint or more per month, but less than 4 per month, level three - 4 joints or more per month, but less than 30 per month, level four - 30 joints or more per month.
On the other hand, variable MAR12ABDEP which categorized respondents into four groups: 1. no cannabis diagnosis, 2. cannabis abuse only, 3. cannabis dependence only, 4. cannabis abuse and dependence, were collapsed into 2 categories, i.e. with and without cannabis disorders diagnosis, as the categorical response variable.
0 notes
Text
Testing a Potential Moderator
I divided my sample population, i.e. adults who had taken cannabis in the past 12 months in the NESARC study, into 2 subgroups: with and without lifetime major depression diagnosis, in order to test whether major depression moderate the association between level of cannabis use (estimated number of marijuana joints smoked per month, collapsed into 4 categories, as categorical explanatory variable) and diagnosis of cannabis disorders (either cannabis abuse, dependence or both, as categorical response variable).
Categories of explanatory and response variables are as shown below:

Chi square test of independence and post-hoc comparisons for subgroup WITHOUT depression:

Chi square test of independence and post-hoc comparisons for subgroup WITH depression:
It was found that there is association between level of cannabis use and proportion of cannabis disorders diagnosis for both subgroups. In both subgroups, smoking on average less than 1 joint per month reported lower rate of cannabis disorders compared to groups taking more. Also, lower rate of cannabis disorders was seen in those smoking on average 1 joint or more but less than 4 joints per month, compared to those taking at least 30 joints per month. Comparisons between other pairs were not statistically different.
0 notes
Text
Correlation Coefficient
The scatterplot below shows the association between level of peak cannabis use and duration of longest episode of cannabis disorder:

The calculated correlation coefficient & its p-value are as shown below.

When examining the association between duration (months) of cannabis disorders (quantitative response) and level of cannabis use (estimated number of cannabis joints smoked per month, quantitative explanatory), the correlation coefficient, r calculated was 0.136, p<0.001. This shows that the two variables are positively correlated, albeit very modestly. If we square the r value, we get 0.0184, in other words, only about 1.8% of the variability in duration of cannabis disorders can be explained by the level of cannabis use.
0 notes
Text
Chi-Square Test of Independence
Model Interpretation for Chi-Square test:

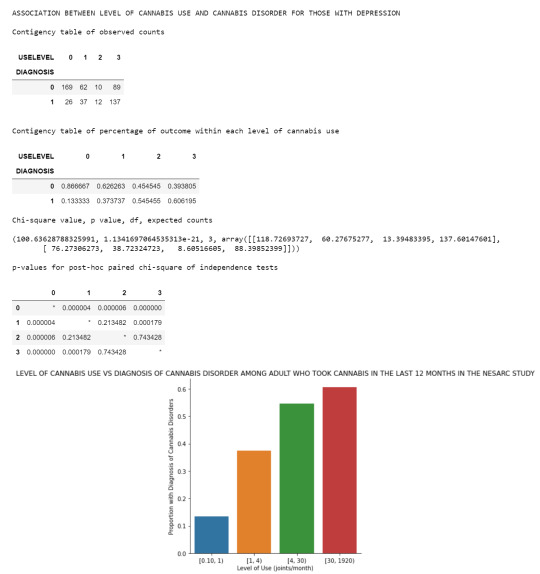
When examining the association between diagnosis of cannabis disorders (categorical response) and level of cannabis use (estimated quantity of marijuana joints smoked per month collapsed into 4 ordered categories as categorical explanatory variable), a chi-square test of independence revealed that among adult marijuana users (my sample), there are differences in the likelihood an individual will experience cannabis disorders amongst different level of cannabis use, X2=254.4, 3 df, p<0.001.
Model Interpretation for post hoc Ch-Square test results:

^ Because there are 6 comparisons, applying the Bonferroni correction means that a p-value has to be less than 0.05/6=0.0083 to be significant at the p<0.05 level.
Post hoc comparisons of rates of cannabis disorders diagnosis by pairs of marijuana joints smoked per month categories revealed that lower rates of cannabis disorders were seen in groups smoking fewer than 4 marijuana joints per month, with no statistically significance in rates amongst those smoking 4 cannabis joints or more per month. In comparison, those smoking on average 1 joint or more per month reported higher rate of cannabis disorders than those smoking on average less than 1 joint per month.
0 notes
Text
Analysis of Variance
Model Interpretation for ANOVA:
When examining the association between proportion of individuals with diagnosis of cannabis disorders (quantitative response) and level of cannabis use (which is the estimated number of cannabis joints smoked per month, collapsed into 4 ordered categories as the categorical explanatory variable), an Analysis of Variance (ANOVA) revealed that among adult cannabis users (my sample), there are significant differences in proportion of individuals with cannabis disorders diagnosis amongst different level of cannabis use F(3, 1563)=101.0, p < 0.001.
Model Interpretation for post hoc ANOVA results:

The mean of cannabis disorders diagnosis in each group and its standard deviation are as shown above. The table shows that the mean increases as the order of group/level of cannabis use increases. Post hoc comparisons were conducted and the results are as shown in the following table.

Post hoc comparisons of cannabis disorders rates by pairs of cannabis use level categories revealed that groups smoking 4 marijuana joints or more per month reported significantly higher proportion of individuals with cannabis disorders diagnosis compared to those smoking fewer joints per day. And those smoking on average 1 joint or more month also demonstrated higher risk of experiencing cannabis disorders than group using on average less than 1 joint per month. Comparisons between groups smoking 4 joints or more per month were statistically similar.
0 notes
Text
Data visualization
The univariate graph of cannabis disorders diagnosis:

The bar chart shows that 'No cannabis diagnosis' group has the highest count amongst the 4 groups.
The univariate graph of the frequency of cannabis use:

The chart above shows that the count for category is around 100 to 200, with 'Every day' group registers the highest frequencies at 221 observations.
The univariate graph of cannabis joints smoked per month:

This graph is unimodal, with the highest peak at lowest number joints per month group (0 - 42 joints per month). It seems to be skewed to the left as there are higher frequencies in the lower cannabis joints per month groups.
The bivariate graph of level of cannabis use vs. diagnosis of cannabis disorder:

The graph above shows the relationship between level of cannabis use and the proportion of cannabis disorder diagnosis. We can see that higher level of cannabis use is associated with higher proportion of cannabis disorder diagnosis.
0 notes
Text
Making Data Management Decisions
Some of the data management decisions I have made include:
removing missing values (Out of 1603 adult respondents who have taken marijuana in the past 12 months, 40 of the observations have missing
value in either S3BD5Q2C [frequency of cannabis use] or S3BQ3 [number of marijuana joints smoked per day], or both, leaving 1563 observations for further analysis);
converting frequency of cannabis use [S3BD5Q2C] to a standard unit, number of days per month [FREQ];
calculating number of cannabis joints smoked per month [FREQMON] by multiplying number of days of cannabis use per month [FREQ] with number of marijuana joints smoked per day [S3BQ3], then binning the calculated values [FREQMONBIN].
Frequency distribution of cannabis disorders diagnosis:

The table above shows diagnosis of cannabis disorders in the past 12 months. 1013 (64.81%) of the sample did not have a diagnosis of any cannabis disorders. On the other hand, 420 (26.87%) of the respondents were diagnosed as having cannabis abuse only, 21 (1.34%) were diagnosed as having cannabis dependence only and 109 (6.97%) were diagnosed with both disorders.
Frequency distribution of periodicity of cannabis use:

The table above shows the frequency of cannabis use in number of days per month. 737 (47.15%) of the respondents took marijuana once a month or less in the past 12 months. 221 (14.14%) of the sample used cannabis on a daily basis.
Frequency distribution of quantity of joints smoked per month:

The last table shows the number of cannabis joints smoked per month in the last 12 months. Majority of the respondents, 655 (41.91%) of them, on average smoked 1 joint or less per month. 178 (11.39%) of the sample smoked more than 1, up to 3 joints per month. 288 (18.43%) of the respondents smoked more than 32 marijuana joints per month.
0 notes
Text
Frequency Distributions of 3 Chosen Variables
A sample of 43093 adults were asked how often they used cannabis in the past 12 months. 41479 (96.3%) of them did not use cannabis in the last 12 months, 23 (0.05%) of them did not provide a valid response, 1011 (2.3%) of them used once a month or more.
They were also asked how many marijuana joints usually smoked in a day in the past 12 months. The data for 48 (0.11%) of them was missing. Number of marijuana joints smoked ranges from 1 to 64 per day.
For the next question, they were asked if they had been diagnosed with cannabis disorder (i.e. cannabis abuse, cannabis dependence or both) in the past 12 months. 427 (0.99%) of them were diagnosed with cannabis abuse only, 23 (0.05%) of them were diagnosed with cannabis dependence only, 110 (0.26%) of them were diagnosed with both disorders, with majority of them did not have a diagnosis of cannabis disorder.


0 notes
Text
Research Question & Literature Review
Selecting Data Set, Formulating Research Questions & Hypothesis
I am interested to explore topics related to cannabis dependence after going through the codebook for the NESARC study, specifically I am interested to find out the association between the level of cannabis use and cannabis disorders, as well as the relationship between the level of cannabis use and duration of cannabis disorder.
For the first research question - how much and how frequent does one need to take cannabis before develop first incidence of cannabis disorder (cannabis abuse or cannabis dependence)? I hypothesized higher quantity and frequency of cannabis use increases the risk of developing cannabis disorder
For the second research question - is the level of cannabis use, in term of quantity and frequency, associated with the duration of cannabis disorder (i.e. cannabis abuse or cannabis dependence) episode? I hypothesized that higher level of cannabis use increases the duration of cannabis disorder episode.
From the NESARC dataset, I selected variables reflecting the level of cannabis use in terms of quantity and frequency, as well as data about whether an individual was diagnosed with cannabis abuse or dependence, the duration of cannabis abuse or dependence to my own codebook.
Literature Review
I searched for relevant literatures on Google Scholar using search terms e.g. cannabis use, cannabis dependence, cannabis abuse, duration of cannabis disorder, marijuana use, marijuana dependence, marijuana abuse and duration of marijuana disorder.
Based on literature review conducted, there are different findings on the association between level of cannabis use and cannabis dependence. In a paper studying the relationships between frequency and quantity of marijuana use and last year proxy dependence among adolescents and adults in the United States, Chen et al. (1997) pointed out that frequency and quantity of use each had an effect on cannabis dependence with frequency of use showing stronger association (1). While Pol et al. (2013) concluded in their paper titled “Predicting The Transition from Frequent Cannabis Use to Cannabis Dependence: A Three-year Prospective Study” that concurrent problems are more important factors in predicting cannabis dependence than the level of use (2). No article was found on the relationship between level of cannabis use and duration of cannabis disorder.
References
Chen, K., Kandel D. B. & Davies, M. (1997). Relationships between frequency and quantity of marijuana use and last year proxy dependence among adolescents and adults in the United States. Drug and Alcohol Dependence, 46(1-2), 53-67. doi:10.1016/S0376-8716(97)00047-1
Pol, P., Liebregts, N., Graaf, R., Korf, D. J., Brink, W. & Larr, M. (2013). Predicting the transition from frequent cannabis use to cannabis dependence: A three-year prospective study. Drug and Alcohol Dependence, 133(2), 352-359. doi:10.1016/j.drugalcdep.2013.06.009
1 note
·
View note