
Statistics
We looked inside some of the posts by liz0791-blog and here's what we found interesting.
Average Info
Notes Per Post
0
Likes Per Post
0
Reblog Per Post
0
Reply Per Post
0
Time Between Posts
5 months
Number of Posts By Type
Text
7
Last Seen Tumblr Blogs


Fun Fact
The KCSC sent more than 20K requests to delete posts related to prostitution and porn to Tumblr from January to June 2017.
Text
Climate changes and Global Warming
Climate changes and Global Warming

Recent studies carried by NASA and International Panel on Climate Change – IPCC have shown that atmosphere and ocean have warmed, having significant and costly effects on our communities, our health, and our climate.
To raise a concern and get actions taken is a must!
Visual tools like Tableau have a powerful and simplified way to tell a history that can be understood by everyone and by…
View On WordPress
0 notes
Text
Time Series is a very useful model when we have an ordered sequence of values of a variable at equally spaced time intervals. In this article, I am interested in using Time Series to analyse price behaviour between January 2010 and May 2018 and perform forecasting to predict prices behaviour for the next 5 years.
For this part of my analysis I am going to be focusing on a very useful method called ARIMA which stands for AutoRegressive Integrated Moving Average. ARIMA is one of the most popular techniques used for time series analysis and forecasting purpose.
R has a function that does the hard job for us, called auto.arima( ) which is an automated way to find the optimized model.
The focus here is analysing the top 6 most expensive counties. Then, we’ll be looking at two counties on the bottom list, and finally, at the overall national level. See top 6 list below:

For a more meaningful analysis I went back to the original dataset on Housing Prices and organized the data by year and by month, calculating the average price of each county using MySQL to query the data.
Next, I have loaded the result dataset into R and used the function filter( ) to select each county.
Since I am dealing with monthly instances, I have selected my frequency at 12, starting point at “2010, 1” (January) and end point at “2018, 5” (May) for all TS models. See model’s process for Dublin below:


We can see from Dickey-Fuller’s test and from the last graph that data is non-stationary and not normally distributed which is what we want to proceed with an AUTO.ARIMA modelling.
Using seasonal decomposition on the following graph we can analyse the observed data versus the trend line, showing an increase over the years. The graph shows also that in fact there is a seasonal frequency reinforcing the monthly prices recorded. The last part shows the Random or Remainder which is the “random” noise in the data.
plot(decompose(tsDub))

Looking closely at the trend line for house prices behaviour over the last 8 years in Dublin is possible to see that despite massive price drop from 2010 to 2013, prices have been dramatically increasing with slight fluctuations.

As mentioned previously, the best way to build our model is using R’s function auto.arima( ) which is automatic way to find the optimized model and does all the adjustments needed to provide the best model.

Note that we set the parameter D=1, which governs seasonal differencing to ensure that seasonality is preserved. (The default NA allows auto.arima() to use or not use seasonality).
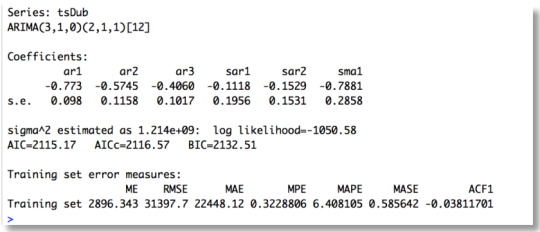
Also, note that here I used the parameter “trace” to show all the possible models and to highlight the best one, which is the one with the lowest “AIC”. See output below:
Let’s analyse the outcome:
tsdisplay(residuals(dub.fit), lag.max=45)

We can see a satisfactory white noise at ACF and PACF boxes with the big majority (over 95%) of the lines within the blue lines, indicating that the residuals are behaving like white noise.
Below we can see that Log Likelihood excluding the minus is sufficiently high, 1050.58, which is what we want. And the values BIC and AIC were the lowest ones of all ARIMA models tested by the auto.arima( ) function.
Validating our model against residuals using Ljung-Box:
We can see that p-values are quite insignificant, meaning that our model is free of auto-correlation which is what we want.
Forecasting the next 5 years:

I have applied the same procedure to model Time series for Wicklow, Cork, Kildare, Galway and Meath (top highest on price list) and for Donegal and Longford (bottom list) as well as on National level. See price behaviour trend line for the last 8 years and 5 years forecasting for each county below:
This slideshow requires JavaScript.
The top 6 counties are showing a dramatic price increase from 2013/2014 until 2018. And 5 years forecast predicts that increases will be continuing to happen.
Counties like Donegal and Longford, however, had a decrease in prices from 2010 to 2014 and despite increase from 2014, prices are half of what it was in 2010, as we can see on their trend line graph, and although we can see some oscillations over the months, prices seem to remain stable for the next 5 years according to their forecast prediction.
At a national level Time Series Forecasts have shown that prices seem far from stabilising. With rents also increasing, it is cheaper to pay a mortgage than rent, however getting mortgage approved is not the problem, but finding a property we can afford certainly is.
Time Series Analysis on Housing prices with future predictions Time Series is a very useful model when we have an ordered sequence of values of a variable at equally spaced time intervals.
0 notes
Text
Multiple Linear Regression on Irish Property factors
Multiple Linear Regression on Irish Property factors
Based on Morgan Kelly’s arguments, this article proposes an analysis of past data to define patterns and possibly make future predictions. The proposed review will discuss the relationship between housing prices and its potential indicators.
It seems evident from Morgan Kelly’s researches that House-price collapses has a major effect in the economy and historic facts can prove that. During my…
View On WordPress
0 notes
Text
Alcohol Consumption versus Anxiety -Creating graphs for my data
Data set: NESARC (National Epidemiologic Survey of Drug Use and Health) Software: SAS Studio
We are now going to create graphics in order to visualize our data. There are a variety of conventional ways to visualize data - tables, histograms, bar graphs, etc, and the software SAS will help us to graph the chosen variables to better display our findings.
Since we are more interested in explore the cases where people showed any sort of association with alcohol consumption and/or general anxiety, we’ve decided to refine our data once again in order to concentrate only on positive and negative answers, leaving behind the “unknown” and “did not meet the question criteria” out of our data.
Here is new our coding:

Note that from the previous post, we’ve decided to collapse the variables: FREQDRI related to the “how often our sampling drank any alcohol in last 12 months” and FREQDRIN related to the number of times our sampling drank enough to feel intoxicated” as we found during the graphic’s analysis that the were not strongly associated to the relationship we want to create.
Instead, we’ve decided to include the variable S9Q19A, “Ever drank alcohol to avoid generalized anxiety” as this variable is directly linked to alcohol consumption and will generate more relevant results on our graphics.
Here is the output for our new variable:

Note that ‘frequency missing’ is related to the number of cases that do not interest our research question.
The frequencies we are looking to analyse are:
1. Yes
2. No
Next, we will display the univariate graphs of our chosen variables:

This graph is also unimodal, skewed to the right, with highest peak at category number 1 showing that people admitted suffering from general anxiety found it difficult to stop being tense/worried/nervous. On that chart is important to note that the category number 1 where people responded “yes” is considerably higher that the percentage of people that said “no” for this question.

This graph is unimodal, skewed to the left, with high peak at category number meaning that those that admitted suffering from general anxiety did not drink alcohol to avoid any symptom.
At this point we will use the variables S9Q33 and S9Q19A to create the association between alcohol consumption and anxiety by exploring the relationship between those two variables.
As we are looking to answer how often a person that suffers from anxiety recur to alcohol to feel better, we chose S9Q33 (ever find it difficult to stop being tense/nervous/worried) as our explanatory variable and S9Q19A (ever drank alcohol to avoid generalized anxiety) as our response variable.
See our bivariate graph bellow:

We can see that the bar chart is unimodal and skewed to the right, showing its highest peak at the group of people that admitted drinking alcohol to avoid generalized anxiety which proves that there is a strong association between alcohol consumption and anxiety.
0 notes
Text
Alcohol Consumption versus Anxiety - Making Data Management Decisions
Data set: NESARC (National Epidemiologic Survey of Drug Use and Health)
Software: SAS Studio
Our next step on this research is to manipulate the variables we believe are important to answer our research question and manage that data in order to evaluate whether we will need all the data provided or eliminate the information considered not relevant.
With the use of more specific commands, SAS enable us to code out missing data, code in valid data, record variables, create secondary variables and bin or group variables.
See bellow the coding used:

Program output:

First of all, we refined the data present on the variables S2AQ8A (How often drank any alcohol in last 12 months), S2AQ10 (How often drank enough alcohol to feel intoxicated in last 12 months) and S9Q33 (In worst period, ever find it difficult to stop being tense/nervous/worried). We excluded the ‘Unknown’ cases as we consider that this number is irrelevant to the data we want to work with.
After that, we included on our program output the data we considered valid to us and that was previously shown as missing data.
For the variables S2AQ8A and S2AQ10 related to Alcohol Consumption, we would also like to consider the frequency of ‘Former drinker or lifetime abstainer’ and we will name that frequency as: 11- Zero times per week .
For the variable S9Q33 related to General Anxiety, we included the number of cases where people ‘Never had 6+ month period felt tense/nervous/worried’ and we will name that frequency as: 3- Anxiety symptoms not present.
In order to better classify the relevant degree on alcohol consumption, we decided to divide the variables S2AQ8A and S2AQ10 in subgroups. For that matter we collapsed those two variable and we created two new variables named FREQDRI and FREQDRIIN, respectively. On those two new variables we will be looking at 3 categories:
1- Group of people that drank at least 3 to 4 times a week (Concerning)
2- Group of people that drank between 2 times a week and once a month (Moderate)
3- Group of people that drank between 7 to 11 times in the last year and didn't drink at all (Not concerning)
Looking at our three new output data we can se that on the first variable the big majority of the interviewed (58.02%) people fell on the category 3, meaning that the amount of alcohol consumed in the last 12 months is not concerning in relation to possible alcohol dependancy. The second variable shows that the big majority of the interviewed people (93.77%) did not consume alcohol enough to feel intoxicated. And the last variable indicates that 91.98% of the them doesn't suffer from anxiety.
Up until now, from the sampling analysed, we can tell that the number of people that suffer from anxiety and possible recur to alcohol to feel better is quite low, which is good news. However, if we consider the fact that the percentage of people that felt difficult to control any symptom of anxiety is 3.65 times higher than people that admitted that can control. And, if we add that: 13.21% of the interviewed consume alcohol at least 3 to 4 times a week which can be concerning, we could easily suggest that there is a correlation between those two cases.
0 notes
Text
Alcohol Consumption versus Anxiety - Running My First Program
Data set: NESARC (National Epidemiologic Survey of Drug Use and Health)
Software: SAS Studio
After careful analysis of the chosen data set and with the support of SAS software we were able to compile the information we have considered most relevant to answer our research question.
See the coding bellow:


Note that the for the purpose of this assignment It will be only displayed 3 variables on the program output. However, over the course of this study more variables will be analysed in order to explore the association we aim to create on this study. At line 3 it was used the command KEEP to display the other variables we will be looking at further on this research.

On the program output displayed above a total of 43093 people were asked the following questions:
1) How often drank any alcohol in the last 12 months?
2) How often drank enough alcohol to feel intoxicated in the last 12 months?
3) In worst period, ever find it difficult to stop being tense/worried?
The first two questions are related to alcohol consumption and the frequencies are measured by:
1. Every day
2. Nearly every day
3. 3 to 4 times a week
4. 2 times a week
5. Once a week
6. 2 to 3 times a month
7. Once a month
8. 7 to 11 times in the last year
9. 3 to 6 times in the last year
10. 1 or 2 times in the last year
99. Unknown
The third question is related to general anxiety and the frequencies are measured by:
1. Yes
2. No
3. Unknown
Note that the frequency missing is related to the cases where the questions were not applicable to some people interviewed.
On the first question 31.95% drank alcohol at least 2 times a week, being 11.41% of them admitting that drank every day or nearly every day, which is quite concerning and suggests a strong potential to become an alcoholic.
The second question shows that 4.61% drank enough alcohol to become intoxicated at least once a week. Although it is a small percentage, if we consider the fact that some people that fall in that percentage might suffer any type of anxiety, that can be considerable an aggravating, which leads us to the last question.
On the last question displayed we can see that a high percentage of 77.88% of the interviewed people find it difficult to stop being tense/worried suggesting that they have a strong potential of suffer from anxiety and furthermore, could be considered, for many people as suggested on the precious post, enough reason to make use of alcohol to relive the tension.

0 notes
Text
Alcohol Consumption versus Anxiety - Developing a research question
Data set: NESARC (National Epidemiologic Survey of Drug Use and Health)

(source: www.spirityourreality.com. Image by unknown)
According to www.yourmentalhealth.ie, anxiety can be described as a passing emotion attached to life circumstances or situations such as exams, getting married, work pressures or retirement. For some people, anxiety is something they experience on an ongoing basis that really interferes with their life.
Many people that suffer with anxiety believe that drinking alcohol can help them to relax, which is commonly a big mistake as it can aggravate their levels of anxiety.
The American Journal of Psychiatry argues that: ‘The idea that people suffering from anxiety have a proclivity to consume alcohol to relieve they symptoms is supported by reports showing high comorbidity rates of alcohol and anxiety problems. The authors reviewed relevant epidemiological surveys, family studies, and field studies and conclude that relationship between alcohol problems and anxiety appears to be variable among the anxiety disorders’. (Kushner, Matt G; Sher, Kenneth J; Beitman, Bernard D. The American Journal of Psychiatry147.6 (Jun 1990): 685-95.)
In this article, we are going to raise hypothesis about the effects of the association of alcohol and anxiety.
We will be looking at how often people that suffer from anxiety recur to alcohol to feel better and what are the consequences of the mix of alcohol and anxiety. With that in mind, we want to find the answer for the following question:
Can a person that suffers from anxiety be more susceptible to drinking problems than a person that doesn't?
We will be analysing data taken form NESARC codebook which is a survey designed to determine the magnitude of alcohol use and psychiatric disorders in the U.S. population. It is a representative sample of the non-institutionalized population 18 years and older. And we will be looking specificaly at the topics highligted bellow:

Our variables on that research are:
Tape Location;
Source Code;
Frequency;
Item value and description.
After thorough study on sections 2A and 9, we have selected a more concise codebook with the information we find relevant to explore our hypothesis and that it is believed essential to answer the questions raised previously in this article. This new codebook contains the following data:
On section 2A - Alcohol consumption, we will be looking at:
- How often has our researched group drank any alcohol in the last 12 months;
- How often drank at home alone in the last 12 month;
- How often drank in public places in the last 12 months;
- Number of days since last drink (respondents who drank in last month);
On section 9 - Generalised Anxiety (General Anxiety), we will be looking at:
- In worst period, ever find it difficult to stop being tense/nervous/worried;
- In worst period, often felt irritable;
- In worst period, often had trouble falling/staying asleep;
- Any episode began after drinking heavily/more than usual;
- Any episode began when experiencing bad aftereffects of drinking;
- Continued tense/nervous after only/all episode(s) when stopped drinking/drug use prior to last 12 month.
Electronic databases:
https://d396qusza40orc.cloudfront.net/phoenixassets/data-management-visualization/NESARC%20Wave%201%20Code%20Book%20w%20toc.pdf
http://search.proquest.com/openview/b61ecfe6889e591d0e957c25840480e5/1?pq-origsite=gscholar
http://www.adaa.org/understanding-anxiety/social-anxiety-disorder/social-anxiety-and-alcohol-abuse
http://www.yourmentalhealth.ie/About-Mental-Health/Common-problems/Mental-health-problems/Anxiety/
http://ajp.psychiatryonline.org/doi/abs/10.1176/ajp.147.6.685
http://spirityourreality.com/%EF%BF%BCmisconceptions-of-alcoholicsaddicts/
0 notes