
Don't wanna be here? Send us removal request.
Statistics
We looked inside some of the posts by llmgroup2 and here's what we found interesting.
Average Info
Notes Per Post
0
Likes Per Post
0
Reblog Per Post
0
Reply Per Post
0
Time Between Posts
6 days
Number of Posts By Type
Text
6
Last Seen Tumblr Blogs


Fun Fact
US Tumblr user growth rate is estimated to slow down to 4.1%.
Text
Improved target table
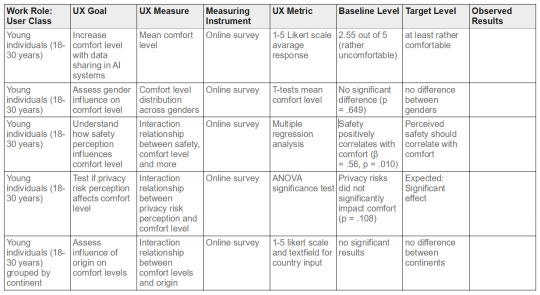
Defining the Research Question and explaining the independent and dependent variables
To what extent are young individuals comfortable sharing their personal data with large language models, and what factors influence their comfort level?
The rapid advancement of artificial intelligence, particularly large language models (LLMs) like GPT-4, has brought about significant changes in how data is utilized and managed. These models rely heavily on vast amounts of data to function effectively, raising important questions about data privacy and user comfort. Despite the growing prevalence of LLMs in various applications, there is a notable gap in research specifically addressing how comfortable young individuals are with sharing their personal data with these systems.
Understanding the comfort levels of young individuals is crucial, as they are often early adopters of new technologies and their attitudes can shape future trends. This research question aims to fill this gap by exploring not only the extent of their comfort but also the factors that influence it.
We had an open approach in analysing our data due to the hypotheses being non-directional, thus facilitating a comprehensive exploration of the factors influencing young individuals' comfort levels with sharing their personal data with LLMs. This approach allowed us to consider multiple potential influences without being constrained by preconceived expectations about the direction of the relationships.
Independent variables
Independent variables are the factors that are hypothesized to influence the dependent variables. In this study, the independent variables are:
Perceived Privacy Risks: The extent to which individuals believe that sharing their data poses privacy risks.
Trust in AI Systems: The level of trust individuals have in AI systems to handle their data responsibly. This was directly measured through the question in the survey.
Awareness of Data Usage Practices: How aware individuals are of how their data is used by AI systems.
Social Norms Influence: The impact of social norms and peer influence on individuals' comfort levels with sharing data.
Demographics: Characteristics such as age, gender, and field of study that may influence comfort levels
Dependent variables
Dependent variables are the outcomes that are measured to see if they are affected by the independent variables. In this study, the dependent variables are:
Comfort Level with Sharing Personal Data: How comfortable individuals feel about sharing their personal data with LLMs.
Types of Data Willing to Share: The specific types of personal data (e.g., contact information, browsing history) that individuals are willing to share.
Perceived Safety of Data Management: How safe individuals perceive the management and handling of their data by LLMs.
UX Inspection (ChatGPT)
Do you think ChatGPT is easy to use, and why?
People strongly agree it is easy to use, because:
Possibility of uploading pictures
Similarity to search engines
Simplicity of asking a question
Simple interface
Single action (the big text field)
It adapts its answer to your question
Easy language
However some argue it is not so easy to use, because:
Limited amount of searches
Not easy if one wants to get the best result
What feature would make you feel more safe using ChatGPT?
For each chat separate agreement to share the data or not for training
Hidden chat like incognito tab, where as soon as one leaves the chat is gone
Making sure that the answers of one are not used for the work of others
Providing insights into how it works
Feature to remove all stored data and biases about one
It should specifically state if a user asks to say exactly what they say, as it can be used for misinformation
0 notes
Text
Data evaluation
Method of recruiting participants
Each of us aimed to recruit from 10 to 15 people, with the final number of participants being 52. This allowed us to have a good representation across various cultural and educational backgrounds and capture a wide range of perspectives. A sample size of 52 also helped us identify common patterns and insights within survey responses, allowing us to filter out themes and trends. We sent out the survey to our friends and peers using media like WhatsApp, Instagram, Telegram or Messenger. We didn’t post the survey in big groups to avoid obtaining troll responses.
Research questions
To what extent are young individuals comfortable sharing their personal data with large language models, and what factors influence their level of comfort?
In our research, we aimed to understand the balance young people strike between convenience and privacy concerns. The results we got provide insights into the dynamics of digital trust and how young users perceive AI-driven interactions in relation to their personal data. We wanted to learn what young people use LLMs for, how informed and comfortable they are about sharing data with them and how safe they think LLM usage is. We saw how comfortable people are about sharing personal data based on its type, for instance their location, social media data or browsing history. We also distinguished their level of concern when it comes to privacy, security, data retention and other aspects. With three scenarios related to LLM applications we explored the willingness to use this technology for specific purposes.
Research methods
We created a survey with yes and no, Likert scale and multiple choice questions. For demographics information (country, age and field of study) we used short answer questions and tidied up the data. Since some people didn’t input the data in the right format, we had to exclude them from the evaluation. We used three realistic scenarios of LLM-powered applications as stimuli or props to see if there were changes in comfort levels depending on context. We ran the survey for a week and analyzed the data using Rstudio after preparing it for analysis in Excel. We used statistical methods such as ANOVA and t-tests to see if there are relationships or correlations between different subsets of our data.
Stimuli presented during survey
We presented our participants with three different scenarios regarding hypothetical AI-based applications. For each of those scenarios (Personalized Study Assistant, Health and Wellness AI Companion, Career and Job Recommendation Tool) we asked them to judge how comfortable they would feel sharing data with this app and whether they would share their data to use it, with people being most positive about sharing their career-related data. This allowed us to provide the participants with practical, real life examples and get more reliable answers.
Main findings
The ages of the participants (n= 53) ranged from 19 to 27 years ( M = 21.42 ), ( SD = 1.84), showcasing the youth of our participants. Most of our participants (over 50%) were 20 or 21, with ages ranging from 19 to 27. Approximately, 55% of them were female and 44% were male, and one person didn’t specify their gender (which later on lead to excusion from the Welch two sample T-test, n=52).
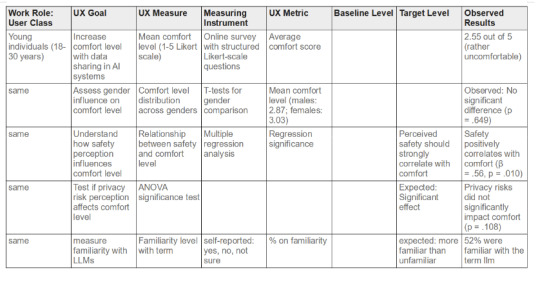
The mean comfort level was 2.55 out of 5, indicating a slight tendency to uncomfortness, paired with a standard deviation of 1.12, implicating varying comfort levels.
The mean familiairty with the term ‘LLM’ was 0.52, meaning that an equal number of people were familiar with the term, as well as not familiar (43.4% respectively), and 13.2% were not sure what ‘LLM’ means. Majority of participants (30.2%) use LLMs at least once a day, and two participants (3.8%) didn’t use LLMs at all.
The people mostly felt that sharing personal information with LLMs is very normalised (M = 3.8 (on a scale of 1-5), (SD = 1.06).
An analysis of variance (ANOVA) was conducted to examine the effect of gender and of the continent the participants are from on the percieved social norm of sharing information with LLMs. The results indicated that there was no significant effect of gender on normalized comfort levels, ( F(1, 51) = 1.574, p = .215 ).
An analysis of variance (ANOVA) was conducted to examine the effect of continent on normalized comfort levels (Normalized). The results indicated that there was no significant effect of continent on normalized comfort levels, ( F(2, 50) = 1.84, p = .169 ).
T-test by Gender for Health and Wellness AI Companion Comfort
A Welch two-sample t-test was conducted to compare Health and Wellness AI Companion Comfort scores between genders. There was no significant difference in the scores for group 0 (M = 2.87, SD = not provided) and group 1 (M = 3.03, SD = not provided); t(49.35) = -0.46, p = .649. The 95% confidence interval for the difference in means was [-0.89, 0.56].
T-test by Gender for Career and Job Recommendation Tool Comfort
A Welch two-sample t-test was conducted to compare Career and Job Recommendation Tool Comfort scores between genders. There was no significant difference in the scores for group 0 (M = 3.78, SD = not provided) and group 1 (M = 3.17, SD = not provided); t(46.77) = 1.90, p = .064. The 95% confidence interval for the difference in means was [-0.04, 1.26].
T-test by Gender for Personalized Study Assistant Tool Comfort
A Welch two-sample t-test was conducted to compare Personalized Study Assistant Tool Comfort scores between genders. There was no significant difference in the scores for group 0 (M = 2.78, SD = not provided) and group 1 (M = 2.52, SD = not provided); t(44.92) = 0.80, p = .429. The 95% confidence interval for the difference in means was [-0.40, 0.93].
Conclusion:
The t-test analyses revealed that there were no significant differences in comfort levels between genders for any of the AI tools examined: Health and Wellness AI Companion, Career and Job Recommendation Tool, and Personalized Study Assistant. This suggests that gender does not significantly influence comfort levels with these AI tools among the participants in this study. The findings indicate that other factors, such as perceived privacy risks, trust in AI systems, and safety perceptions, may play a more critical role in determining comfort levels with AI tools. Further research could explore these factors in more detail to better understand what influences comfort levels with AI technologies.
MULTIPLE REGRESSION ANALYSIS:
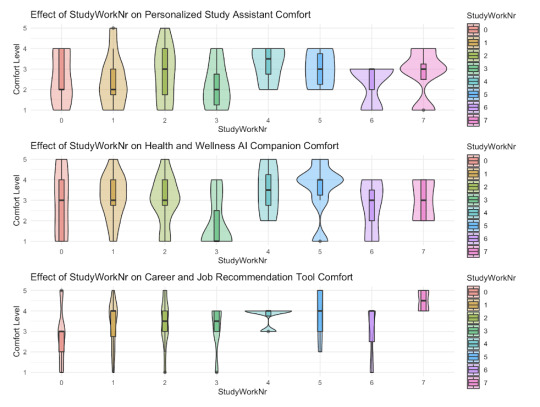
Figure… violin plot of the ….
The key: studyWorkNr:
0 = other
1 = computer science
2 = business, economics (finance)
3 = neuroscience, psychology
4 = social sciences and humanities (history, linguistics etc)
5 = other stem fields (math, physics, chemistry, statistics)
6 = medicine and health care related
7 = engineering
Personalised study assistant
A multiple regression analysis was conducted to examine the effect of the major or field of work on the perceived comfort with using a personalised study assistant, controlling for age, gender, privacy concerns, and safety perceptions. The overall model was not statistically significant, ( F(11, 40) = 0.92, p = .528 ), with an ( R^2 ) of .203 (Adjusted ( R^2 ) = -.017).
The analysis revealed that none of the fields of study (Computer Science, Business/Economics, Neuroscience/Psychology, Social Sciences/Humanities, Other STEM Fields, Medicine/Health Care, Engineering) had a significant effect on comfort levels with the Personalized Study Assistant. Additionally, age, gender, and privacy concerns did not significantly predict comfort levels. However, safety perceptions were a significant positive predictor (( p = .024 )), indicating that higher safety perceptions are associated with greater comfort with the Personalized Study Assistant.
Overall, the model explained approximately 20.26% of the variance in comfort levels with the Personalized Study Assistant, but only the Safety variable was a significant predictor. This suggests that perceptions of safety play an important role in determining comfort levels with the Personalized Study Assistant, while other factors such as field of study, age, gender, and privacy concerns do not have a significant impact.
Health and Wellness AI companion
A multiple regression analysis was conducted to examine the effect of field of study on comfort with a Health and Wellness AI Companion, while controlling for age, gender, privacy concerns, and safety perceptions. The overall model was not statistically significant, ( F(11, 40) = 0.82, p = .617 ), with an ( R^2 ) of .185 (Adjusted ( R^2 ) = -.039).
Overall, the model explained approximately 18.48% of the variance in comfort levels with the Health and Wellness AI Companion, but none of the predictors were statistically significant. This suggests that the factors considered in this model, including field of study, age, gender, privacy concerns, and safety perceptions, do not have a significant impact on comfort levels with the Health and Wellness AI Companion.
Career and job recommendation AI tool
Lastly, the final multiple regression analysis was performed to similarly examine the effect of the field of study on the comfort levels with a Career and Job Recommendation Tool, while controlling for age, gender, privacy concerns, and safety perceptions. The overall model was not statistically significant, ( F(11, 40) = 1.30, p = .258 ), with an ( R^2 ) of .264 (Adjusted ( R^2 ) = .061).However, safety perceptions were a significant positive predictor (( p = .037 )), indicating that higher safety perceptions are associated with greater comfort with the Career and Job Recommendation Tool. Privacy concerns showed a trend towards significance (( p = .085 )).
Overall, the model explained approximately 26.38% of the variance in comfort levels with the Career and Job Recommendation Tool, with safety perceptions being the only significant predictor.
Overall conclusion from the multiple regression analysis:
Across all three analyses, safety perceptions consistently emerged as an important factor influencing comfort levels with AI tools. Specifically:
Personalized Study Assistant: Safety was a significant predictor.
Health and Wellness AI Companion: No significant predictors were found.
Career and Job Recommendation Tool: Safety was a significant predictor, and privacy concerns showed a trend towards significance.
Field of study, age, and gender did not significantly impact comfort levels with any of the AI tools analyzed. This suggests that perceptions of safety play a crucial role in determining comfort levels with AI tools, while other demographic and contextual factors may have less influence. A larger sample size is necessary to observe the impact of different factors to carefully examine their effects.
Furthermore, people have slightly low confidence about data management.
The perception of privacy risks does not affect comfort levels, but perceived safety has a significant effect on comfort levels.
The comfort levels do not vary greatly between genders.
Personalized study assistant:
Individuals perceiving higher safety are more comfortable using the assistant.
Health and Wellness AI:
No impact on people's comfort levels.
Career and Job recommendation:
Comfort level increases with higher safety.
Interpretation: People tend to have a lower confidence and comfort level when it comes to their data and how LLMs use this data. However, our results indicate that increasing safety for data increases comfort and confidence. Furthermore, privacy risks do not impact the comfort and confidence of individuals generally. This indicates a possibility for companies to increase comfort and confidence, as people tend to be more comfortable and confident when they are aware of increased safety mechanisms.
Also important to note is the low difference between genders.
First draft of UX target table
0 notes
Text
Data gathering pt. 2
Spreadsheet: https://docs.google.com/spreadsheets/d/1wIaP3yvn4mik2hjpEVTBjFyMrgCL8UG1ko6llgCvKgM/edit?resourcekey=&gid=1377043017#gid=1377043017
Graphs:
0 notes
Text
Data Gathering
Set a goal
This week, our goal was to design and build a well-structured survey that can gather data about young people’s comfort levels with sharing personal data with AI, particularly large language models (LLMs). We brainstormed potential survey questions and wrote different scenarios to create relatable "props" within the survey. By incorporating these scenarios, we aim to measure the participants' willingness to share personal data from different perspectives. Although the questionnaire is nearly complete, we still have a few questions about refining certain sections to ensure clarity and relevance, so we hope we can finalize our questionnaire after we get feedback from our classmates and the professor.
The variables
The independent variables for this research are factors that may influence the “comfort level” of young people towards sharing personal data with LLMs, specified in our research question. They include:
Perceived privacy risks
Trust in AI systems
Awareness of data usage practices
Influence of social norms
The primary outcome we are measuring, or the dependent variable, is the comfort level with sharing personal data with LLMs, as reflected by the answers of participants via rating on the Likert scale.
Formative evaluation:
In a formative evaluation, it's essential to identify and focus on the critical aspects of user experience (UX) that impact participants' comfort levels with large language models (LLMs). Key areas to test include perceived privacy and security, where we assess how safe participants feel sharing different types of personal data, and trust in the AI system, examining factors such as transparency in data usage and the credibility of the company behind the LLM. Transparency and control over data are also critical, as it’s important to gauge whether users feel they have sufficient control, such as the ability to view, edit, or delete data, and if a lack of control impacts their comfort levels. Additionally, we need to evaluate the perceived value of data sharing, exploring whether certain benefits like personalized recommendations or convenience make users more willing to share data despite privacy concerns. Lastly, understanding the normalization of data-sharing practices is important to uncover any societal pressures or norms influencing users’ comfort levels. By focusing on these key experience features, we aim to refine elements that directly affect trust and usability, ultimately enhancing the comfort level young people feel when engaging with LLMs.
Null hypothesis: there is no significant effect on the factors that influence comfort levels
Alternative hypothesis: there is a significant effect on at least one of factors that influence comfort levels
Alternative Hypotheses for Each Factor:
H1a: Perceived privacy risks significantly affect the comfort level of young people toward sharing personal data with LLMs.
H1b: Trust in AI systems significantly affects the comfort level of young people toward sharing personal data with LLMs.
H1c: Awareness of data usage practices significantly affects the comfort level of young people toward sharing personal data with LLMs.
H1d: Influence of social norms significantly affects the comfort level of young people toward sharing personal data with LLMs.
Quantitative measures:
For close ended questions we can calculate the frequency and percentages. These results can also easily be visualized then. For the questions using the Likert scale, we can compute mean and median, to gain an understanding of the average comfort levels for example.
Furthermore we can measure correlation between variables, for example the correlation between how safely participants think their data is managed and how comfortable they are to share their data with that LLM. We can also use standard deviation, to see if opinions vary strongly or are consistent within participants.
We can create contingency tables for participants that are familiar with LLMs and the ones not familiar, and then, using the Chi-square we can measure whether familiarity with LLMs influences one's comfort level.
If applicable (to be discussed in class), we can also use a T-test with independent samples, to measure the difference between male and female participants and their comfort levels. Moreover (also to be discussed), we could use ANOVA to group participants into frequency usage, and then measure the difference in comfort level between participants.
Qualitative measures:
At this point of our research we have decided to opt out of employing most qualitative measures, like conducting surveys or observations. This is mostly due to the fact that these methods are very time-consuming while providing less objective data that is difficult to compare and analyze for further insights. By opting for quantitative measures, we want to speed up our data collection process, allowing us to gather a larger sample size more efficiently. Quantitative data will allow us to apply statistical methods, ensuring that our findings are more objective, easily comparable and statistically valid. Focusing on qualitative data could potentially introduce biases to our results, which we want to avoid.
Survey:
0 notes
Text
Research Design
Research question: To what extent are young individuals comfortable sharing their personal data with large language models, and what factors influence their level of comfort?
By exploring aspects such as perceived privacy risks, trust in AI systems, awareness of data usage practices, and the influence of social norms, we aim to understand the balance young people strike between convenience and privacy concerns. This research will provide insights into the dynamics of digital trust and how young users perceive AI-driven interactions in relation to their personal data.
Participants sampling:
In this study, we are planning to use a combination of opportunity and random sampling to gather insights from a younger audience, specifically people aged 18 to 30. Each researcher will aim to recruit around 10 to 15 individuals, with a target sample size of 50 to 100 participants in total. This will allow us to have a good representation across various cultural and educational backgrounds and capture a wide range of perspectives. A larger sample size should also help us identify common patterns and insights within the survey responses, allowing us to filter out themes and trends.
Measurements:
To assess young individuals' comfort levels with sharing personal data with large language models, we will collect several quantitative and qualitative measurements. Our primary quantitative measure will involve a Likert scale, where participants will rate their comfort level on a scale of 1 to 5, with 1 representing "not comfortable" and 5 indicating "very comfortable." Statistical analysis will include calculating mean, median, mode, and standard deviation, providing insights into the central tendencies and variability of responses. Analysis of variance (ANOVA) may be used to examine if significant differences exist between different demographic groups or other relevant factors. For qualitative data gathered from open-ended questions, MAXQDA could assist in thematic coding to identify underlying influences on comfort levels. Data visualization will play a crucial role in presenting the findings, with percentages and graphs displaying levels of comfort across categories. Additional measures could include demographic factors such as age, education level, or previous exposure to large language models, as well as specific concerns (e.g., privacy, misuse of data) and trust in data security, to gain a more comprehensive understanding of factors influencing comfort levels.
Research methods:
To conduct the study and to gather the data, we plan to use google forms as an online survey to distribute to several people. The survey will involve structured, closed questions and thus allowing us to gather quantitative data on comfort levels and influencing factors, which will be easier to interpret and evaluate. Additionally, some of the questions will ask participants to explain their thoughts, so a small size of open questions will also be included, to explain and understand the reasoning of the participants. As our research focuses on young individuals, we only need to send the survey to people in this age range, and from there on can infer our interpretations for the population of young individuals. Our observation will be mostly indirect, with direct observation for the open questions to understand the thought process of the participants. To evaluate our results, we will use statistical analysis. In particular, we will gather the data in Excel, and work the Dataset in R Studio to evaluate our results.
Stimuli development:
To conduct our research, we aim to develop stimuli using AI-generated images and scenarios that are relevant to our research question and engaging to the participants. These stimuli include creating lifelike AI-generated people and corresponding scenarios / personas tailored to our study's goals. By generating diverse images and crafting situational narratives around them, we will be able to control the visual and contextual variables while allowing participants to respond naturally and feel more connected to the survey. Creating this realistic environment will allow us to be more sure of the validity of the survey results.
Blog links:
Annalisa Comin:
Matylda Kornacka:
Julita Stokłosa:
Tareq Ahrari: https://meinblog65.wordpress.com
0 notes