Don't wanna be here? Send us removal request.
Text
K Mean Cluster Analysis- Week4
A cluster refers to a collection of data points aggregated together because of certain similarities.
You’ll define a target number k, which refers to the number of centroids you need in the dataset. A centroid is the imaginary or real location representing the center of the cluster.
Every data point is allocated to each of the clusters through reducing the in-cluster sum of squares.
In other words, the K-means algorithm identifies k number of centroids, and then allocates every data point to the nearest cluster, while keeping the centroids as small as possible.
The ‘means’ in the K-means refers to averaging of the data; that is, finding the centroid.
This algorithm is validated using the Cancer diagnosis data set and use this diagnosis to evaluate which explanatory variable has the high possibility to diagnosis cancer
Import all the needed library for this algorithm and create the data frame using pandas by reading the data set in csv format
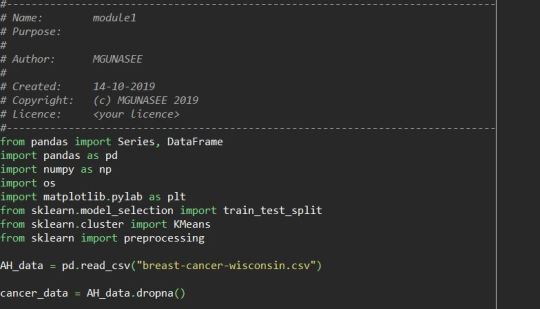
Create the data sets need to be clustered and preprocess the variables to have standard deviation of 1 and mean 0, using the tran_split method create the train and test data sets

To determine the best ‘k value (number of clusters) we can use elbow method where you can range K from 1 to 9 and see the mean of each cluster, the plot will show a decrease in distance when cluster increases, in this we can see 4 cluster dip in the graph, so we can try running the kMeans with 4 clusters and see much intersect with each other


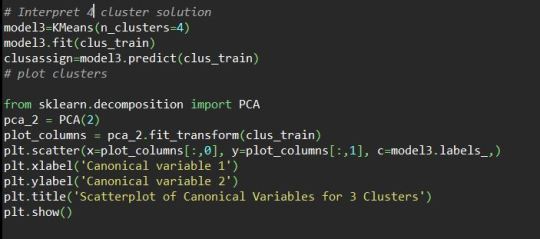
We created the model with 4 cluster, where we have 9 variables and this will show a more data of intersection , so we need to use canonical discriminant analysis to create smaller number variables. PCA function is used from sklearn library to create the canonical variables . The plot will show three cluster purple yellow and blue has a correlation and has more intersected, This gives more clarity to decide three cluster solution can be used for this data set

Next is to see the patter on means for each clustering variables to do this we need to reset the index of the of the train data set and create the new column with index values. Get the cluster index from the model and create the dictionary with index of the train data set and cluster , this dict converted to data frame and merge the this data frame with train data frame, so the cluster will be mapped with each explanatory variable

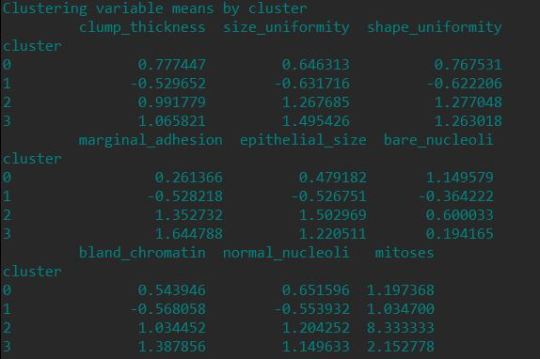
Finally we need to get the means of the each clustering variable for the clusters, this means shows , cluster 1 clump thickness, size uniformity and shape uniformity high, clsuter 2 shows less size uniformity , shape uniformity , clsuter 3 and 4 shows mitoses , size uniformity and shape uniformity high,
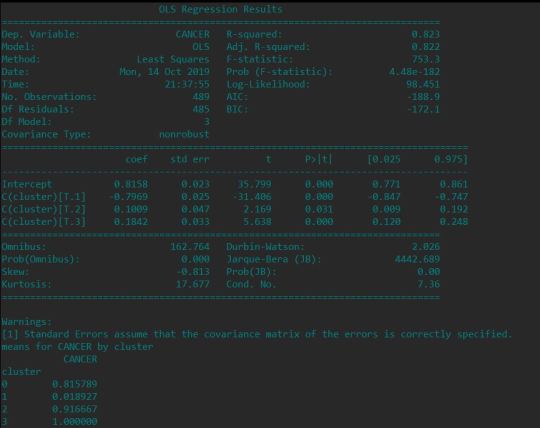
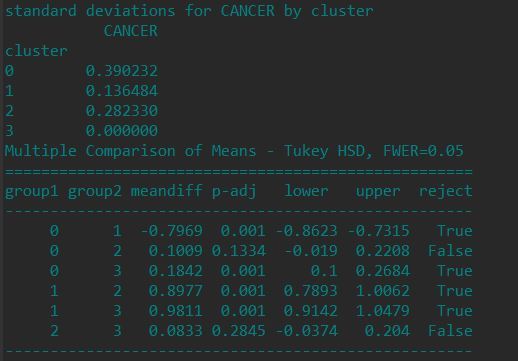
The final report shows the means of cancer diagnosed for each explanatory variable, which help to know how the above mean relates with mean of cancer diagnosis as positive
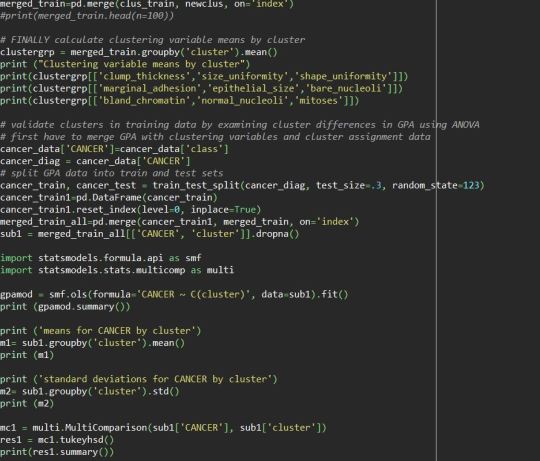
The mean shows cluster 3 and 4 has the high possibility of cancer diagnosis as positive and the data size_uniformity,shape_uniformity and mitoses are high in mean in these two clusters and the difference between cluster 3 and 4 is less
0 notes
Text
Lasso Regression Model/ Week3
Lasso regression is a type of linear regression that uses shrinkage. Shrinkage is where data values are shrunk towards a central point, like the mean. The lasso procedure encourages simple, sparse models (i.e. models with fewer parameters). This particular type of regression is well-suited for models showing high levels of muticollinearity or when you want to automate certain parts of model selection, like variable selection/parameter elimination.
The acronym “LASSO” stands for Least Absolute Shrinkage and Selection Operator.
To get the prediction using the Lasso regression model we used Python to develop and verify the prediction. the data set used to predict the cancer diagnoase. Imported the needed library for the lasso regression model, the data set is read through pandas data frame

The data column type is made to be in float64 to calculate the mean values accurately and the predictor variables and test are created using tran_test_?split method in sk learn library

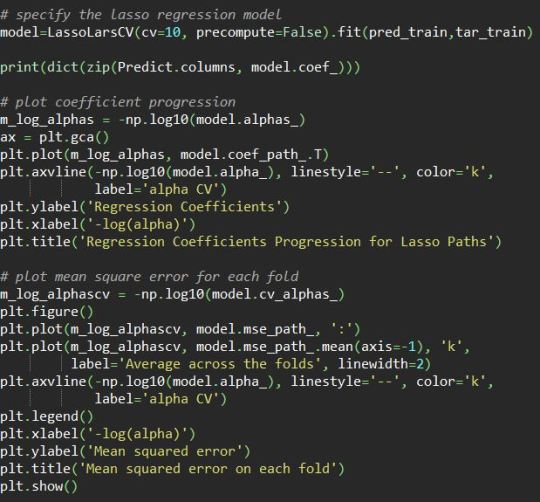
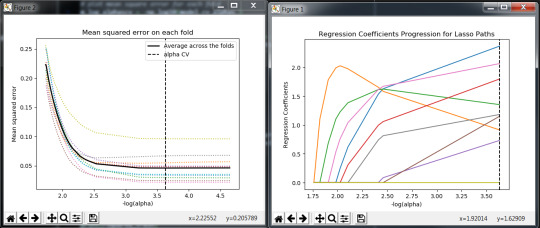
The predictor explanatory variables passed to the lassolarsCV class to create the model . the co efficient of each explanatory variables are listed in dictionary format, in that all the parameter rounded with 0 co-efficient are removed. The alpha log is plotted to get the mean sqaure for each fold and the average. The co-efficient is also plotted
0 notes
Text
Random Forest Classifier
Random forest, like its name implies, consists of a large number of individual decision trees that operate as an ensemble. Each individual tree in the random forest spits out a class prediction and the class with the most votes becomes our model’s prediction
The fundamental concept behind random forest is a simple but powerful one — the wisdom of crowds. In data science speak, the reason that the random forest model works so well is:
A large number of relatively uncorrelated models (trees) operating as a committee will outperform any of the individual constituent models.
The low correlation between models is the key. Just like how investments with low correlations (like stocks and bonds) come together to form a portfolio that is greater than the sum of its parts, uncorrelated models can produce ensemble predictions that are more accurate than any of the individual predictions
As an example we took the cancer prediction data set used in decision tree classifier , to create more trees using The Random Forest Module, we can see how this is implemented
Library needed in python to create the Random Trees using this data set
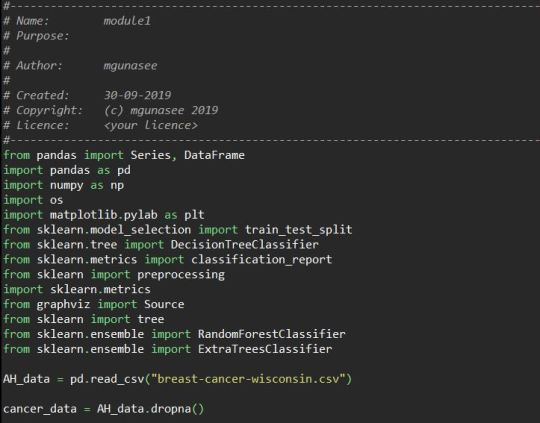
Transformed the Data sets to float dtype from object, since the Sklearn classifier module will not support the object dtype data frames, created the predictors explanatory variables from the data set and created the Traget, with the data values updated as 0(2 is the value in actual data set) for no cancer and 1(4 is the value in actual data set) for cancer diagnosed. The data sets is created with 60% for prediction and 40% for test data set

Random Forest Classifier module gets the predictor data set and target training data set to get the prediction and the extra tree classifier is used to the accuracy level of each explanatory values from the data set

The get the accuracy level of each decision tree created and and plot he accuracy level of each tree created using the random forest classifier, will help to get most accurate prediction from the data set

The Plot of the prediction accuracy of each tree gives a good data almost above 94% of accurate in prediction

0 notes
Photo
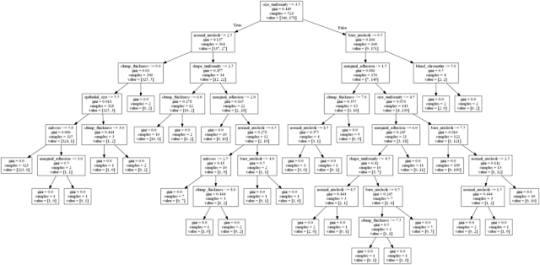
Coursera Assignment for creating a Decision Tree using the Cancer Diagnosis data Sets
Week 1’s assignment for this machine learning for data analytics course delivered by Wesleyan University, Hartford, To build a decision tree to test nonlinear relationships among a series of explanatory variables and a categorical response variable. I decided to choose Cancer Diagnosis data set comprising of boolean to say CANCER Yesor No with 9 explanatory variables representing clump_thickness,size_uniformity,shape_uniformity,marginal_adhesion,epithelial_size,bare_nucleoli,bland_chromatin,normal_nucleoli,mitoses. I also decided to do the assignment in Python as I have been programming in it for over 10 years.
Pandas, sklearn, numpy, and pyscripter were also used in setting everything up.
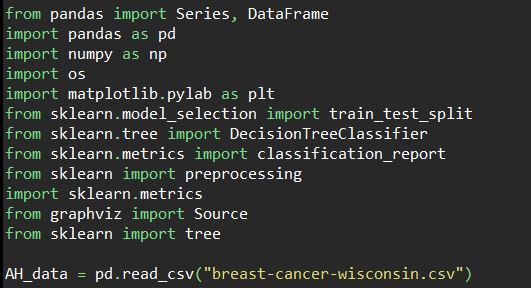
Loaded the necessary libraries to read the csv as a pandas data frame and to classify the target prediction

Transformed the Data sets to float dtype from object, since the Sklearn classifier module will not support the object dtype data frames, created the predictors explanatory variables from the data set and created the Traget, with the data values updated as 0(2 is the value in actual data set) for no cancer and 1(4 is the value in actual data set) for cancer diagnosed.

Using Train_test_split method created the prediction training data and target data to pass in to classifier class from sklearn module to train the model
The model is Trained with data sets and the model is tested with Test data set (pred_test) to get the prediction, the Accuracy of the prediction by the model is verified to be between 90% - 93% consistently

The Decision tree image is created using the tree module from sklean library and Ipython library is used to create the image. the decision Tree created using this software can be seen at the top of this Post
1 note
·
View note