
Don't wanna be here? Send us removal request.
Statistics
We looked inside some of the posts by monday3econlive and here's what we found interesting.
Average Info
Notes Per Post
0
Likes Per Post
0
Reblog Per Post
0
Reply Per Post
0
Time Between Posts
3 hours
Number of Posts By Type
Text
17
Last Seen Tumblr Blogs


Fun Fact
Tumblr has a low social media market share in South America.
Text
Nora Gamini Econ Live Project Monday Discussion 3-3:50 Econ 20A
link to presentation
https://docs.google.com/presentation/d/1zg9GkLaBf_TD4x05qdVzSANLg1b7Pqa1_V8kAm6138o/edit?usp=sharing


0 notes
Text
Ticketmaster, The Master of All Tickets
Thoa Pham
37685344
ECON20A Monday 3PM
Introduction
As a teenage girl with a mediocre social life and an undying academic victim streak, I have to resort to other means to find my happiness–music. Now, I’m sure many people can relate to me in this aspect because music is a component of our lives that we cannot completely get rid of, even if some of us hate it. It allows us to feel, and we know that feeling our emotions is extremely important. Personally, I am a big fan of the K-Pop group, Enhypen, so in order to REALLY feel, I bought their concert tickets, and I knew that my enemy from the start was going to be Ticketmaster, the platform where everything goes down, where people want to rip their hair out to see their favorite artists.
Ticketmaster as a Monopoly
In 2010, Ticketmaster and Live Nation had a merger that was speculated to lower ticket prices and increase the efficiency in the ticketing market. However, not much of these goals that they had in mind were observed in the last 14 years. The platform is known to have terrible service and absurd amounts charged for tickets themselves, and services fees along with that. There have been many lawsuits filed against them for acting like a monopoly and kicking out competition from the market. To be completely clear, Ticketmaster is not the only online ticketing platform, however, due to the fact that their competitors do not perform as well as them, they are allowed to function in a monopolistic model instead.
It has been highlighted that many artists do not have much control over setting the price of their own concert tickets, and it is mostly Ticketmaster’s decision. Serena Elton, a former executive with EMI has stated that “Your choice becomes do a deal with them and do this tour, or don’t and don’t tour”, emphasizing how little control over their agreements the actual artists and their team gets. Rosen, the CEO of Ticketmaster, changed the system so that instead of paying Ticketmaster for using their website, Ticketmaster would pay the venues a portion of the service fees. This allowed them to be the sole provider of concert tickets because the venues were getting paid to use their platform.
As a result, this led to even higher service fees charged towards ticket buyers, so that there was enough profit to divide to venues. Although service fees are at an all time high (as much as ~30% of face value), concert tickets are still in high demand as there are many fans that would pay these fees for the tradeoff of their happiness. Companies like Ticketmaster feed off of this high demand by raising ticket prices without worrying about whether their tickets will be bought or not, and since they are similar to a monopoly, they can set their own prices without much worries. Even as their CEO has stated, he is not worried about the change in demand due to service fees.

lh7-us.googleusercontent.com
The graph above shows that at the level of quantity produced by Ticketmaster, their price should be much lower at P*, rather than at P^m, the monopoly pricing where MC=MR, and the quantity at that point is priced at where it intersects with the Demand curve, D. The profit that Ticketmaster makes is also shown in the graph along with the deadweight loss that consumers lose in the value that they pay for and the producers lose in the benefits that they get.
Dynamic Pricing Strategy
Another aspect of Ticketmaster that is extremely despised by fans of artists is their dynamic pricing. This means that when demands are high, their supply will also be high, increasing the prices of the tickets, especially during the beginning hours of ticket sales, where the website will have traffic jams with people queuing up to purchase tickets.

lh7-us.googleusercontent.com
Resellers
While many fans wait in the queue despite the 8000+ people in front of them, there are many who are not able to grab a ticket for themselves because there are faster “fans” in front of them. These people are most likely just as despised as Ticketmaster, due to the high prices that they resell the tickets at. Most of the time, these tickets sit on the website for a long time, awaiting someone who will purchase them. As time goes on, the prices get lowered and this is why many people will wait until the last minute to make these purchases. Resellers, however, operate by setting their prices higher than the price that they purchased for through a markup by following P > c. However, they do not get to keep the entire difference of their sales as Ticketmaster does take a portion of that profit for themselves.
Conclusion
My friends and I were absolutely shocked to wait in the queue early and enter the ticketing site with almost nosebleed tickets that were priced at $75 dollars each due to the lack of choices that were available. Then as we were checking out three tickets, the total shot up to over $350 dollars. I couldn’t believe what I was witnessing. Because it was my first time buying tickets for a concert, and it was on Ticketmaster, I got to understand the hatred towards Ticketmaster that so many fans from different artists have for it. However, as I am looking at the website right now, there are reselling tickets that go for $300 for the same section that I bought, making me feel very grateful. I think my biggest takeaway from this experience is to save my money next time and simply watch through a laptop screen on Youtube instead.
0 notes
Text


Econ Live
Econ live project
Monday 3pm
BY:
Linda Jiang 14629927
Judy Jing 58588160
Betty Sun 42305298
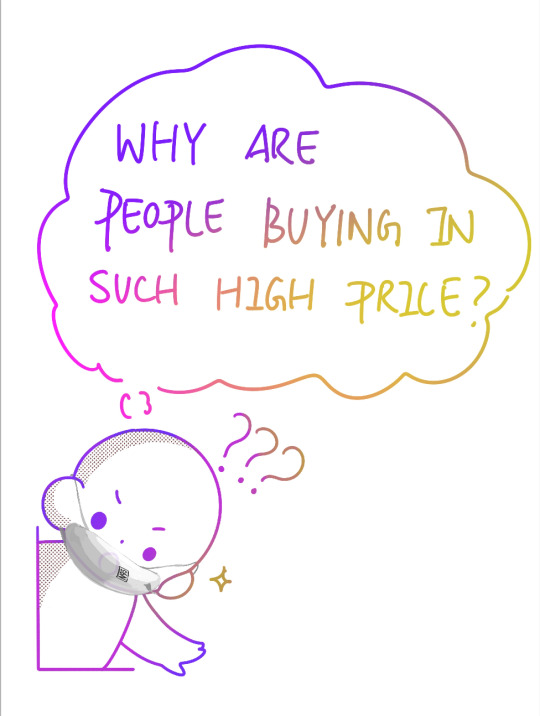
When the pandemic first arrived, people everywhere were caught off guard. I recall the first morning I heard about this, my friends were calling my cell phone and alerting me about this new virus and suggesting that my family stock up on masks. I realized the urgency, so I opened up the Amazon app to order a few boxes of face masks, just in case. What I saw was shocking. Many places were out-of-stock, and where they were available, the prices seemed rather high. It was immediately apparent that the demand for face masks was increasing at an alarming rate, but my friends warned me that I should buy whatever was available because they would only get more expensive if I didn't buy them now. Ignoring the outrageous prices, I decided to place my order. As my friend predicted, the price of the masks got even costlier over the next few days, to what seemed like ridiculously high prices, but sales of the masks kept increasing as was evidenced by the fact that everyone was wearing them. This made me wonder about the underlying logic.
First, there is a gap between demand and supply. When the pandemic first arrived, people were very concerned about catching it, so their demand for facemasks increased rapidly. Then, facemasks became mandatory in most places outside of the home, which caused a massive increase in demand beyond what was already being experienced. Unfortunately, the market was not able to respond to this massive increase in demand, in the very short term, but the demand was reflected in higher prices.
Face masks, in times of a pandemic, are as necessary as water, food, and air, which makes them inelastic. So despite the increase in price, the demand will not decrease.
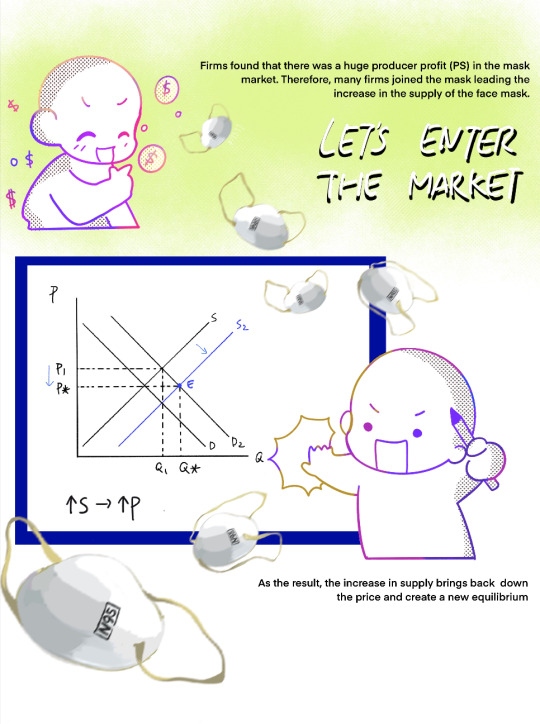
So, how was it that in the longer term, the price of masks was lowered once again? Firms with the capabilities for manufacturing and supplying masks realized that the mask industry was profitable so they entered the marketplace. With the increase in the number of suppliers, the quantity increased and the prices decreased back to their normal equilibrium before the pandemic. This practical application of the concepts of microeconomics in real-life scenarios makes it easy to see that these are not just for textbooks. They are situations that are revealed in our everyday lives.
0 notes


Text
The Resale Revival - Onitsuka Tiger's Limited U.S. Supply
Rex Raffield- 45337014 & Triet Nguyen - 60125259
Introduction:

In November of 2023, the iconic Japanese footwear brand Onitsuka Tiger made a surprising decision to withdraw from the United States market, citing strategic reasons. As official retail channels dried up, this move left countless fans and sneaker enthusiasts scrambling to get their hands on the coveted shoes. Little did they know, that this supply shock would create a thriving resale market governed by the fundamental economic principles of supply and demand.
The Invisible Hand at Work:
As official Onitsuka Tiger sellers in the U.S. disappeared, the demand for their sneakers remained undiminished, if not intensified by their products’ scarcity. This mismatch between the limited supply and the robust demand set the stage for a classic economic scenario, where prices would be dictated by the market's invisible hand.
Third-Party Resellers:

Third-party resellers are a savvy group of individuals who recognize the opportunity presented by this supply-demand imbalance. These resellers scoured the remaining retail channels, online marketplaces, and even international sources to acquire Onitsuka Tiger sneakers, effectively becoming the new suppliers in the U.S. market. Popular third-party sellers include websites like StockX, GOAT, and Grailed.
Price Dynamics: + Scarcity = + Value
With the official retail channels closing in the US, resellers had the freedom to set their prices, influenced by the sneakers' scarcity and the consumers' willingness to pay a premium. Prices skyrocketed, with some models fetching their original retail value several times, demonstrating the fundamental economic principle of scarcity driving up prices.
Demand Drivers: Exclusivity and Nostalgia

A potent combination of exclusivity and nostalgia-fueled the demand for Onitsuka Tiger sneakers. As the brand's presence in the U.S. faded, owning a pair became a symbol of uniqueness and a connection to the brand's rich heritage as a Japanese sports shoe. Sneaker enthusiasts and collectors became willing to pay a premium to own these now-exclusive shoes, further driving up prices in the resale market.
Equilibrium and Market Forces
Over time, the resale market for Onitsuka Tiger sneakers has found an equilibrium, where the supply from resellers matches the demand from eager buyers. However, this equilibrium remained dynamic, with prices fluctuating based on the availability of specific models, changes in consumer preferences, and the entry or exit of resellers in the market.
Conclusion:
The withdrawal of Onitsuka Tiger from the U.S. market serves as a fascinating case study in the interplay of supply, demand, and the role of resellers in shaping market dynamics. What began as a strategic business decision ultimately created a vibrant third-party resale ecosystem, where the laws of economics dictated the prices and availability of these sought-after sneakers. It serves as a reminder that even in the world of consumer goods, economic principles hold, and the invisible hand guides the allocation of resources in unexpected ways.
0 notes
Text
Econ Live: Bookstore Economics
Econ Live Project: Bookstore Economics
By:
Tamilore Odunlami ID: 66216448
Giselle Ferrer ID: 27928097
Here is the link to our presentation:
0 notes
Text
Andrea Aguirre and Nadine Cobourn Econ Live Project
Link to Presentation https://docs.google.com/presentation/d/1RcDagsgUYa74uplhp7mXhbJhD9MnsdL5hibyDWY_qas/edit?usp=sharing


The TV only works if you click onto our google slides presentation link!
0 notes
Text
Econ Live: Supply and Demand
Econ Live: Supply and Demand of baking ingredients during the pandemic
Monday: 3:00 - 3:50
Samantha Yu (26347143)
Solbe Hwang (24733115)
Link to our google slides. https://docs.google.com/presentation/d/1xcTz5wZh7Yo1NGXvv78GCnvA3uKX4lqAhv4Sbdx8-sQ/edit?usp=sharing
0 notes
Text
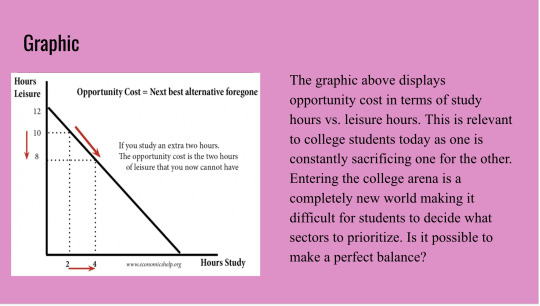
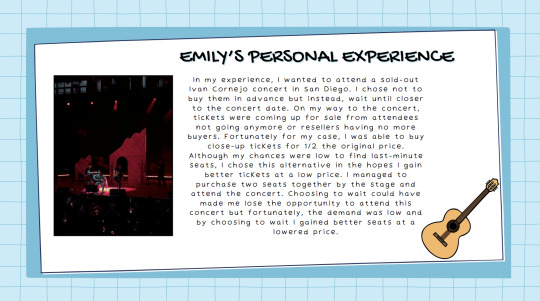
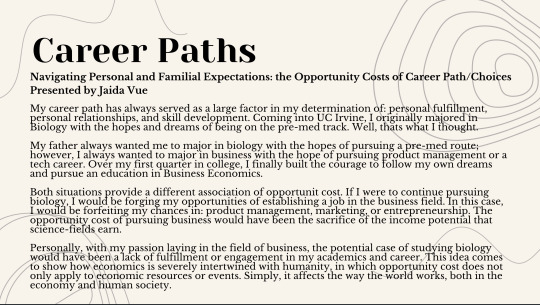
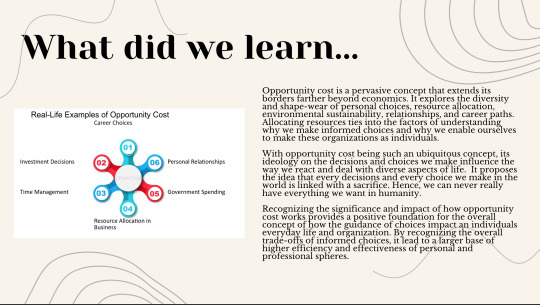
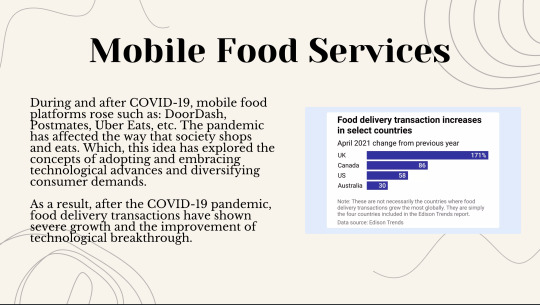
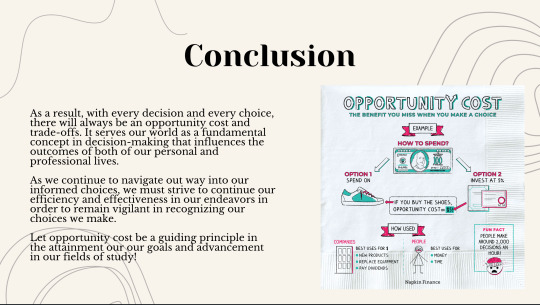
Econ Live: Opportunity Cost
Econ Live Project: Opportunity Cost
Jaida Vue(41995496), Ahtziri Meneses (71706366)
Monday 3-3:50pm
This is the link to our presentation: https://www.canva.com/design/DAF_K2c5cA4/Hjdqo8_iECnLr92xzHoaYg/edit?utm_content=DAF_K2c5cA4&utm_campaign=designshare&utm_medium=link2&utm_source=sharebutton


0 notes
Text
UTC Burger Competition
Monday 3:00-3:50pm
Kaylee Meyers (91694003) Samantha Lee (53828274)


We chose the theme of sandwich/burger businesses in our UC Irvine Campus’ Town Center. The proximity of each of these food destinations allows us, as students, to reflect on each of their advantages and disadvantages.
Moreover, it was important to evaluate the individual strengths of Mendocino Farms, In-N-Out, and Eureka! through the menu. We organized and compared each restaurant by section: health, experience, and convenience. These differing characteristics explain their successful, perfect competition at University Town Center. Perfect competition is the ideal form of market structure, where several firms all produce the same product, and both producers and consumers have full information. Thus, perfect competition is also practiced through online reviews, like ones demonstrated by Donald, Kim, Brittany, and Justin. Full information is exposed and opinions consumed through review apps like Yelp.
In our menu, we analyzed the variables health, experience, and convenience. These variables either negatively or positively affect the utility of each business in UTC. Though utility is just a conceptual number to represent preferences or satisfaction, it helps us illustrate the value in each restaurants’ traits. It is clear that each business has a different advantage over the other two. This is represented on the right side of the menu as, instead of price: U(M/I/E)= positive or negative, allowing us to quantify the different food businesses in UTC (the specific numbers were not deduced from an equation but were randomly assigned based on the relative value of utility).
Our Supply and Demand Graphs illustrate how the general public opinion changes quantity and price of each restaurant. Though it is just one person, it represents the majority of customers because those who read the review are influenced by opinion (demand shift). For instance, Donald’s review shifted demand left by publicizing a negative experience and discouraging others from visiting Mendocino Farms. Thus, as the blue line illustrates, both price and quantity would shift to mirror demand. Alternatively, Justin writes that In-N-Out had a milk shortage because of a “cow pandemic.” So, this reflects a shift in supply that increases prices and lowers quantity. Justin never got his milkshake :( Analyzing these decisions and their shifts on the market opened our eyes to the power of consumer choice. Choosing In-N-Out over Eureka! for a dinner demonstrates the sacrifice of meal experience in return for convenience. This is a prime example of consumer Opportunity Cost, the potential gain or loss from choosing one alternative over another.
0 notes
Text
Econ Live Project
Emilio Sanchez id 79582741
Tracy Pan id 18989251
Monday 3-3:50 Discussion
0 notes
Text
Econ Live Project: The Nvidia Monopoly on Graphic Cards
Justin Le (ID: 75198737)
Discussion: Mondays at 3pm
https://docs.google.com/presentation/d/1CQguKKdskCcpLFkmKeR7eV6-TM68ZKmC0e_mPnIb-NU/edit?usp=sharing
0 notes
Text
Econ Live Project: Market Analysis Report for YSJ Company
Monday 3:00-3:50pm
Group Members:
Ruoxi Wu (44466184)
Xianzhe Wang (80194300)


0 notes
Text
Oligopolies in the Soft Drink Market
Nathan McLaughlin : ID 60824328
The soft drink market is a prime example of an oligopoly market. While there may appear to be a wide variety of companies, most are actually owned by large corporations. As seen below, the market is dominated by three companies, Coca-Cola, Pepsi, and Dr. Pepper, who have control over almost 93% of the market.

The soft drink market is a non-colluding market, as there is no substantial evidence that the three companies work together in order to fix prices. If anything, the firms have intense rivalries between themselves, as they frequently make marketing campaigns displaying how their product is superior to their competitors.
However, even though the firms are non-colluding, this doesn’t mean that they can’t set the same prices. Below are screenshots from Amazon, showing the prices of mini cans from Coca-Cola and min cans from Pepsi.
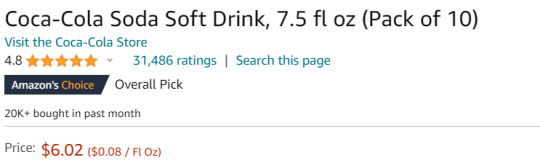

Even though the pack of Pepsi is $5.68 as opposed to Coke’s $6.02, they both charge $0.08 per fluid ounce. Since the firms are non-colluding, this means that one firm must have picked the price of $0.08 per fluid ounce, and the other firms did not wish to start a price war of going lower and lower. Thus, they agreed to take the $0.08 per fluid ounce in order to maximize profits.
However, what would happen if the firms all decided to collude, or if they were broken up by the government?

Above is a profit-maximizing graph, with point A being the monopolist equilibrium, and point B being the perfectly competitive market equilibrium. If the three firms are non-colluding, their equilibrium will be on the demand curve somewhere between points A and B. They would produce more than a monopoly and less than a competitive market, and sell at a price higher than a competitive market and lower than a monopoly.
If the firms wished to increase their profits, they could collude with one another by agreeing to sell at a fixed price. The quantity and price would shift towards point A, the monopolist equilibrium, with the price increasing and the quantity produced decreasing. The market would essentially behave as a monopoly, except for the fact that instead of one firm taking all the profits, it would be split between the three companies.

In order to prevent collusion, there are multiple laws aimed at keeping markets competitive, with major penalties for firms who fail to comply. Thus, the three companies face a tradeoff between staying where they are, or risking punishment in order to increase profits. Ultimately, the firms have chosen not to collude, as the risk of being caught outweighs the chance of increased profits.
Now say that government regulations have allowed for new firms to enter the soft drink market. This would result in the equilibrium shifting towards point B, with increased output and decreased prices. The market would behave more like a perfectly competitive market, getting increasingly closer to the socially optimal level.
The new regulations would benefit consumers, who pay a lower price, and new firms, who could enter the market after being shut out previously. Yet, not everyone would benefit, as Coke, Pepsi, and Dr. Pepper would all have lowered profits. Thus, when making regulations, the government has to think not only about the socially optimal level, but also how existing firms will be impacted.

Conclusion
Overall, the soft drink market is an interesting example of how oligopolies operate without colluding with one another. The market can be used as an example to show what will happen to profits, quantity produced, and the price companies are willing to sell if the market becomes more or less competitive.
0 notes
Text
Econ Live: The Rise & Fall of Stanley Cups
Members:
Hillary Tran (ID: 40025400)
Kaireese Monroy (ID: 76814320)
Link to Video: https://www.tiktok.com/t/ZTLLXnu6T/
0 notes
Text
Econ Live: Economics in Snowboard Rentals! Preferences, Opportunity Costs, and Supply/Demand.
Ryan Goldstein, ID: 38569016, Monday 3:00-3:50
Introduction:
Growing up, I loved the snow and being in the cold weather, yet living in Southern California, we didn't exactly always get that type of weather. In response to this passion, I and my family would often make trips to Big Bear and Mammoth to go snowboarding, but my parents could never bring themselves to actually buy me a snowboard.
This phenomenon brings me to the topic of economics that I would like to focus on, which is snowboard rentals (which unfortunately I am all too familiar with). We will explore my different preferences for renting different board types, the opportunity cost of renting or buying a snowboard, and how supply/demand can change for the snowboard renting market at any time.
Preferences:
Preferences are the choices individuals make based on their likes and dislikes. These preferences influence how people decide to allocate their limited resources, such as money, time, and effort, to satisfy their needs and wants. To be a rational set of preferences, two things need to be satisfied, Transitivity and Completeness. Transitivity is a logical relationship between preferences. It means that if someone prefers option A over option B, and they prefer option B over option C, then they must also prefer option A over option C. Completeness is simply the need for people to make decisions even when faced with a variety of choices.
Example:
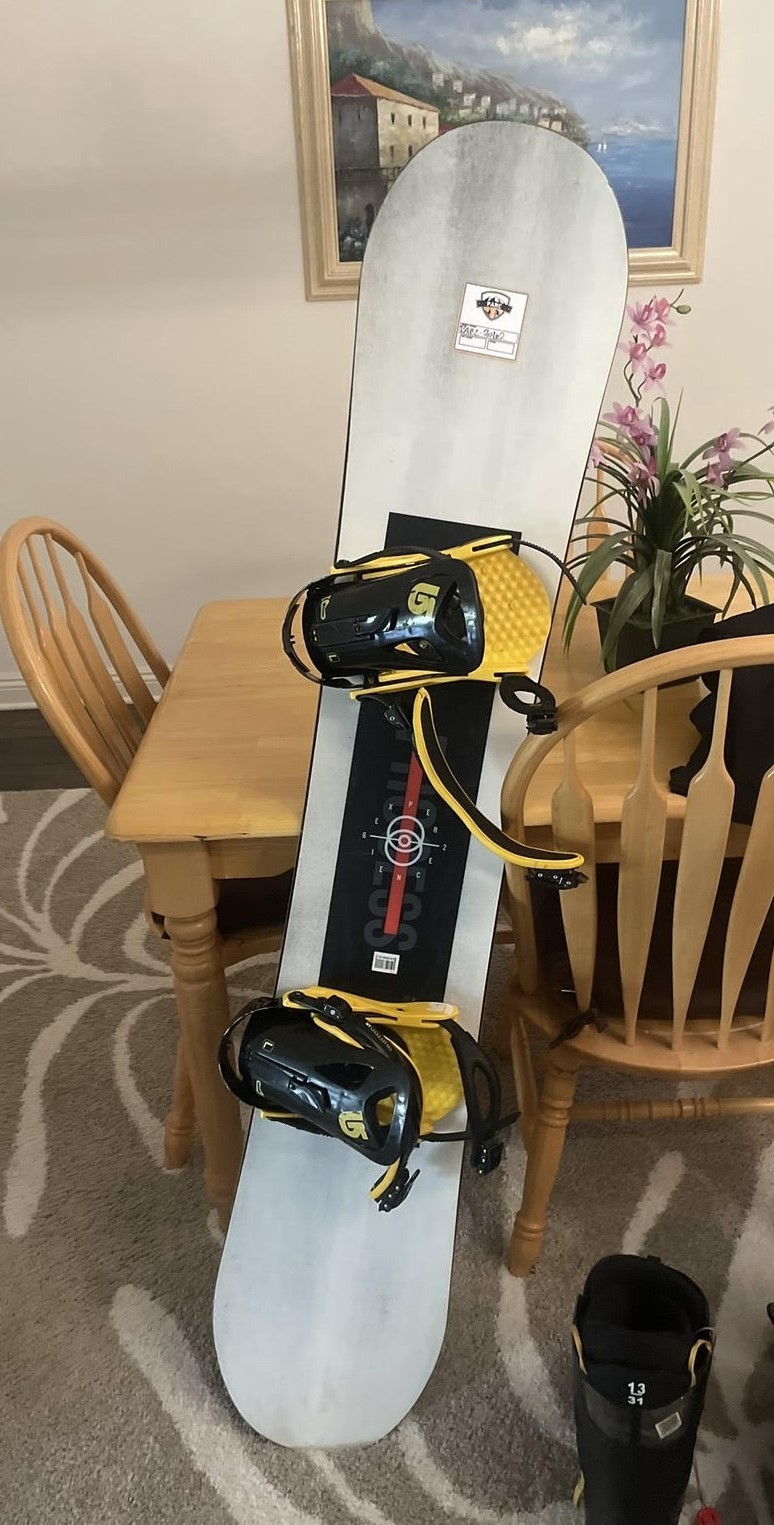
Above is a longer snowboard that I have rented in the past made for higher speeds. All snowboard lengths are extremely important for performance, the longer the board the more stability it has at higher speeds, while the shorter the board the more control it has overall. For our situation, let's use three boards, one with control, another with speed, and the third with a mixture of speed and control.
I prefer Speed>Control, but I don't prefer Control<Mixture, yet at the end of the day I do choose Speed>Mixture.
Let's dive into whether my preferences were rational or not. We can see that they were transitive because I prefer Speed over Mixture and Mixture over control giving us Speed>Mixture>Control. Then, I was able to make complete choices, so we could scratch off completeness making my preferences completely rational!
Opportunity Costs:
Opportunity costs, often referred to as trade-offs are the value of the next best alternative that must be foregone when a choice is made. In simpler terms, it's what you give up when you choose one option over another. Every time a decision is made we are presented with these opportunity costs because there is always an opportunity not chosen, which has a cost...
Example:
Every time that I and my family made the conscious effort time and time again to rent instead of buying a snowboard we incurred an opportunity cost. Let's look exactly into what that trade-off would have been. Renting at Big Bear is approximately $45 every time you rent while buying a snowboard flat out is approximately $300 to receive a snowboard of similar or equal value. Assuming that we have gone once a year for the past eight years, we can estimate that to rent my snowboard over the years we have spent $360. This means that we have $60 of forgone expenses that we could have avoided, which is our opportunity cost. Now my family is $60 and one whole snowboard short!
Supply and Demand:
Supply and Demand are essential parts of any market, especially the snowboard rental market which we are currently looking at. Demand refers to the quantity of a good or service that consumers are willing and able to buy at various prices over a specific period. The law of demand states that all else being equal, as the price of a good or service decreases, the quantity demanded increases, and vice versa. This relationship is often depicted graphically as a downward-sloping demand curve.
Supply refers to the quantity of a good or service that producers are willing and able to offer for sale at various prices over a specific period. The law of supply states that all else being equal, as the price of a good or service increases, the quantity supplied increases, and vice versa. This relationship is typically depicted graphically as an upward-sloping supply curve. They are inversely proportional to each other and can predict how a market will act at any given time!
Example:
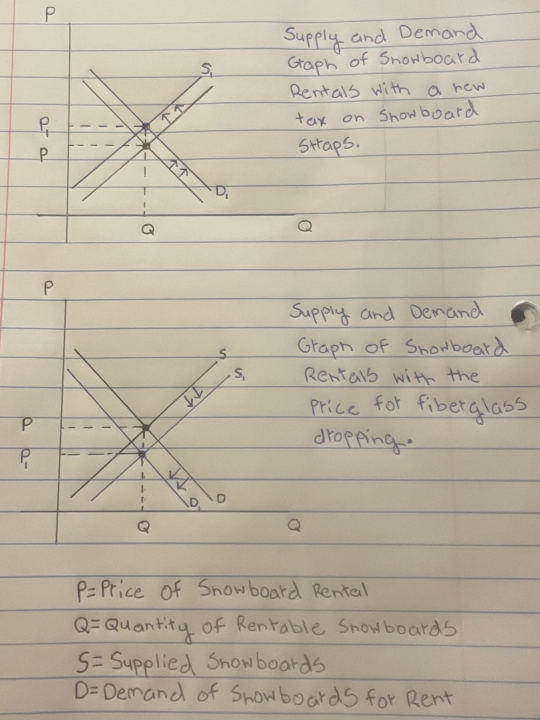
The graphs that can be seen above show us different scenarios that the snowboard rental market could potentially go through. To begin, we can see the first graph has some sort of tax placed on the market. Seeing that it is a tax placed on straps which has to do with production, we now know that production costs are higher which means supply will decrease, resulting in demand increasing since they are proportional. With fewer snowboards to rent and more people wanting them, the price will rise as well, creating a more expensive market for consumers and making it more expensive to rent snowboards. Let's move on to the next graph, we can see that fiberglass, a main ingredient in creating snowboards has become less expensive, which means that the production costs for snowboards have decreased, increasing the supply and decreasing the demand. Now, because there are more snowboards, but fewer people who want to buy them, they need to be sold lowering the price and making it cheaper for consumers to rent snowboards. Now that we have seen how price relates to supply and demand, I wish that the second market had been available to us these past few years!
Conclusion:
Through these examples, we can see how useful economics are in our everyday activities. Looking at the past examples, I have made sure that my preferences for snowboards are correct so I always have an enjoyable snowboarding trip. I could have saved $60 and gained a new snowboard if I had looked at my opportunity costs earlier and bought instead of renting. Lastly, I could have predicted the market by looking at supply/demand and rented/bought at the best times possible!
0 notes
Text
Brianna's Quarter Wrapped in Econ
Brianna Steier
Monday @ 3pm
ID: 14616822
0 notes