
Don't wanna be here? Send us removal request.
Statistics
We looked inside some of the posts by mscdscourseraweek4 and here's what we found interesting.
Average Info
Notes Per Post
0
Likes Per Post
0
Reblog Per Post
0
Reply Per Post
0
Number of Posts By Type
Text
1
Last Seen Tumblr Blogs


Fun Fact
Tumblr Inc. is funded by 13 investors.
Text
Machine Learning for Data Analysis-Week4-Running a K-Means Cluster Analysis:

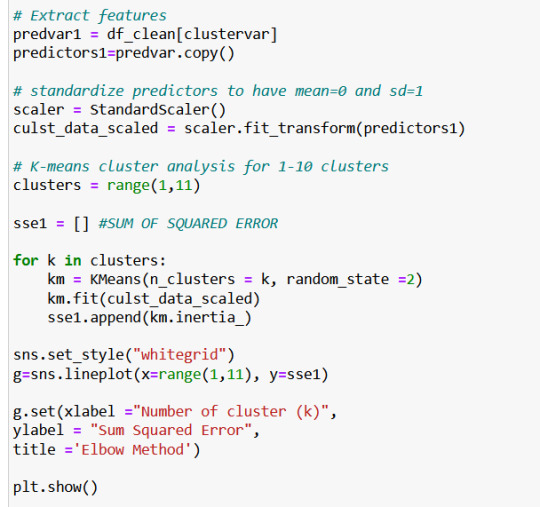
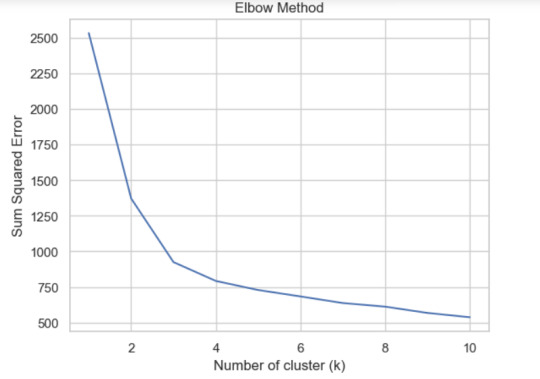


Based on the elbow chart, we see 4 clusters as optimum clusters. We can probably assign these clusters to our dataset and check how the countries are grouped accordingly.This might help understand how the rest of the features are grouped based on these clusters.


Cluster Profiles:Cluster 0: Health Expenditure: Moderate, with an average of $188.46 per capita. Access to Electricity: Fairly low at 70.99%. Sanitation and Water Access: Moderate access to improved sanitation (57.49%) and water sources (87.89%). Fertility Rate: Relatively high at 3.16 births per woman. Mortality Rate (Under 5): Moderate at 46.17 per 1,000. Fixed Broadband Subscriptions: Low at 1.81 per 100 people. Survival to Age 65 (Female): Moderate survival rate at 73.42%. Rural Population: Majority rural with 55.62% of the population. GDP per Capita: Low to moderate at $3,273.65. Life Expectancy: Moderate at 67.71 years. Cluster 1: Health Expenditure: Relatively high, averaging $697.40 per capita. Access to Electricity: Very high at 98.62%. Sanitation and Water Access: High access to improved sanitation (89.54%) and water sources (95.90%). Fertility Rate: Lower at 1.98 births per woman. Mortality Rate (Under 5): Low at 14.50 per 1,000. Fixed Broadband Subscriptions: Moderate at 11.96 per 100 people. Survival to Age 65 (Female): High survival rate at 85.53%. Rural Population: Lower proportion of rural population at 36.55%. GDP per Capita: Higher at $10,972.77. Life Expectancy: Relatively high at 74.68 years. Cluster 2: Health Expenditure: Low, with an average of $79.03 per capita. Access to Electricity: Very low at 28.86%. Sanitation and Water Access: Low access to improved sanitation (28.59%) and water sources (64.85%). Fertility Rate: Very high at 5.12 births per woman. Mortality Rate (Under 5): High at 88.65 per 1,000. Fixed Broadband Subscriptions: Very low at 0.13 per 100 people. Survival to Age 65 (Female): Low survival rate at 57.54%. Rural Population: Higher proportion of rural population at 66.50%. GDP per Capita: Low at $1,708.19. Life Expectancy: Lower at 58.04 years. Cluster 3: Health Expenditure: Very high, averaging $4,843.75 per capita. Access to Electricity: Almost universal at 99.92%. Sanitation and Water Access: Nearly universal access to improved sanitation (98.79%) and water sources (99.69%). Fertility Rate: Low at 1.73 births per woman. Mortality Rate (Under 5): Very low at 4.56 per 1,000. Fixed Broadband Subscriptions: High at 30.32 per 100 people. Survival to Age 65 (Female): Very high survival rate at 91.76%. Rural Population: Very low proportion of rural population at 17.03%. GDP per Capita: Very high at $50,487.41. Life Expectancy: Very high at 81.02 years.
Key Insights:Economic and Social Development: Clusters 1 and 3 represent more economically developed groups with high health expenditure, access to infrastructure, and longer life expectancies. Cluster 3, in particular, represents the highest economic development and best health outcomes. Health and Mortality: Cluster 2, with the lowest economic indicators, exhibits the highest fertility rates and child mortality, along with the lowest life expectancy, indicating a significant need for improvement in healthcare and living conditions. Rural vs. Urban: Clusters 0 and 2 have a higher proportion of rural populations, which correlates with lower access to services and poorer health outcomes, while Clusters 1 and 3 are more urbanized with better access to healthcare and higher life expectancy.


ANOVA Test Summary:
The ANOVA test explored the relationship between the clusters and life expectancy. Here’s what the results indicate:R-squared (0.039): The model explains 3.9% of the variance in life expectancy, indicating that while clusters are statistically significant (p-value = 0.008), they only explain a small portion of the variation in life expectancy. Coefficient (1.639): On average, being in a higher cluster (which typically reflects better socio-economic conditions) is associated with a 1.639-year increase in life expectancy. F-statistic (7.134): This value indicates that the model is statistically significant.
Insights:Health Expenditure & Life Expectancy: There’s a clear positive correlation between health expenditure per capita and life expectancy. Clusters with higher health expenditure (e.g., Cluster 3) have the highest life expectancy. Basic Infrastructure: Access to electricity, sanitation, and water is strongly associated with higher life expectancy. Clusters with better infrastructure (e.g., Clusters 1 and 3) show higher life expectancy. Socio-Economic Indicators: GDP per capita and access to broadband also correlate with better health outcomes and longer life expectancy. Child Mortality: Lower under-5 mortality rates are observed in clusters with higher life expectancy, highlighting the importance of child health in overall life expectancy.
The findings suggest that significant disparities in life expectancy are associated with differences in healthcare expenditure, infrastructure, and socio-economic development. Clusters with better resources and infrastructure consistently exhibit higher life expectancy, reinforcing the critical role of these factors in population health outcomes.

Tukey HSD Test Summary:
The Tukey HSD (Honestly Significant Difference) test was conducted to compare the mean life expectancy between each pair of clusters. The results indicate significant differences between all pairs of clusters, as all p-values are 0.0, and the null hypothesis is rejected for each comparison. Here’s a summary of the findings:Cluster 0 vs. Cluster 1: Mean Difference: 6.97 years. Interpretation: Life expectancy in Cluster 1 is significantly higher than in Cluster 0 by approximately 7 years. Cluster 0 vs. Cluster 2: Mean Difference: -9.67 years. Interpretation: Life expectancy in Cluster 2 is significantly lower than in Cluster 0 by about 9.67 years. Cluster 0 vs. Cluster 3: Mean Difference: 13.31 years. Interpretation: Life expectancy in Cluster 3 is significantly higher than in Cluster 0 by around 13.31 years. Cluster 1 vs. Cluster 2: Mean Difference: -16.65 years. Interpretation: Life expectancy in Cluster 2 is significantly lower than in Cluster 1 by about 16.65 years. Cluster 1 vs. Cluster 3: Mean Difference: 6.33 years. Interpretation: Life expectancy in Cluster 3 is significantly higher than in Cluster 1 by approximately 6.33 years. Cluster 2 vs. Cluster 3: Mean Difference: 22.98 years. Interpretation: Life expectancy in Cluster 3 is significantly higher than in Cluster 2 by about 22.98 years.
Insights:Significant Differences: All pairwise comparisons between the clusters show significant differences in life expectancy, indicating that each cluster represents a distinct group with a unique profile of life expectancy. Cluster 3 Dominance: Cluster 3, which is characterized by high health expenditure, nearly universal access to infrastructure, and a high GDP per capita, has the highest life expectancy. It significantly outperforms all other clusters. Cluster 2 Under performance: Cluster 2, marked by low health expenditure, poor infrastructure, and high fertility and mortality rates, has the lowest life expectancy, significantly trailing all other clusters. Middle Ground: Clusters 0 and 1 fall in between the extremes, with Cluster 1 showing a moderately high life expectancy and Cluster 0 showing moderate to low life expectancy.
This analysis reinforces the earlier findings that socio-economic factors, health expenditure, and access to essential services are crucial determinants of life expectancy. The significant differences between clusters highlight the importance of targeted policy interventions to address the disparities in life expectancy.
0 notes