
Don't wanna be here? Send us removal request.
Statistics
We looked inside some of the posts by omgvincentj50-blog and here's what we found interesting.
Average Info
Notes Per Post
0
Likes Per Post
0
Reblog Per Post
0
Reply Per Post
0
Time Between Posts
19 days
Number of Posts By Type
Text
11
Video
3
Last Seen Tumblr Blogs


Fun Fact
The Tumblr app for Google Glass was released on May 16, 2013.
Text
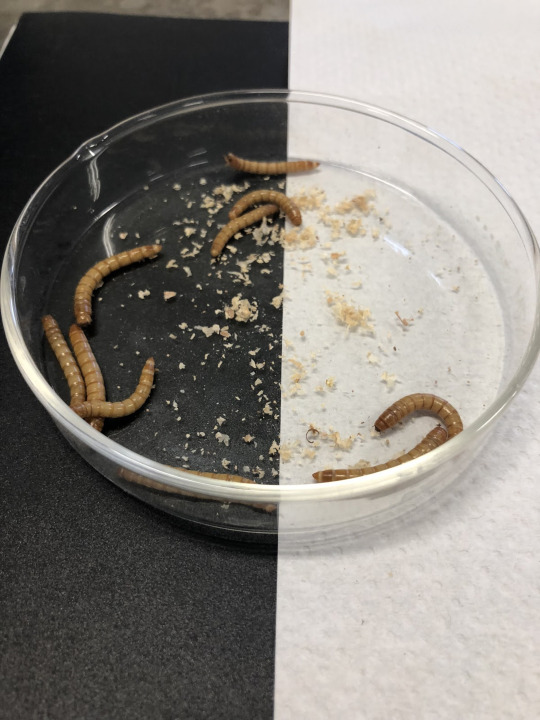
Mealworms
Introduction: So, what are mealworms? I mean, other than being pests, food (Yeah, some Chinese countries use them as food) or disposing of styrofoam. Mealworms eat styrofoam. Wow, I mean they’re kinda like babies who put anything into their mouth, but they can actually digest it. Pretty crazy. Anyway, one (not) surprising fact is that they are actually used in biology experiments! That’s awesome! And, unlike what some people think, yes, mealworms have brains. At least, the ones we tested on do, not the one's last year where Mr. Wong did something bad to their little brains. As such, we decided to test how mealworms make cognitive decisions! To lessen that excitement a bit, we are just reviewing their behavior due to various circumstances, such as light/dark, moisture, and the presence of food. We were supposed to use apple, but for some reason our apple malfunctioned and we had to use Microsoft. Or sugar is a good replacement too.
Materials:
10 Mealworms
Petri dish
Sugar
Whitepaper
Black paper
Timer
Paper towel
Procedure: For the first part of the lab, we placed ten mealworms in the middle of the petri dish and waited for ten minutes just to see what normal mealworm behavior would look like. In the second experiment for this lab, we placed half of the petri dish under a white piece of paper and the other half with a black piece of paper, put the mealworms in the middle, and waited to see which side the mealworms would tend to move to for ten minutes. For the third experiment of this lab, we took out the pieces of paper and placed a damp paper towel on one half of the petri dish and observed the behavior of the mealworms. In the last part of the experiment for this lab, we placed some sugar on the white side of the petri dish to condition the mealworms. Then we waited to see of the mealworms would still go to the white side instead of the black side.
Results:
Part 1 It looks like they are spending more time in one part of the dish all bundled up towards each other

Part 2
1min 3 white
2min 3 white
3min 6 white
4min 3 white
5min 2 white
6min 4 white
7min 2 white
8min 5 white
9min 6 white
10min 4 white
Part 3
1 min 4 wet
2min 5 wet
3min 5 wet
4min 3 wet
5min 3 wet
6min 6 wet
7min 6 wet
8min 5 wet
9min 5 wet
10min 4 wet
Part 6 (conditioning by using the white side to go to sugar)
1 min 5 sugar
2min 6 sugar
3min 7 sugar
4min 7 sugar
(switched to just white side no sugar)
5min 2 white
6min 3 white
7min
8min
9min
10min
Conclusion:
For the general conclusions, we saw that the mealworms spend A LOT of time gathering together. Hey, like humans, they are social creatures too! We’re exactly like mealworms! Oh wait that’s kinda insulting. Anyway, they are very touchy with each other (although obviously not with humans, since the mealworms writhe around when you try to pick them up. Physically, not figuratively).
During the light/dark experiment, the mealworms tended to move more towards the dark side. We suspect this may be because mealworms tend to lay their eggs deeper in the soil so as to not be discovered by predators, who would LOVE a tasty little mealworm egg snack. As such, they tend to shy away from the surface and move towards the dark where it is safer.
In part three the wet/dry fraction really is indeterminate. Sometimes they seem to go towards the wet, but they just retreat after. It’s like determining what moisture is bad for you or not, and they’re always just hovering around the edge. So, therefore, I’d say that moisture has no effect on mealworms.
For the last part, we decided to do some operant conditioning. Namely, give them food and condition them towards one side. So we placed sugar on the white side of the plate (since they seemed to like the black side more in part 2), and put them in the middle and see how it went. However, while they did go towards the white side more, later when we removed the sugar it’s like they completely forgot all about it, and just stayed on the black side. Maybe it’s because we never took the sugar away and they ended up too full to care.
0 notes
Text
Origami Birds
Introduction:
It is important for biologists to find out how traits are passed down from generation to generation. Charles Darwin started this by looking at the different traits on the Galapagos Islands. He looked at how every species adapted to its own environment in order to better survive. In this experiment, we analyzed which traits would allow the origami bird to fly the farthest, and survive to produce the next generation.
Materials:
Paper
tape
straws
scissors
coin
six-sided die
Procedure:
1. Make the bird (2 straws with 2 strips of paper)
a. Shown in picture
2. Bird lays three eggs
. 1st egg has no mutations
a. �� Other two eggs have mutations based on how the coin is flipped and dice is rolled
3. Throw (fly) the birds and measure each distance. Do this twice and find the average of each bird.
4. The farthest is the one who survives to be the parent of the next generation
5. Repeat steps 2-5 for 3 generations and find the best surviving chick.
Results:
Video: https://drive.google.com/open?id=1qYKk0B1AkQYIat5th-R8hnLJ6iFacloK
Analysis: The farthest bird from the fourth generation flew shorter than the farthest bird from the first generation. The dimensions of the resulting bird after the fourth generation is as follows:
Conclusion:
What we could have done better was fly the birds with the same person because they would know the strength to fly each bird making it completely fair. We could have also done this indoors so there is not wind that can interfere. Overall, this was a great lab to discover how traits are passed down based on natural selection and adaptations.
Questions:
3. Did this process result in better flying birds? Explain the ways that this lab models natural selection.
This process did not really result in better flying birds because the first generation had a bird that had a higher average than the last generation. This lab models natural selection because it considers the many factors that exist in nature itself; for example, the wind, or the throwing accuracy/precision. These are all factors that affect the distance that the different birds flew.
4. If you kept repeating this process for thousands of generations, would it inevitably result in “the perfect design” for a “bird” made of paper, tape and a straw? _______ Explain.
Yes it will probably result in a “perfect design” for an origami bird.This is because eventually the generations would adapt to the environment to have the best advantage in flying from island to island. Also, natural selection would kill off the birds that are not as suitable to the environment..
5. Compare the specifications of your most successful bird with others in the class. Were all of the most successful birds identical? Describe differences. Why are they all not identical?
We didn’t really have time to compare our birds with others in the class, but all of our most successful birds were similar. Our birds are not identical because different groups rolled different numbers on their dice or flipped a coin to a different side. Also, the differences would probably be based on how the person flew the bird. For example, a bird who flew smoothly probably glided in the air while a bird who flew pretty hard crash landed somewhere.
6. If each group continued this process for thousands of generations, predict how similar the birds would be to each other.
The birds would be similar because all are striving for the best set of traits. They would probably have smaller front wing but bigger back wing, with a wider width. The wings might also be closer to the middle.
7. Evolution is the result of two processes: variation and selection. . a. How did your experiment produce variation among the offspring? b. How did your experiment select offspring to breed the next generation?
Our experiment produced a variation among the offspring in which the circumference of the front wing was 2 inches less than the back wing for 2nd, 3rd, and 4th generations. Our experiment selected the offspring that flew the farthest to breed the next generation
9. In what way is this lab inaccurate in showing genetic variation? What are other sources of genetic variation?
This lab is inaccurate showing genetic variation because the birds are not actually living in our experiment. There can be other environmental factors such as natural disasters or diseases that kill of a certain trait for the birds. And also the breeding and passing down of traits is not as simple as flipping a coin and rolling a dice.
8. Predict the appearance of your youngest bird’s descendants under the following conditions. a. The selection conditions remain the same and the longest flying bird survives to produce the most offspring. b.The selection conditions change and the worst flying bird survives to produce the most offspring.
a. This bird will probably have a front wing smaller than the back wing and the front wing is a little farther away from the head. Both the widths of the front and back wing will remain the same.
b. This bird will probably have large widths for the wings, wings close to the edges of the straw, and a larger circumference wing for the front wing than the back wing.
0 notes
Text
BLAST
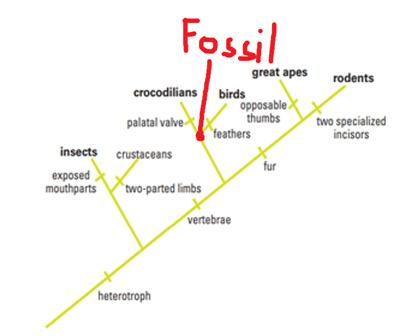
Introduction: For this lab, the purpose was to analyze some biological genes with the help of a website called BLAST. I received four different genes from a newly discovered fossil. And with these genes, I used BLAST in order to determine where on the cladogram (Investigation 3) should be placed. So, what is a cladogram? A cladogram is somewhat similar to a family tree where each of its branches represents a different and specific species and the root of its ancestor. Its similarities between all the species can be seen from the distance of other species. And the closer a certain type of species is to another, the more related they are. For this investigation, I was directed to place the fossil on the cladogram based on its physical attributes.
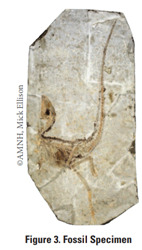
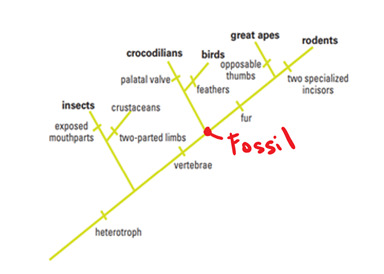
Above, I placed the fossil where I thought the fossil would be. I placed it in this spot because on the physical looks of this fossil specimen. From the picture above, it looked like the fossil had some sort of spine which led me to believe that it was some type of vertebrate. Next, I noticed how small the creature looked and it reminds me of a combination of a lizard and some type of bird. But from there, I could not tell whether or not this fossil had any fur, so I left it where it is.
Procedure: I took the four genes and uploaded them to the BLAST website and just let it do the rest.
Results:
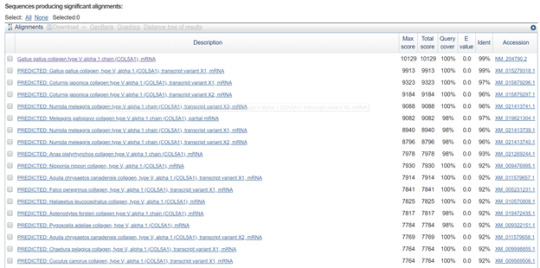
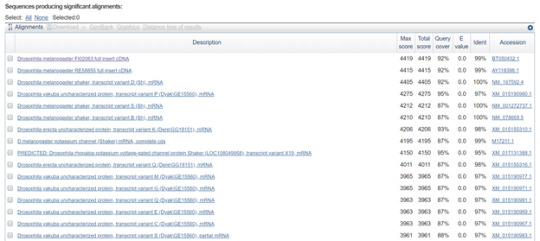
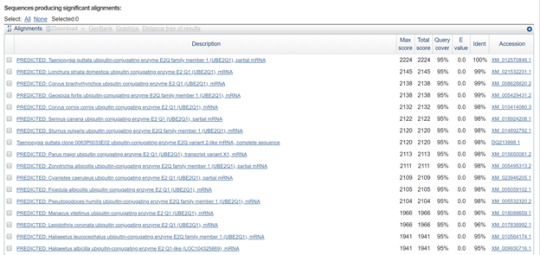
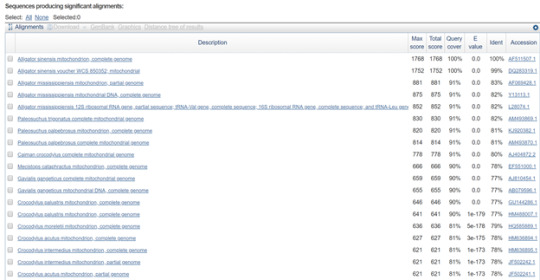
Analysis:
In the first picture, the first two species were some type of bird. The Gallup Gallus Collagen actually is related to the chicken family while the Coturnix Japonica Collagen connects to the quails.
In the second picture, the first few results were called the Drosophila Melanogaster. I then searched up the common name for this and it turned out to be referring to the common fruit fly.
In the third picture, the name Taeniopygia Guttata Ubiquitin actually turned out to be the Zebra Finch, which is another type of bird.
And finally, in the fourth picture, the name Alligator Sinensis mitochondrion is referring to the Chinese Alligator.
Conclusion:
In conclusion, I have learned that most of the genes given were actually related to the Aves, which is the birds. The first gene had a chicken, while the third gene had the zebra finch. But something that caught my eye was the fourth gene, which was the Chinese Alligator. Even though a majority of the genes that were BLASTED related more over to the bird side, I believe that this fossil is not on the side of the birds. Plus, the fact that the last gene was related to a Chinese Alligator leads me to believe this Chinese fossil is moreover to the Crocodilian side. So, on the bottom is my new cladogram of this Chinese fossil.
0 notes
Text
Corn Genetics Lab
file:///C:/Users/Vincent.Jimenez18/Desktop/corn%20genetics%20lab%20activity%20(1).pdf
(Data above^)
Conclusion: In conclusion, we had a good fit between the ear of corn and the data together. But if we had a poor fit, it could have possibly been affected by either wrong calculations or that our original assumption was not correct. Overall, this lab helped my understanding of the chi-square more clear than I anticipated. At first, I believed this to be challenging, but as long as you were organized throughout the lab, you were able to complete this without any troubles.
0 notes
Text
Modeling Hardy Weinberg
Introduction: In this lab, the class learned how to work Microsoft Excel in order to design a program to help understand the biological phenomena that happens in future generations within a certain population. The data that is collected will demonstrate the change in the genetic makeup of populations over a certain amount of generations. The class has the ability to change the gene frequency or any other variable in this lab in order to imitate environmental factors such as natural selection etc. Since we have the ability to change certain variables, we might be able to predict what will happen to populations/generations in the end. I specifically made 4 different spreadsheets: two with populations of 17 with .5 and one with .05/.95 frequency and another with a population of 997 with .5 and the other with .05/.95 frequency. (Both spreadsheets with .05 frequency were the A alleles).
Hypothesis: My hypothesis was that if I completely took out the homozygous AA alleles, I can successfully get rid of the A alleles after the fifth generation.
My other hypothesis is that if I lowered the “p” frequency to .05, I will successfully get rid of the A allele. (See results from the first hypothesis)
Procedure: https://www.youtube.com/watch?v=eDKcq_ND94g&t=609s
Results:
Part 1:
Population 17 Generation 1 (A=7 B=17)
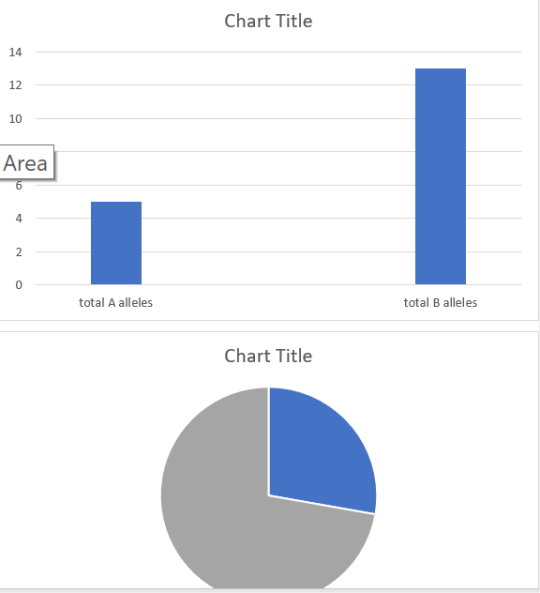
Generation 5 (A=4 B=28)
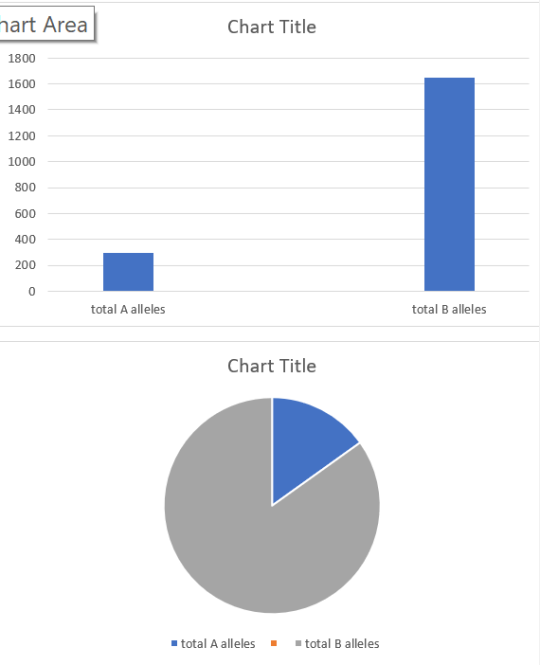
Population 997 Generation 1 (A=506 B=992)
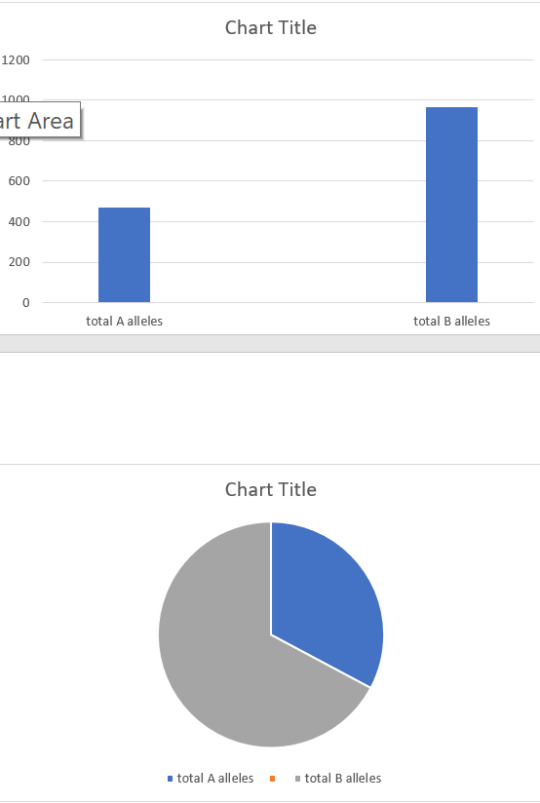
Generation 5 (A=299 B=1615)
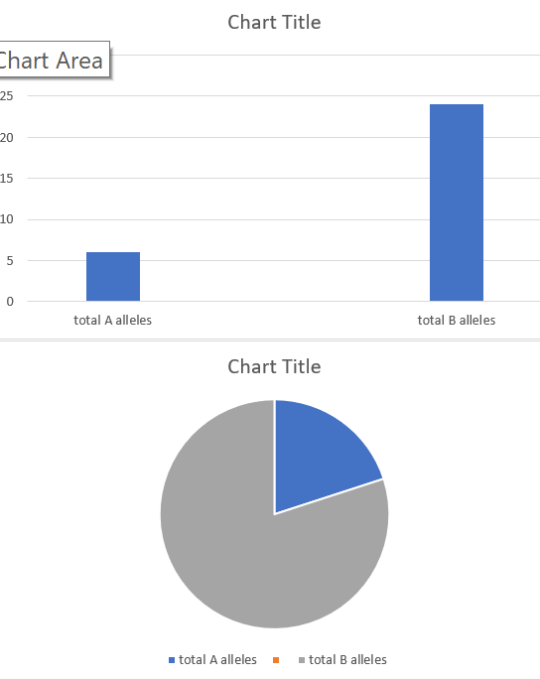
Part 2:
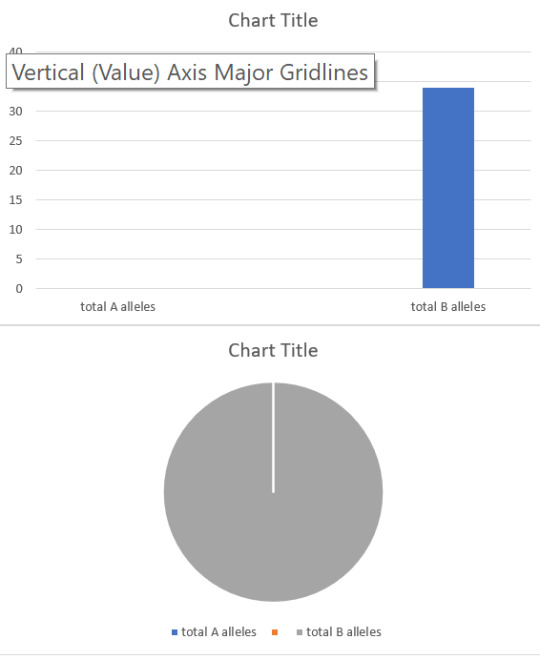
Population 17 Generation 1 (A=3 B=31)
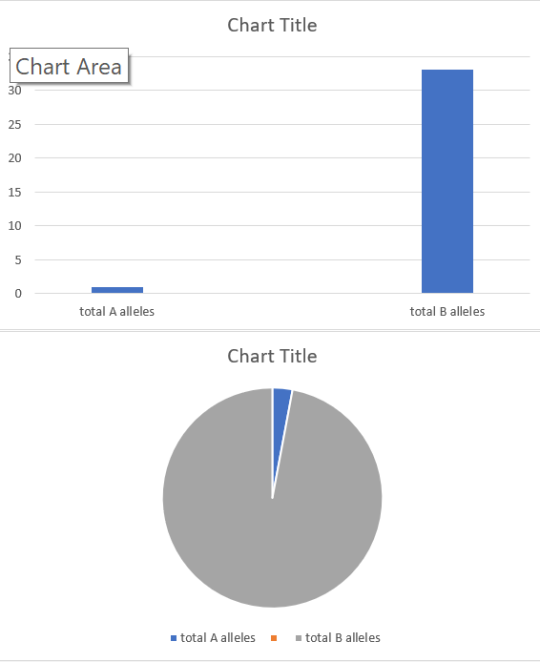
Generation 5 (A=0 B=34)
Population 997 Generation 1 (A=88 B=1902)
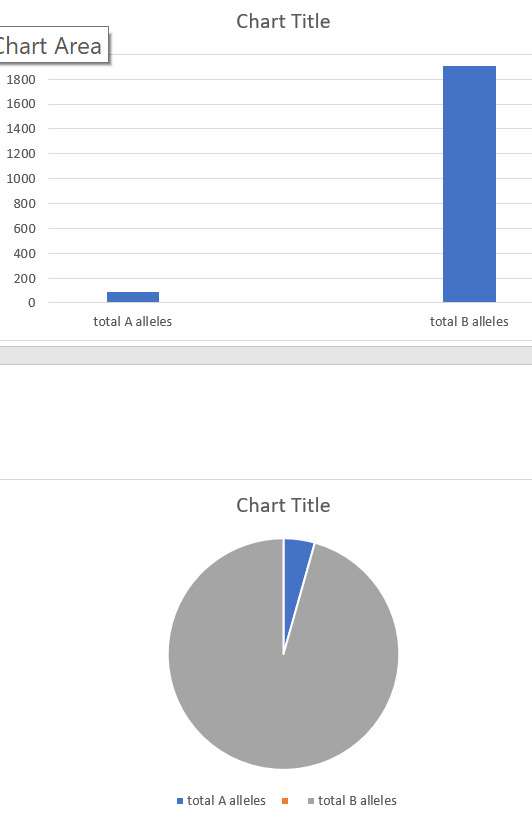
Generation 5 (A=68 B=1920)
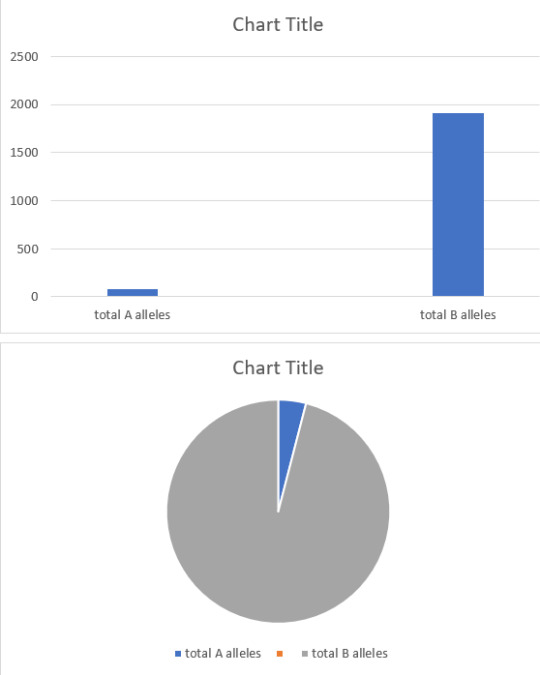
Conclusion: In conclusion, my first hypothesis was wrong. I was not able to successfully get the A alleles to be zero. Although, I did get it several times while I was randomizing the values. But since there was a .5 frequency, there was a higher chance for the A alleles to still be present after several attempts. But for the bigger population, it was different because since there are more organisms, there is a higher chance for A alleles to even exist. So, the conclusion of the first part is that with a higher population, there will be a higher chance of the A alleles existing because there are more organisms thus giving it more chances to survive. For the second part of the population of 17, I was able to get 0 A alleles almost every single time I randomized it. But there was still chances where I received more than 0 alleles. But since the population was so low, the chances of the A alleles surviving are slim compared to the ones if the bigger population. In the bigger population, I was not able to get 0 after the fifth generation, even if the “p” frequency was at .05.
0 notes
Text
Restriction Digestion Lab
Introduction:
DNA splicing lets people take working DNA fragments from chromosomes of certain organisms and combines them to the DNA from other organisms to help study how those genes work. In this lab, our group received some lambda DNA. And with the lambda DNA, we needed to cut this into several fragments using some restriction enzymes and separate and measure the size of the fragments using electrophoresis. Restriction enzymes almost act as the DNA’s defense system. Once viruses inject its DNA into bacteria, the bacteria use restriction enzymes to cut off and kill the invading DNA. This means that our group can use restriction enzymes in the experiment to create DNA fragments. In this lab, our group utilized three different types of enzymes: EcoRI, HindIII, and Pstl.
Procedure:
For Part 1, the first step was to obtain micro test tubes that contained the lambda DNA and the restriction buffer and keep these solutions on ice. Once that was done, our group obtained 4 micro test tubes and labeled them as L (lambda DNA), P (Pstl lambda digest), E (EcoRI lambda digest), and H (HindIII lambda digest). Using a fresh pipet for each reagent, we had to add 4 microliters of DNA and 6 microliters of the buffer into tube L, 4 microliters of DNA, 5 microliters of buffer, and 1 microliter of Pstl into tube P, 4 microliters of DNA, 5 microliters of buffer, and 1 microliter of EcoRI into tube E, and 4 microliters of DNA, 5 microliters of buffer, and 1 microliter of HindIII into tube H. We then had to mix the components by flicking the tube with our fingers and tapping gently on the table to collect any liquid to the tube bottom. After that, we placed the tubes in floating racks and incubated them for 30 minutes at 37 degrees Celsius. After incubation, our teacher, Mr. Wong, placed them in a refrigerator until our next class meeting.
For Part 2, Mr. Wong removed our samples from the refrigerator and then we added 2 microliters of sample loading dye into each of the tubes. Once we did that, we mixed the contents by flicking the tubes with our fingers. Afterwards, we obtained the DNA marker from Mr. Wong. We then filled the electrophoresis chamber and covered the agarose gel with TAE buffer. For the final steps, our group added 10 microliters of each sample into different wells in the gel chamber. We carefully placed the lid on the electrophoresis chamber and connected the electrical leads into the power supply (red to red and black to black). Finally, Mr. Wong turned on the power and ran the gel at 100V for 30 minutes.
Results:
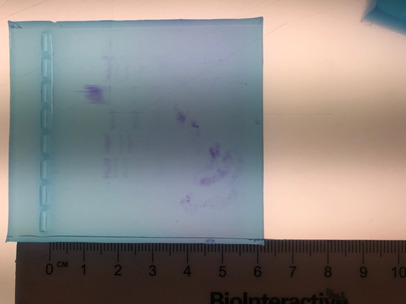
Discussion/Conclusion:
This lab demonstrated that different restriction enzymes are able to cut apart DNA at different restriction sites, which result in DNA fragments of different base pair sizes. Restriction enzymes also vary in the number of DNA fragments, bands in this case, that they create since it usually depends on the number of times the palindromic sequence appears within the DNA. If our group were able to do this lab again, we would make sure we carefully inject the samples into the gel. At one point, we accidentally put too much into one well. I think that the second time around, our results would have been much better since we already know exactly what to do and how to do it.
(below is the pdf of all the questions)
file:///C:/Users/Vincent.Jimenez18/Desktop/restrictiondigest-stu.pdf
0 notes
Text
pGLO Lab
Introduction:
DNA is the genetic code that is placed on a double helix that contains nitrogenous base pairs from a hydrogen bond. These bases are a compilation to an organism’s characteristics. During DNA replication, a helicase enzyme is supposed to open a replication fork, which then unwinds the parental double helix. The leading strand synthesizes in DNA Polymerase III. Primase also begins to synthesize the RNA primer. This lets the DNA Polymerase III add DNA nucleotides to the prier in the replication fork. Then DNA Polymerase I releases the primer and DNA ligase comes and combines the DNA fragments and ends the replication of DNA.
Procedure:
The first thing my group members did was that we labeled two micro test tubes, one +pGLO and the other one -pGLO and placed them into a foam rack. Next, we opened them and used a pipet in order to transfer 250 ul of transformation solution into each of the micro test tubes. Afterwards we placed both of the tubes on ice. We then used a sterile loop to pick up a single colony of bacteria from the starter plate. We placed the colony on the bottom of the micro test tubes and began to spin the loop until the entire colony disappeared. Continuing on, we withdrew a loopful of plasmid DNA from the stock tube. Then we mixed the loopful into the cell suspension of the +pGLO tube. After, we closed both micro tubes and placed them back into the ice tray. Once completed, we incubated the tube on ice for ten minutes. While waiting for the tubes, we labeled four agar plates: +pGLO (LB/amp and LB/amp/ara) and -pGLO (LB/amp and LB). Now time for the heat shock. We carefully took out the foam rack with the tubes in it and quickly placed them into a water bath set to 42 degrees C for exactly 50 seconds. Then, we removed the rack and opened the tubes. We added 250ul of LB broth to the tubes and reclosed it. After, we incubated the tubes for 10 minutes at room temperature. We then tapped the closed tube to mix them. Next, we used a new sterile loop for each of the plates and spread the suspensions evenly around the surface of the agar by skating the flat surface of a new sterile loop back and forth the plate. Finally, we stacked up the plates and taped them together and put it upside down in the 37 degrees C incubator until the following day.
Results:
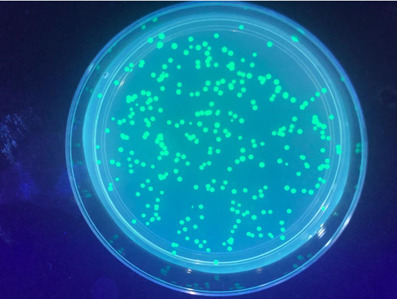
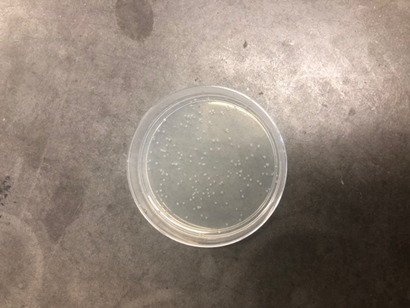
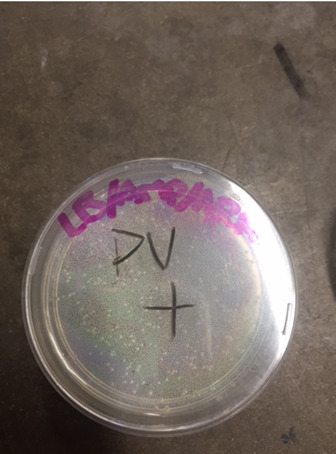
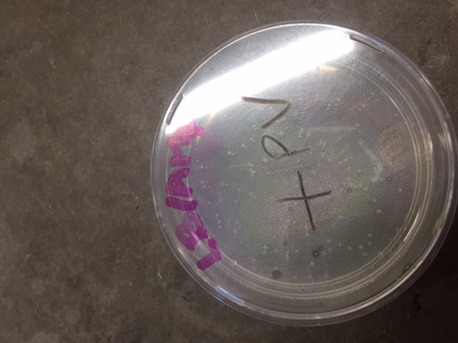
Conclusion:
As we looked at our results, we found out that the if there is an absence of pGLO plasmid, the DNA bacteria, the E. coli was not able to survive because it did not have the ampicillin resistant gene that s in the pGLO. The bacteria colonies were very tiny. They were less than a cm long than the other groups’ colonies. This may could have happened because we didn’t put enough pGLO when we were spreading it on the plates. Another reason could be that we could have picked up more than one colony thus affected the multiplying rate and the rate for the bacteria to grow.
pGLO Lab questions:
1. To genetically transform an entire organism, you must insert the new gene into every cell in the organism. Which organism is better suited for total genetic transformation— one composed of many cells, or one composed of a single cell?
The single-celled organism would be the recipient for a genetic transformation. It would contain one cell which needs to take up a new gene.
2. Scientists often want to know if the genetically transformed organism can pass its new traits on to its offspring and future generations. To get this information, which would be a better candidate for your investigation, an organism in which each new generation develops and reproduces quickly, or one which does this more slowly?
The best organism would be an organism that reproduces quickly. The fast production of the offspring will allow you to assess if the trait was passed on.
3. Safety is another important consideration in choosing an experimental organism. What traits or characteristics should the organism have (or not have) to be sure it will not harm you or the environment?
The organism shouldn’t make any toxin or compounds which could make any person sick. The organism should grow within the lab environment but should not be able to withstand the conditions outside of the laboratory. It should also not infect any plants or animals.
4. Based on the above considerations, which would be the best choice for a genetic transformation: a bacterium, earthworm, fish, or mouse? Describe your reasoning.
The bacterium is the best host organism. Because the bacteria are small and single-celled, they can reproduce easily and quickly.
5. Describe how you could use two LB/agar plates, some E. coli and some ampicillin to determine how E. coli cells are affected by ampicillin.
Equal amounts of the cells could be placed on two different LB nutrient agar plates. One that contains just the LB nutrient agar and the other that contains LB nutrient agar ampicillin. If the ampicillin affects the growth of E. coli negatively, then there should be less colonies of bacteria on the plate. If the ampicillin has no effect, then it should be equal numbers of colonies on both of the plates.
6. What would you expect your experimental results to indicate about the effect of ampicillin on the E. coli cells?
Antibiotics would kill bacteria or inhibit their growth. That means there should be fewer bacterial colonies on the ampicillin plate. Any sign of colonies on the plate would suggest that those bacteria are resistant to the antibiotic ampicillin.
7. On which of the plates would you expect to find bacteria most like the original non-transformed E. coli colonies you initially observed? Explain your predictions
Bacteria which would resemble the non-transformed are found on the LB(-) plate. The bacteria were taken out from the starter plate, and they did not have plasmid added to them, which were then replaced on an LB plate. So they are identical to the non-transformed starter.
8. If there are any genetically transformed bacterial cells, on which plate(s) would they most likely be located? Explain your predictions.
The transformed cells are seen on the LB/amp and the LB/amp/ara plates. The genetically transformed cells have taken the pGLO plasmid which show the ampicillin resistance gene. These cells can survive on plates which have the ampicillin.
9. Which plates should be compared to determine if any genetic transformation has occurred? Why?
The LB/amp(-) and LB/amp(+) pGLO plates should be compared together. Cells that were not treated with DNA shouldn’t show ampicillin resistance and will not grow on the LB/amp plates. Cells that are treated with DNA should contain the pGLO plasmid and show ampicillin resistance gene.
10. What is meant by a control plate? What purpose does a control serve?
The control plate is a guide that helps interpret the results of an experiment. In this lab, the -pGLO plates are the controls. The LB/amp plate can be compared to LB/amp+ plate. If there were no control plates, you could not tell if there were really any transformations.
11. Which of the traits that you originally observed for E. coli did not seem to become altered? In the space below list these untransformed traits and how you arrived at this analysis for each trait listed.
Bacteria are whitish on color. The colony size is similar in the before and after transformations.
12. Of the E. coli traits you originally noted, which seem now to be significantly different after performing the transformation procedure? List those traits below and describe the changes that you observed.
The colonies on LB/amp/ara are green under the UV lights. The colonies that transformed can grow on ampicillin resistance.
13. If the genetically transformed cells have acquired the ability to live in the presence of the antibiotic ampicillin, then what might be inferred about the other genes on the plasmid that you used in your transformation procedure?
The plasmid should express a gene for ampicillin resistance.
14. From the results that you obtained, how could you prove that the changes that occurred were due to the procedure that you performed?
The best way is to compare the control to the experimental ones.
15. Recall what you observed when you shined the UV light onto a sample of original pGLO plasmid DNA and describe your observations.
The plasmid did not fluoresce.
16. Which of the two possible sources of the fluorescence can now be eliminated?
The pGLO plasmid DNA can be eliminated as well as the original bacteria from the fluorescent source.
17. What does this observation indicate about the source of the fluorescence?
The source is most likely from a protein that the plasmid encodes.
18. Describe the evidence that indicates whether your attempt at performing a genetic transformation was successful or not successful.
A successful experiment would be by the presence of the colonies on the (+) plates and the absence of colonies on the (-) plates.
19. From your results, can you tell if these bacteria are ampicillin resistant by looking at them on the LB plate? Explain your answer.
No because you can not tell just from looking at it. Both of them look similar to each other.
20. How would you change the bacteria’s environment—the plate they are growing on—to best tell if they are ampicillin resistant?
The best way would be to take some bacteria on the LB plate and to put it on the LB/amp plate.
0 notes
Text
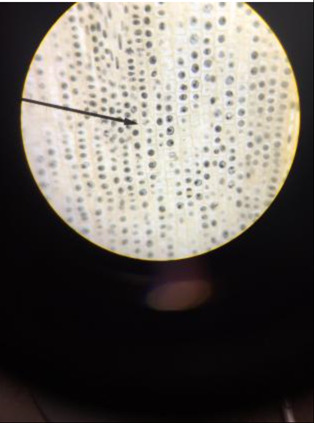
Investigation 7
In this lab, we had to count the number of cells that are in mitosis with the use of a microscope. Mr. Wong had already prepared the onion root tips. The way the lab was set up was that we used a microscope and set it to the highest/closest magnification. From there, we just examined the onion root tips. Once capturing the pictures, we had to count the number of cells within the stages of interphase or within the stage of mitosis. The way my group differentiated the two phases was by comparing the shape and the alignment of the chromosomes within the cells.
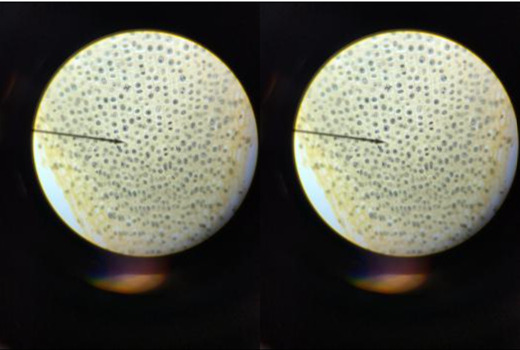
This picture is from the control cell group (the ones not affected by lectin)
In this picture, this is the treated cell
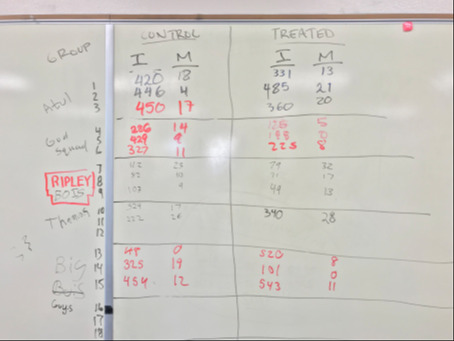
This picture represents other groups’ data from their onion root tips
This was what our group collected:
Control 1:
Interphase: 329
Mitosis: 17
Control 2:
Interphase: 222
Mitosis: 26
Treated 1:
Interphase: 340
Mitosis: 28
Although our group did not write down the rest of our data, our data was similar to the other groups. For our first control group, we counted 329 in interphase and 17 in mitosis. In our second control group, we counted 222 in interphase and 26 in mitosis. And for our last one that was written down, we counted 340 in interphase and 28 in mitosis. Overall, there were more cells in interphase rather than mitosis.

By adding the values, the chi-squared number is .0428. And because this number is low, this shows that there is not that much of a difference between the number of cells in the mitosis stage and the interphase stage in the treated and controlled cells. These numbers were calculated from the classes’ data collected.
0 notes
Text
Investigation 4
Procedure 1: Surface Area and Cell Size
In the first part of the lab, we used artificial cells to observe the relationship of the surface area to the volume. We used 2% of agar which contained NaOH and a pH-indicator dye phenolphthalein, 1% phenolphthalein solution, .1 M of HCl, .1 M of NaOH, scalpel, ruler, Petri dishes, 3 beakers, 2% agar with phenolphthalein that was prepared beforehand. Our group predicted that the smallest cube would clear up the fastest. The first step was to prepare blocks of gelatin with phenolphthalein and 0.1M HCl. We picked three blocks and cut them into cubes with the scalpel, one 2 by 2 by 2, one 1 by 1 by 1, and another 0.5 by 0.5 by 0.5 (in centimeters). The surface areas of these cubes were 24 cm^2, 6 cm^2, and 1.5 cm^2. Their volumes were 8 cm^3, 1 cm^3, and 0.125 cm^3. We took a time lapse of the process of these purple blocks becoming clear.
https://omgvincentj50.tumblr.com/post/166866839961
The smallest cube did, in fact, become the clearest the fastest which showed that osmosis and diffusion happened the fastest in cells with a small surface area.
Procedure 2: Modeling diffusion and Osmosis
The materials that were used in this part were distilled water, 1 M of sucrose, 1 M of NaCl, a 20 cm long tube, 4 beakers, and a balancer.
The initial tube started with 12 grams and finally went up by 1 gram making it 13 grams. Then we used NaCl inside the tube and placed it in the water. The tube weighed 13 grams and finally went to 16 grams. The water tends to flow from an area of high concentration to a lower concentration. For the third part, we filled the tube with sucrose and put it into the water. It started off weighing 12.5 grams and went up to 14 grams. And for the last part of the experiment, we filled a tube with a sucrose solution an placed it in a NaCl solution. Initially, it was 13.5 grams and at the end, it weighed 12.5 grams. Perhaps there was a low concentration of water in the NaCl solution than the sucrose solution.
Procedure 3: Observing Osmosis in Living Cells
In the final procedure, we observed cells going from hypotonic to hypertonic. We saw the live Elodea leaf cells react to the salt water and the distilled water underneath the microscope. We placed the leaf onto a glass slide and dropped water into it. After we closed the slide, we dripped 1 M of NaCl solution on one side while sucking it back up with a paper towel.
https://omgvincentj50.tumblr.com/post/166866867370
After the lab, I learned how size and one’s surface relate to osmosis and diffusion and how osmosis and diffusion happen in living cells. I thought this lab was pretty cool how small things can have a huge change in their physical appearance.
��;�L�
0 notes
Text
Bio AP Summer Reading Chapter 3
Campbell Biology 9th Edition
Chapter 3: Water and Life
After reading through this chapter, there are certain things that I have forgotten from my Biology and Chemistry classes. This chapter was a good refresher and it helped me remember some of the information that I had forgotten from my previous science classes. In section 3.1, it was a definite refresher when I saw the diagram of the hydrogen bonds between the water molecules. In section 3.2, what I found compelling was right in the beginning when the book showed the example of cohesion in plants, this case the tree. I was amazed how cohesion was able to hold together the water column within the cells as it resists the force of gravity. And I forgot about Aqueous Solutions, so that was also another refresher in this chapter. In the final section, 3.3, it was thought-provoking to see the pH scale and all the different values of several everyday items we see.
Evolution Connection: Why would astrobiologists be interested in studying extremophiles? What does the existence of life in such extreme environments say about the possibility of life on other planets?
Astrobiologist would be interested in studying and examining these extremophiles because of its living capabilities. These extremophiles can live in extreme conditions, hence the name. This means that due to their extreme living conditions, there could possibly be extremophiles living on different planets. This can open lots of possibilities of these organisms living all around our solar system.
0 notes
Text
Bio AP Summer Reading
After reading Neil Shubin’s Your Inner Fish, I have definitely learned a lot about how each and every one of us is secretly related to our fish ancestors. I remember sometime in middle school, I heard that we humans were related to fish, but I never had any interest in finding out what connects us those water breathing creatures. It was not until I chose this book that I finally found my fascination in learning about our “inner fish.” I would recommend this book to anyone who is interested in learning about us and our fish ancestors. Out of the eleven chapters in this book, these are two chapters that I found the most interesting.
Chapter 2: Getting a Grip
In this chapter, Shubin explains that he was not bothered by the dissection of a person until he began to work on the hand. The hands are one of the most characteristic and composite parts of the human body. Shubin mentions Sir Richard Owen, one of the most famous anatomists. Owen organized thousands of specimens and noticed a pattern. He noticed that nearly all the animals with limbs had the same bone structure. Owen observed that one bone connected two bones, and lots of small bones followed, and eventually the finger and toes came last. Charles Darwin took these similarities and proposed that animals with limbs shared a mutual ancestor from which they inherited their limbs from, which was the fish fins. Although fins look totally different from limbs, the Eusthenopteron has one bone connecting two bones within the fin. Another example of fish having similar limb structures is from the fish Ichthyostega soderberghi. This fish had a neck and back that looked like a land animal’s, and also had completely developed fingers and toes on the fin-limbs.
Chapter 4: Teeth Everywhere
In the beginning of this chapter, Shubin says, “Much of the story of mammals is the story of new ways of processing food.” Shubin defines a group of prehistoric mammal-like animals called trithelodonts. He also explains that humans and other mammals have specialized teeth: the incisors are used for cutting, canines for holding, and the molars are used for grinding. The order of carnivores are distinguished from four teeth called carnassials, and if someone has these, then they are a member of the carnivore family. Shubin then transitions into the earliest teeth in fossil records, which come from Conodonts. These were the first fossils to have teeth. They were used to bury into the fish and suck its blood. From specialized teeth and bones, they all originated from the teeth. Teeth began to develop due to an organism’s modifying structures. Teeth are created by two layers of folding tissue with the outer layer becoming the enamel, and the inner becoming the pulp of the tooth. This type of process is utilized in the development of any body structure that forms in the skin, scales, fur, hair, or feathers. Shubin concludes by saying that once the teeth developed, animals would reuse the “teeth creating system” to make other body parts.
0 notes