
Don't wanna be here? Send us removal request.
Statistics
We looked inside some of the posts by patinocoursera and here's what we found interesting.
Average Info
Notes Per Post
0
Likes Per Post
0
Reblog Per Post
0
Reply Per Post
0
Time Between Posts
2 months
Number of Posts By Type
Text
5
Last Seen Tumblr Blogs


Fun Fact
Users from the US are the majority of Tumblr visitors.
Text
Mars craters analysis of variance
First we prepare our environment
import pandas as pd import matplotlib.pyplot as plt import statsmodels.formula.api as smf import statsmodels.stats.multicomp as multi # Read the file data = pd.read_csv('marscrater_pds.csv', delimiter=",") #subset data to craters with depth and number of layers > 0 and diameter smaller than 30km sub1=data[(data['DEPTH_RIMFLOOR_TOPOG]>0 &(data['DIAM_CIRCLE_IMAGE']<=30) & (data['NUMBER_LAYERS']>0)]
Since the number of layers of a crater is discrete, we can define it as an explanatory variable to answer some questions. For example: is there a relationship between the number of layers and the depth?
# using ols function for calculating the F-statistic and associated p value model1 = smf.ols(formula='DEPTH_RIMFLOOR_TOPOG \~ C(NUMBER_LAYERS)', data=sub1) results1 = model1.fit() print (results1.summary())
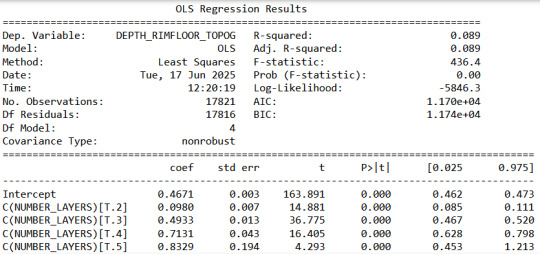
We can see a high F number and a very low p, so we can assume that at least two layer groups have different mean depths.
sub3 = sub1[['NUMBER_LAYERS', 'DEPTH_RIMFLOOR_TOPOG']].dropna() print ('means for depth by layer number') m2= sub3.groupby('NUMBER_LAYERS').mean() print (m2) print ('standard deviations for depth by layer number') sd2 = sub3.groupby('NUMBER_LAYERS').std() print (sd2)

It seems like deeper craters are most likely to have more layers but are there layers that cannot be differentiated based on its depth?
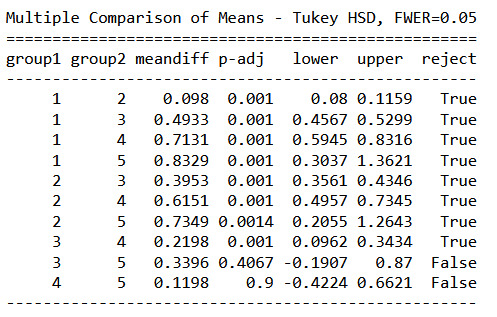
mc1 = multi.MultiComparison(sub1['DEPTH_RIMFLOOR_TOPOG'], sub1['NUMBER_LAYERS']) res1 = mc1.tukeyhsd() print(res1.summary())

The Turkey post hoc comparisons show that indeed craters with 1 to 4 layers have different mean depths.
5-layered craters have different mean depths in comparison with 1- and 2-layered craters only. So there is no significant difference between 5-layered crater and craters with 3 or 4 layers.
Layers vs Diameter
We can repeat this using the crater diameter as our response variable.
# using ols function for calculating the F-statistic and associated p value model2 = smf.ols(formula='DIAM_CIRCLE_IMAGE ~ C(NUMBER_LAYERS)', data=sub1) results2 = model2.fit() print (results2.summary())

Repeating this with the crater diameter shows that the wider craters are most likely to have more layers as well.
mc2 = multi.MultiComparison(sub1['DIAM_CIRCLE_IMAGE'], sub1['NUMBER_LAYERS']) res2 = mc2.tukeyhsd() print(res1.summary())
Here we see a similar pattern than with the crater depth. 5 Layer craters have similar mean depths that 3 and 4 layered ones, so it cannot be said that 5 layered craters are necessarily wider than 3 or 4 layered craters, but certainly wider than 1 or 2 layered ones.
0 notes
Text
Creating Graphs to study mars craters
The amount of craters studied until now is still too high, so I'll limit the following steps to the craters with more than 1km in depth, to concentrate on major impact events.
A histogram of the latitude gives us some information about the concentration of these events in specific areas.

I'd like to see in some sort of simplified map the location and depth of the craters selected by my criteria, so I thought about using a heatmap. This requires some rearranging of the data table with a pivot.

The heatmap did not turn out as useful as I thought but it shows that there are indeed some agglomeration of craters with similar characteristics. Using KMeans I'll try to recognize if we can group them into possible events.


After some trial and error I found that probably about 9 events could be responsible for the deepest/largest craters in mars. We can confirm this with an elbow diagram.

There seems to be an inflexion at 9. The scatterplot also shows that this would be a good approximation. Maybe there were 9 major impact events that helped form the mars surface as we know it today?
0 notes
Text
Variable Data Management
Based on the observations from the previous post we can code the missing data for crater depth and number of layers.
sub2 = sub1.copy() # recode missing values to python missing (NaN) sub2['DEPTH_RIMFLOOR_TOPOG']=sub2['DEPTH_RIMFLOOR_TOPOG'].replace(0, numpy.nan) sub2['NUMBER_LAYERS']=sub2['NUMBER_LAYERS'].replace(0, numpy.nan) print ('counts for DEPTH_RIMFLOOR_TOPOG with 0 set to NAN and number of missing requested') c4 = sub2['DEPTH_RIMFLOOR_TOPOG'].value_counts(sort=False, dropna=False) print(c4) print ('counts for NUMBER_LAYERS with 0 set to NAN and number of missing requested') c5 = sub2['NUMBER_LAYERS'].value_counts(sort=False, dropna=False) print(c5) counts for DEPTH_RIMFLOOR_TOPOG with 0 set to NAN and number of missing requested NaN 57269 0.50 524 1.00 78 1.26 23 0.38 737 ... 0.33 749 1.21 23 1.16 46 0.41 651 2.07 1 Name: DEPTH_RIMFLOOR_TOPOG, Length: 182, dtype: int64 counts for NUMBER_LAYERS with 0 set to NAN and number of missing requested 3.0 465 2.0 3136 4.0 31 1.0 14720 NaN 101469 Name: NUMBER_LAYERS, dtype: int64
Let's group the craters based on their depth. It seems like most of the craters are below 1km, so we can divide this range in 4 groups.
# Group depthsprint('Depths split in groups') sub2['DEPTH_RIMFLOOR_TOPOG'] = pd.cut(sub2.DEPTH_RIMFLOOR_TOPOG, [0, 0.25, 0.5, 0.75, 1, 2, 3]) c6 = sub2['DEPTH_RIMFLOOR_TOPOG'].value_counts(sort=False, dropna=True) print(c6) Depths split in groups (0.0, 0.25] 31632 (0.25, 0.5] 17171 (0.5, 0.75] 8618 (0.75, 1.0] 3602 (1.0, 2.0] 1521 (2.0, 3.0] 2 Name: DEPTH_RIMFLOOR_TOPOG, dtype: int64
For the next steps I would limit the data to the craters where depth and layer information is present. This significantly reduces the amount of information to be managed and will provide a more accurate insight in future observations.
#subset data to craters with depth and layer information with a diameter less than 30 km. sub3=data[(data['DEPTH_RIMFLOOR_TOPOG'] > 0) & (data['NUMBER_LAYERS'] > 0) &(data['DIAM_CIRCLE_IMAGE'] <= 30) ] print('counts for Crater Diameter') c7 = sub3['DIAM_CIRCLE_IMAGE'].value_counts(sort=True) print(c7) counts for Crater Diameter 3.71 42 3.16 41 3.26 40 3.54 39 3.04 38 .. 14.48 1 1.35 1 21.57 1 23.31 1 21.33 1 Name: DIAM_CIRCLE_IMAGE, Length: 2150, dtype: int64
0 notes
Text
Running my first program
Mars Crater Study explorations
import pandas as pd import matplotlib.pyplot as plt # Read the file data = pd.read_csv('marscrater_pds.csv', delimiter=",") # Getting first 5 rows of the data to check the name of the columns data.head()

First let's get an overview of the variables and their statistics.
# Statistics of the continuous variables data.describe()

Let's check the depth information and number of layers. It seems like 75% of the craters have values of 0.
# Crater depth histogram plt.rcParams["figure.figsize"] = (12,3) plt.subplot(121) plt.hist(data["DEPTH_RIMFLOOR_TOPOG"], bins='auto') plt.xlabel('Crater Depth') plt.ylabel('Number of Samples') # Crater layers histogram plt.subplot(122) plt.hist(data["NUMBER_LAYERS"], bins='auto') plt.xlabel('Number of layers') plt.ylabel('Number of Samples') plt.show()

Since the crater diameter is a continuous variable, the frequency table is not as informative as the histograms, so I chose to display these first.
#subset data to craters with diameters between 2 km and 20 km. sub1=data[(data['DIAM_CIRCLE_IMAGE']>=2) &(data['DIAM_CIRCLE_IMAGE']<=20)] plt.rcParams["figure.figsize"] = (6,3) plt.hist(sub1["DIAM_CIRCLE_IMAGE"], bins='auto') plt.xlabel('Crater Diameter') plt.ylabel('Number of Samples') plt.show()

The Diameter data has a very big span, so I chose to concentrate on a subset where the size goes from 2 to 20km. A scatter plot could give some insight about any correlation between the crater diameter and the depth.
# Getting a scatter plot to visualize both diameter and depth simultaneously plt.rcParams["figure.figsize"] = (4,3) plt.scatter(sub1['DIAM_CIRCLE_IMAGE'], sub1['DEPTH_RIMFLOOR_TOPOG']) plt.xlabel('Diameter') plt.ylabel('Depth') plt.show()

# frequency distributions of reduced crater subset print('counts for Crater Diameter') c1 = sub1['DIAM_CIRCLE_IMAGE'].value_counts(sort=True) print(c1) print('percentages for Crater Diameter') p1 = sub1['DIAM_CIRCLE_IMAGE'].value_counts(sort=False, normalize=True) print (p1)
counts for Crater Diameter 2.00 915 2.02 877 2.04 822 2.01 812 2.07 812 ... 19.27 3 18.51 3 17.94 2 19.61 2 19.06 1 Name: DIAM_CIRCLE_IMAGE, Length: 1801, dtype: int64 percentages for Crater Diameter 8.00 0.000381 2.00 0.007579 16.00 0.000066 14.08 0.000141 16.43 0.000083 ... 3.89 0.001350 7.99 0.000273 13.61 0.000091 7.90 0.000273 7.95 0.000331 Name: DIAM_CIRCLE_IMAGE, Length: 1801, dtype: float64
Additionally the frequency tables for the depth and layers is shown below:
# frequency distributions of depth and layers print('counts for Crater Depth') c2 = data['DEPTH_RIMFLOOR_TOPOG'].value_counts(sort=True) print(c2) print('percentages for Crater Depth') p2 = data['DEPTH_RIMFLOOR_TOPOG'].value_counts(sort=False, normalize=True) print (p2) print('counts for Crater Layers') c3 = data['NUMBER_LAYERS'].value_counts(sort=True) print(c3) print('percentages for Crater Layers') p3 = data['NUMBER_LAYERS'].value_counts(sort=False, normalize=True) print (p3)
counts for Crater Depth 0.00 307529 0.07 2059 0.08 2047 0.09 2008 0.10 1999 ... 4.75 1 2.84 1 4.95 1 2.97 1 3.08 1 Name: DEPTH_RIMFLOOR_TOPOG, Length: 296, dtype: int64 percentages for Crater Depth 0.00 0.800142 2.00 0.000036 0.22 0.003094 0.19 0.003546 0.43 0.001780 ... 0.78 0.000786 0.62 0.001160 0.16 0.004009 1.57 0.000114 1.14 0.000258 Name: DEPTH_RIMFLOOR_TOPOG, Length: 296, dtype: float64 counts for Crater Layers 0 364612 1 15467 2 3435 3 739 4 85 5 5 Name: NUMBER_LAYERS, dtype: int64 percentages for Crater Layers 0 0.948663 1 0.040243 2 0.008937 3 0.001923 4 0.000221 5 0.000013 Name: NUMBER_LAYERS, dtype: float64
We can see that most of the crater have 0 layers, and only a few have more than 5. Most of them also do not exceed the 1km depth, while a big amount does not have any depth information (Value 0). This could be a good criteria for filtering the data points of interest.
0 notes
Text
Research Project Start
Looking into the Mars Craters Study dataset I wondered if it is possible to find common characteristics based on the location. Considering this goal, I would include the latitude and longitude information and based on some empirical information one or more of the Morphology Ejecta classifications.
Some of the papers related to this subject seem to indicate that certain ejecta are characteristic of specific latitudes. I would like to check if this still holds given the information contained in this dataset.
My research question: Can I group single impact events based on a common ejecta morphology in delimited areas?
These studies seem relevant to the questions above based on the keywords mars crater location:
Martian impact crater ejecta morphologies as indicators of the distribution of subsurface volatiles This paper attributes ejecta morphology to the surface characteristics, which would indicate a correlation with the location of the impact.
Martian fluidized crater morphology: Variations with crater size, latitude, altitude, and target material This paper suggests that pancake craters are mostly located towards the poles.
Both papers use similar variables and identify similar patterns as the ones in the hypothesis.
0 notes