
Don't wanna be here? Send us removal request.
Statistics
We looked inside some of the posts by s-sri-dharshini-blog and here's what we found interesting.
Average Info
Notes Per Post
1
Likes Per Post
1
Reblog Per Post
0
Reply Per Post
0
Time Between Posts
5 days
Number of Posts By Type
Text
5
Last Seen Tumblr Blogs


Fun Fact
Post activity is at the highest at 4:00 pm EDT; notes peak at 10:00 pm EDT.
Text
I’m going to find if life expectancy of a person depends on alcohol consumption. For this I’m using the gapminder dataset.
Here both my explanatory variable (alcconsumption) and response variable (lifeexpectancy) are quantitative variables.
For doing the ANOVA test, my explanatory variable has to be converted to a categorical variable. To do this, I’m going for Univariate Analysis.

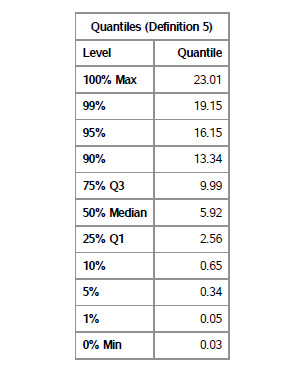
Based on the following output of quantiles, I’m going to divide alcohol consumption into 4 groups
Group 1 - Less than or equal to 25%
Group 2 - Less than or equal to 50%
Group 3 - Less than or equal to 75%
Group 4 - More than 75%


Now we do the ANOVA procedure to find if the two variables are dependent or not. Since my explanatory categorical variable has 4 categories, I need to perform Post Hoc test to find dependence of each and every category the response variable.
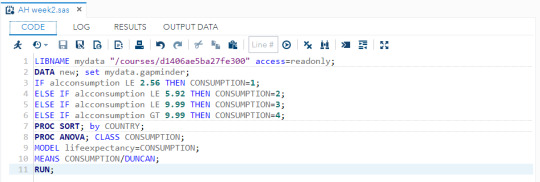


As F=7.62 and P<0.0001, we can reject null hypothesis and accept alternate hypothesis.
Groups 4 and 3 and groups 3 and 1 are not significantly different. Groups 3 and 2, groups 1 and 2, groups 4 and 1 and groups 4 and 2 are significantly different
0 notes
Text
I'm going to check if there is any relation between the amount of time spent between two siblings with the disability of an individual.
Here is the code for that :

I've plotted the variable H1WS1A which tells "The time spent together between two siblings". From the bar chart obtained we can see that it is a unimodal skewed right bar chart. We can also see that about 40% of the siblings spend a lot of time together.

The second plot is for the variable H1PL1 which tells whether an individual has any disability. From the bar chart obtained it is a unimodal bar chart skewed to the right. Also we can see that about 98% of the individuals have no disability.

The final plot is a bar chart between two categorical variables H1PL1 and TIMESPENT. In the graph 0 represents the person with no disability and 1 represents the person with disability. We can see that the person with disability has less interaction with their sibling compared to the interaction between non disabled siblings.

0 notes
Text
LIBNAME mydata "/courses/d1406ae5ba27fe300" access=readonly;
DATA new; set mydata.addhealth_pds;
IF H1PL2=7 THEN H1PL2=.;
IF H1PL3=7 OR H1PL3=8 THEN H1PL3=.;
IF H1PL4=7 THEN H1PL4=.;
NUM_DIFFICULTIES = SUM(OF H1PL2 H1PL3 H1PL4);
IF NUM_DIFFICULTIES GE 2 THEN DIFFICULTY=1; /*multiple problems*/
ELSE IF H1PL2=1 THEN DIFFICULTY=2; /*heart problem alone*/
ELSE IF H1PL3=1 THEN DIFFICULTY=3; /*asthma alone*/
ELSE IF H1PL4=1 THEN DIFFICULTY=4; /*breathing problem alone*/
IF H1PL8=6 OR H1PL8=7 OR H1PL8=8 THEN H1PL8=.;
IF H1PL9=7 OR H1PL9=8 THEN H1PL9=.;
IF H1PL8 NE . AND H1PL8 NE 1 AND H1PL9=. THEN H1PL9=3; /*no of people for whom this question is not appropriate*/
IF H1PL30=6 OR H1PL30=7 OR H1PL30=8 THEN H1PL30=.;
IF H1PL31=6 OR H1PL31=7 OR H1PL31=8 THEN H1PL31=.;
IF H1PL33=6 OR H1PL33=7 OR H1PL33=8 THEN H1PL33=.;
IF H1PL34=6 OR H1PL34=7 OR H1PL34=8 THEN H1PL34=.;
NUM_EQUIP=SUM(OF H1PL30 H1PL31 H1PL33 H1PL34);
IF NUM_EQUIP GE 2 THEN EQUIP=1; /*usage of multiple aids*/
ELSE IF H1PL30=1 THEN EQUIP=2; /*usage of cane*/
ELSE IF H1PL31=1 THEN EQUIP=3; /*usage of walker*/
ELSE IF H1PL33=1 THEN EQUIP=4; /*usage of medically prescribed shoes*/
ELSE IF H1PL34=1 THEN EQUIP=5; /*usage of wheelchair*/
PROC SORT; by AID;
PROC FREQ; TABLES DIFFICULTY H1PL9 EQUIP;
RUN;

1) I've categorised all the permanent physical problems under a single variable DIFFICULTY. From the frequency table we can understand that the people who have asthma have other problems as well.
2) If the answer for the question "Do you have difficulty while walking 10 steps without resting ?", if the answer is "No" the question about amount of difficulty will be invalid. So I've grouped such cases under the value 3.
3) I've categorised the usage of all physical aids under a single variable EQUIP where the value 1 indicates the usage of more than one physical aid and others represent different aids.
0 notes
Text


Out of 6504 observations, when a question like "Do you have difficulty using your hands, arms, legs or feet because of a permanent physical condition" was asked, about 97.66% of the adolescents have said "No", 2.17% of adolescents have said "Yes", 0.08% have refused to say and the rest said "Don't know".
When a question like "Do you use crane, crutches, walker, medically prescribed shoes, wheelchair or scooter to get around because of a permanent physical condition ?" was asked, about 99.42% of adolescents said "No", 0.42% said "Yes", 0.08% have refused to say and the rest said "Don't know".
When a question like "Do you use a brace for your hand, arm, leg or foot because of a permanent physical condition ?" was asked, about 97.49% of the adolescents have said "No", 2.34% have said "Yes", 0.08% have refused to say and the rest said "Don't know".
0 notes
Text
The dataset I've chosen is AddHealth. The reason for choosing it is I felt that doing a research about people of my age would be interesting.
Topic of interest chosen by me is "Physical or Functional Limitations"
Second topic I chosed is "Relationship with Siblings"
Reason for choosing the second topic is I felt that some physically disabled people will not be properly taken care and showed love by their siblings.
Research questions : 1) Do people with physical limitations have poor relationship with their siblings ? 2) Do all normal people have good relationship with their siblings ?
Answers to my questions from the dataset : 1) most of the people have refused to answer 2) yes most of them
Reference : Google scholar
1 note
·
View note