
Statistics
We looked inside some of the posts by smtz-xyz and here's what we found interesting.
Average Info
Notes Per Post
0
Likes Per Post
0
Reblog Per Post
0
Reply Per Post
0
Time Between Posts
2 months
Number of Posts By Type
Text
14
Photo
1
Link
1
Video
1
Last Seen Tumblr Blogs


Fun Fact
The Tumblr office adopted Tommy, an 11-year-old Pomeranian.
Text
Finally completed the 8 course Tableau BI Analyst specialization!
0 notes
Photo


(Plot Parade)
i love this tool!
______________________________________________________________
0 notes
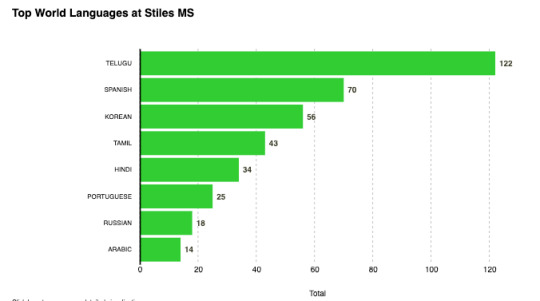
Text
Global Languages in Texas Public Schools
This is a visualization that I created of the top languages (other than English or Spanish) of ESL students at the four largest school districts in Texas.
______________________________________________________________
0 notes
Text
School Ratings Comparison Tool
A course for my Information Science graduate program called Data Analysis and Knowledge Discovery let me to transfer to the Advanced Data Analytics program. My final project for that course was a school ratings side by side comparison tool using Excel.
The project functioned ( Google Sheets version) well but it left me with a desire to create a web based version of it someday. So, a few years after and with the help of ChatGPT, I created that web based version using only html, css and javascript. Far from perfect but not a bad start.
NOTE: This is currently only web based and not mobile friendly. https://saulzmtz.github.io/tea-schools/ https://saulzmtz.github.io/tea-districts/
______________________________________________________________
0 notes

Text
School Student Selector Web App
A simple student raffle web app that I created with the help of ChatGPT and the guidance of Scrimba's AI-Powered coding course. I had ChatGPT assist in helping me add the additional student info (gender and grade level) and then the corresponding visualizations that update dynamically as the students enter their information.
______________________________________________________________
0 notes
Text
Created a school directory tool with chatgpt guidance on generating the html, css and javascript. ChatGPT also guided me with the steps to convert my csv file to json via python.
______________________________________________________________
0 notes
Text

Simple start. Generated the same chart below with the help of ChatGPT. Took a few iterations to get the tooltips, font and colors to work.
https://szmtz.github.io/new-simple-bar-chart-languages/
______________________________________________________________
0 notes
Text
1st d3 bar chart
created a first simple bar chart in d3js thanks to the datavizdad for the guidance.
______________________________________________________________
0 notes
Text
______________________________________________________________
0 notes
Text
______________________________________________________________
0 notes
Text
says data: "I am the plural who walks to you as a singular one." -Dunya Mikhail
______________________________________________________________
0 notes
Video
youtube
Hans Rosling's 200 Countries, 200 Years, 4 Minutes - The Joy of Stats - ...
Re-watching this for my current class. I can't believe it's this old already (2010!). The intention he states is "animating the data in real space" and it's a thing of beauty. I wonder if taking data visualization off the screen (computer monitor or presentation screen) and into "real space" will become a normal and common way of presenting data.
______________________________________________________________
0 notes
Text
______________________________________________________________
0 notes
Text
"Every day we're creating 15 petabytes of new data. That's 8 times as much data as there is in all of the libraries in the US combined."
-Jai Menon
______________________________________________________________
0 notes
Text

.babysteps...enjoying the basics of p5.js.

thank you engin arslan for your course.
______________________________________________________________
0 notes