
Don't wanna be here? Send us removal request.
Statistics
We looked inside some of the posts by sockupcloud and here's what we found interesting.
Average Info
Notes Per Post
3
Likes Per Post
3
Reblog Per Post
0
Reply Per Post
0
Time Between Posts
2 days
Number of Posts By Type
Text
3
Last Seen Tumblr Blogs


Fun Fact
1,644 Tumblr posts in 1 second.
Text
How To Setup ProxySQL(MySql Proxy) Server ? Part -2

In the previous article - How To Setup ProxySQL Server? PART-1, we learned about setting up ProxySQL and this article is more on the same So moving forward with what we had from PART-1 Our Scenario: Host OS: Ubuntu 18.04 RAM: 2GB memory Proxy server: 172.31.2.24 Master IP: 172.31.2.196 Slave IP:-172.31.2.162 Let's Start 1. Configure Monitoring ProxySQL constantly monitors the servers it has configured. To do so, it is important to configure some interval and timeout variables ( in milliseconds ). we can do it by a simple SQL command. the value of 2000 for variable_value=2000 is for the interval. Admin> UPDATE global_variables SET variable_value=2000 WHERE variable_name IN ('mysql-monitor_connect_interval','mysql-monitor_ping_interval','mysql-monitor_read_only_interval'); Query OK, 3 rows affected (0.00 sec) Admin> UPDATE global_variables SET variable_value = 1000 where variable_name = 'mysql-monitor_connect_timeout'; Query OK, 1 row affected (0.00 sec) Admin> UPDATE global_variables SET variable_value = 500 where variable_name = 'mysql-monitor_ping_timeout'; Query OK, 1 row affected (0.00 sec) Admin> LOAD MYSQL VARIABLES TO RUNTIME; Query OK, 0 rows affected (0.00 sec) Admin> SAVE MYSQL VARIABLES TO DISK; Query OK, 116 rows affected (0.02 sec) With the below configuration, servers will only be shunned in case the replication delay exceeds 60 seconds ( 1 min) behind the master Admin> UPDATE mysql_servers SET max_replication_lag=60; 2. Check Backend Status when our servers are under ProxySQL we can monitor its status with the below command and shows that ProxySQL can successfully connect to all backends. mysql> select * from monitor.mysql_server_ping_log order by time_start_us desc limit 3; +--------------+------+------------------+----------------------+------------+ | hostname | port | time_start_us | ping_success_time_us | ping_error | +--------------+------+------------------+----------------------+------------+ | 172.31.2.162 | 3306 | 1563269179814946 | 549 | NULL | | 172.31.2.196 | 3306 | 1563269179787950 | 494 | NULL | | 172.31.2.162 | 3306 | 1563269177825857 | 541 | NULL | +--------------+------+------------------+----------------------+------------+ 3. Check Query Distribution Here we will use "sysbench" user to check query distributions on the cluster, the output of the command shows the number of queries executed per host of ProxySQL mysql> select hostgroup,srv_host,status,Queries,Bytes_data_sent,Latency_us from stats_mysql_connection_pool where hostgroup in (0,1); +-----------+--------------+--------+---------+-----------------+------------+ | hostgroup | srv_host | status | Queries | Bytes_data_sent | Latency_us | +-----------+--------------+--------+---------+-----------------+------------+ | 0 | 172.31.2.196 | ONLINE | 0 | 0 | 512 | | 1 | 172.31.2.162 | ONLINE | 1 | 18 | 500 | | 1 | 172.31.2.196 | ONLINE | 0 | 0 | 512 | +-----------+--------------+--------+---------+-----------------+------------+ 4. Troubleshoot General ProxySQL issues Let's check for host status with the command and if the third column shows the status is SHUNNED then ProxySQL won't send any queries until it comes back to ONLINE. mysql> select hostgroup,srv_host,status,Queries,Bytes_data_sent,Latency_us from stats_mysql_connection_pool where hostgroup in (0,1); +-----------+--------------+---------+---------+-----------------+------------+ | hostgroup | srv_host | status | Queries | Bytes_data_sent | Latency_us | +-----------+--------------+---------+---------+-----------------+------------+ | 0 | 172.31.2.196 | ONLINE | 0 | 0 | 512 | | 1 | 172.31.2.162 | SHUNNED | 1 | 18 | 500 | | 1 | 172.31.2.196 | ONLINE | 0 | 0 | 512 | +-----------+--------------+---------+---------+-----------------+------------+ so to change its status Gracefully for maintenance set the status to OFFLINE_SOFT and if you think you need to make offline immediately set its status to OFFLINE_HARD(Immediately) we can do it with a simple command mysql> UPDATE mysql_servers SET status='OFFLINE_SOFT' WHERE hostname='172.31.2.162'; 5. Configure Query Rules we need to create query rules to route our traffic on the basis we want. 1. For SELECT To send all SELECT queries on the slave ( based on Regex ), we will set a regex to check for queries starting with select. Admin> INSERT INTO mysql_query_rules (active, match_digest, destination_hostgroup, apply) VALUES (1, '^SELECT.*', 1, 0); Query OK, 1 row affected (0.00 sec) Let's check the status of the regex mysql> SELECT rule_id, match_digest,destination_hostgroup hg_id, apply FROM mysql_query_rules WHERE active=1; +---------+---------------------+-------+-------+ | rule_id | match_digest | hg_id | apply | +---------+---------------------+-------+-------+ | 1 | ^SELECT.* | 1 | 0 | +---------+---------------------+-------+-------+ 2. For Update Again we will use the regex to route or traffic to the master MySQL host mysql> INSERT INTO mysql_query_rules (active, match_digest, destination_hostgroup, apply) VALUES (1, '^SELECT.*FOR UPDATE', 0, 1); Query OK, 1 row affected (0.00 sec) Let's check the status of the regex mysql> SELECT rule_id, match_digest,destination_hostgroup hg_id, apply FROM mysql_query_rules WHERE active=1; +---------+---------------------+-------+-------+ | rule_id | match_digest | hg_id | apply | +---------+---------------------+-------+-------+ | 1 | ^SELECT.* | 1 | 0 | | 2 | ^SELECT.*FOR UPDATE | 0 | 1 | +---------+---------------------+-------+-------+ 2 rows in set (0.00 sec) we see that we have 2 rows for select and update with host group id 1 for select and host group id 0 for select and after every update in setting run the below command. 2. For Updatemysql> LOAD MYSQL QUERY RULES TO RUNTIME; Query OK, 0 rows affected (0.00 sec) mysql> SAVE MYSQL QUERY RULES TO DISK; Query OK, 0 rows affected (0.08 sec) 6. Check Configuration: In our case, the user "sysbench" has a default_hostgroup=0, therefore any query not matching the above rules will be sent to host group 0 . Below stats, tables are used to validate if your query rules getting used by incoming traffic. we can check our configuration like below mysql> SELECT rule_id, hits, destination_hostgroup hg FROM mysql_query_rules NATURAL JOIN stats_mysql_query_rules; +---------+------+----+ | rule_id | hits | hg | +---------+------+----+ | 1 | 0 | 1 | | 2 | 0 | 0 | +---------+------+----+ also, we can validate our DB connection for the same user on the proxy server itself. root@ip-172-31-2-24:/home/kapendra.singh# mysql -u sysbench -psysbench -h 127.0.0.1 -P6033 -e "SELECT @@server_id" mysql: Using a password on the command line interface can be insecure. +-------------+ | @@server_id | +-------------+ | 2 | +-------------+ Conclusion: we tried to cover the most useful scenarios and queries that can be used for monitoring our backend MySQL database. However, we can always push this data to several monitoring services like Nagios, Icinga, datadog, and others with custom-made plugins available. Don't get scared to get your hands dirty in experimenting with ProxySQL as a monitoring solution for MySQL. Read the full article
0 notes
Text
How To Setup ProxySQL(MySql Proxy) Server ? Part -1

Read with Slave and Write with Master In today's world, most of the infra is cloud-based now and these cloud services are reliable nowadays. if we have a look at RDS in AWS there are reader and writer and AWS RDS decide where to send read/write request. In an ideal scenario, the read request should get the server via MySql slave and write request with MySQL master. Most organizations still use self-hosted MySQL server setups, thus making the ideal situation a bit tough, in this article, we will learn about MySQL Proxy. What is MySQL Proxy? Using MySQL Proxy an application may communicate between one or more MySQL servers and one or more MySQL clients over the network Why Mysql Proxy? MySQLProxy is a middle layer sitting between a MySQL database and an application. The application connects to a proxy, which then forwards connections into the database and it works the application layer.
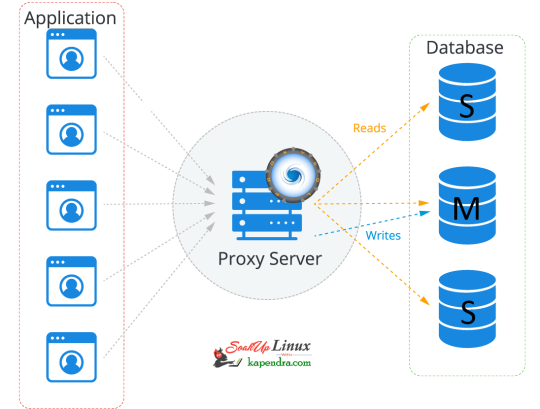
So let's start getting our hands dirty Our Scenario: Host OS: Ubuntu 18.04 RAM: 2GB memory Proxy server: 172.31.2.24 Master IP: 172.31.2.196 Slave IP:-172.31.2.162 Let's Start Step 1: Add MySQL Proxy Repository To install MySQL proxy we need to set up a repository. follow the below command to install the repo on the Proxy server host. $ apt-get install -y lsb-release $ wget -O - 'https://repo.proxysql.com/ProxySQL/repo_pub_key' | apt-key add - echo deb https://repo.proxysql.com/ProxySQL/proxysql-2.0.x/$(lsb_release -sc)/ ./ | tee /etc/apt/sources.list.d/proxysql.list Step 2: Install MySQL Run the below command on the Proxy server host $ apt-get update $ apt-get install proxysql Note: By default, ProxySQL binds with two Ports 6032 and 6033. MySQL 6032 is the admin port and 6033 is the one that accepts incoming connections from clients. Step 3: Start ProxySQL Now run this simple command to start and enable ProxySQL $ systemctl start proxysql $ systemctl enable proxysql Alternatively, we can do this via the Admin interface as well. $ mysql -u admin -padmin -h 127.0.0.1 -P6032 --prompt='Admin> ' Admin> proxysql start Admin> proxysql stop Step 4: Configuring ProxySQL via the admin interface Before entering the admin interface of ProxySQL, create one application user with all privileges required for your application and one monitoring user at every MySQL DB server. On Mysql Master Host $ mysql -u root -ppassword mysql> CREATE USER 'sysbench'@'%' IDENTIFIED BY 'sysbench'; mysql> GRANT ALL PRIVILEGES on *.* TO 'sysbench'@'%'; mysql> CREATE USER 'monitor'@'%' IDENTIFIED BY 'monitor'; mysql> GRANT USAGE,REPLICATION CLIENT on *.* TO 'monitor'@'%'; mysql> FLUSH PRIVILEGES; On the Proxy server host After installation making the service up and creating the application user, we need to configure ProxySQL In this setup, we are used using need 2 host groups hostgroup 0: For the master hostgroup 1: For the slaves $ mysql -u admin -padmin -h 127.0.0.1 -P6032 --prompt='Admin>' Admin>show databases; +-----+---------------+-------------------------------------+ | seq | name | file | +-----+---------------+-------------------------------------+ | 0 | main | | | 2 | disk | /var/lib/proxysql/proxysql.db | | 3 | stats | | | 4 | monitor | | | 5 | stats_history | /var/lib/proxysql/proxysql_stats.db | +-----+---------------+-------------------------------------+ 5 rows in set (0.00 sec) Add Master for reading and writing requests. Admin>INSERT INTO mysql_servers(hostgroup_id,hostname,port) VALUES (0,'172.31.2.196',3306); Admin>INSERT INTO mysql_servers(hostgroup_id,hostname,port) VALUES (1,'172.31.2.196',3306); Add slave for reading requests Admin>INSERT INTO mysql_servers(hostgroup_id,hostname,port) VALUES (1,'172.31.2.162',3306); Proxysql 2.0 comes with native monitoring for Aurora, by checking the variable “Innodb_read_only”, to determine the reader/Writer for the individual nodes, This info of check has to be added to the table “mysql_replication_hostgroups” in ProxySQL Admin>insert into mysql_replication_hostgroups values (0,1,'read_only','STG'); Admin>LOAD MYSQL SERVERS TO RUNTIME; Admin>SAVE MYSQL SERVERS TO DISK; Note: When we load MYSQL SERVERS, Our writer host also gets configured in the reader host group automatically by ProxySQL to handle all those queries which are redirected to the reader host group in case no slaves are online. this is optional to decrease the weightage assigned to master servers inside the mysql_server table for the reader host group so that most of the read queries will go on the server which has a higher weight. Admin>UPDATE mysql_servers SET weight=200 WHERE hostgroup_id=1 AND hostname='172.31.2.196'; Admin>UPDATE mysql_servers SET weight=1000 WHERE hostgroup_id=1 AND hostname='172.31.2.162'; Configure Monitor monitor user will continuously check the status of the backend in a specified interval. sysbench is the user, created for the application. Admin> UPDATE global_variables SET variable_value='monitor' WHERE variable_name='monitor'; Query OK, 0 rows affected (0.00 sec) Admin> LOAD MYSQL VARIABLES TO RUNTIME; Query OK, 0 rows affected (0.00 sec) Admin> SAVE MYSQL VARIABLES TO DISK; Query OK, 116 rows affected (0.03 sec) INSERT INTO mysql_users(username,password,default_hostgroup) VALUES ('sysbench','sysbench',1); Confirm user details and we will save the configuration to disk: Admin> SELECT username,password,active,default_hostgroup,default_schema,max_connections,max_connections FROM mysql_users; +----------+----------+--------+-------------------+----------------+-----------------+-----------------+ | username | password | active | default_hostgroup | default_schema | max_connections | max_connections | +----------+----------+--------+-------------------+----------------+-----------------+-----------------+ | sysbench | sysbench | 1 | 1 | NULL | 10000 | 10000 | +----------+----------+--------+-------------------+----------------+-----------------+-----------------+ 1 row in set (0.00 sec) Admin> LOAD MYSQL USERS TO RUNTIME; Query OK, 0 rows affected (0.00 sec) Admin> SAVE MYSQL USERS TO DISK; Query OK, 0 rows affected (0.04 sec) Admin> SAVE MYSQL SERVERS TO DISK; Query OK, 0 rows affected (0.30 sec) Step 5: Configure Query Rule After setting up we need to define which host group should get the select query and which should get written. so to do this we need to run the below commands. To send all SELECT queries on the slave ( based on Regex ). Admin> INSERT INTO mysql_query_rules (active, match_digest, destination_hostgroup, apply) VALUES (1, '^SELECT.*', 1, 0); Query OK, 1 row affected (0.00 sec) To send read and write queries on master (based on Regex) Admin> INSERT INTO mysql_query_rules (active, match_digest, destination_hostgroup, apply) VALUES (1, '^SELECT.*FOR UPDATE', 0, 1); Query OK, 1 row affected (0.00 sec) and write an update on the Disk with the below commands Adminl> LOAD MYSQL QUERY RULES TO RUNTIME; Query OK, 0 rows affected (0.00 sec) Admin> SAVE MYSQL QUERY RULES TO DISK; Query OK, 0 rows affected (0.08 sec) This is all you need to configure ProxySQL and now you just have to tell your application to communicate with the ProxySQL host I hope you like this article and I would love to answer your question. in the next article, we will explore ProxySql monitoring, configuration status, and its tests. Read the full article
1 note
·
View note
Text
How To Setup Elasticsearch 6.4 On RHEL/CentOS 6/7?

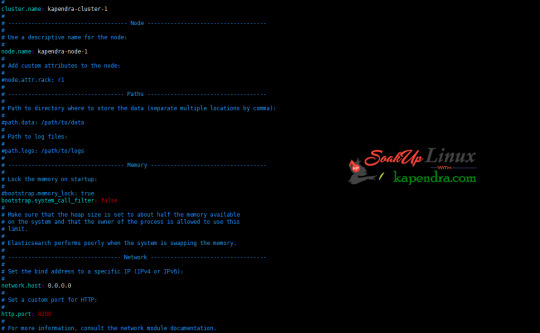
What is Elasticsearch? Elasticsearch is a search engine based on Lucene. It is useful in a distributed environment and helps in a multitenant-capable full-text search engine. While you query something from Elasticsearch it will provide you with an HTTP web interface and schema-free JSON documents. it provides the ability for full-text search. Elasticsearch is developed in Java and is released as open-source under the terms of the Apache 2 license. Scenario: 1. Server IP: 192.168.56.101 2. Elasticsearch: Version 6.4 3. OS: CentOS 7.5 4. RAM: 4 GB Note: If you are a SUDO user then prefix every command with sudo, like #sudo ifconfig With the help of this guide, you will be able to set up Elasticsearch single-node clusters on CentOS, Red Hat, and Fedora systems. Step 1: Install and Verify Java Java is the primary requirement for installing Elasticsearch. So, make sure you have Java installed on your system. # java -version openjdk version "1.8.0_181" OpenJDK Runtime Environment (build 1.8.0_181-b13) OpenJDK 64-Bit Server VM (build 25.181-b13, mixed mode) If you don’t have Java installed on your system, then run the below command # yum install java-1.8.0-openjdk Step 2: Setup Elasticsearch For this guide, I am downloading the latest Elasticsearch tar from its official website so follow the below step # wget https://artifacts.elastic.co/downloads/elasticsearch/elasticsearch-6.4.2.tar.gz # tar -xzf elasticsearch-6.4.2.tar.gz # tar -xzf elasticsearch-6.4.2.tar.gz # mv elasticsearch-6.4.2 /usr/local/elasticsearch Step 5: Permission and User We need a user for running elasticsearch (root is not recommended). # useradd elasticsearch # chown -R elasticsearch.elasticsearch /usr/local/elasticsearch/ Step 6: Setup Ulimits Now to get a Running system we need to make some changes of ulimits else we will get an error like “max number of threads for user is too low, increase to at least ” so to overcome this issue make below changes you should run. # ulimit -n 65536 # ulimit -u 2048 Or you may edit the file to make changes permanent # vim /etc/security/limits.conf elasticsearch - nofile 65536 elasticsearch soft nofile 64000 elasticsearch hard nofile 64000 elasticsearch hard nproc 4096 elasticsearch soft nproc 4096 Save files using :wq Step 7: Configure Elasticsearch Now make some configuration changes like cluster name or node name to make our single node cluster live. # cd /usr/local/elasticsearch/ Now, look for the below keywords in the file and change according to you need # vim conf/elasticsearch.yml cluster.name: kapendra-cluster-1 node.name: kapendra-node-1 http.port: 9200 to set this value to your IP or make it 0.0.0.0 ID needs to be accessible from anywhere from the network. Else put your IP of localhost network.host: 0.0.0.0 There is one more thing if you have any dedicated mount pint for data then change the value for #path.data: /path/to/data to your mount point.
Your configuration should look like the above. Step 8: Starting Elasticsearch Cluster As the Elasticsearch setup is completed. Let the start Elasticsearch cluster with elastic search user so first switch to elastic search user and then run the cluster # su - elasticsearch $ /usr/local/elasticsearch/bin/elasticsearch 22278 Step 9: Verify Setup You have all done it, just need to verify the setup. Elasticsearch works on port default port 9200, open your browser to point your server on port 9200, You will find something like the below output http://localhost:9200 or http://192.168.56.101:9200 at the end of this article, you have successfully set up Elasticsearch single node cluster. In the next few articles, we will try to cover a few commands and their setup in the docker container for development environments on local machines. Read the full article
2 notes
·
View notes