
Don't wanna be here? Send us removal request.
Statistics
We looked inside some of the posts by specialmaps and here's what we found interesting.
Average Info
Notes Per Post
2K
Likes Per Post
1K
Reblog Per Post
686
Reply Per Post
10
Time Between Posts
27 days
Number of Posts By Type
Text
13
Photo
4
Last Seen Tumblr Blogs


Fun Fact
Celebrities use Tumblr as well.
Text

Traffic speed data in RIchmond - colors are kinda hard to differentiate? But still cool.
Should be the same link, but just in case.
0 notes
Text

visualize traffic accidents in Richmond, with sorting mechanisms
0 notes
Text
https://www.lightningmaps.org/;#google_vignette;z=14;t=3;y=37.5261;x=-77.425;d=2;dl=2;dc=0;b=41.16;o=0
Lightning maps!!!
0 notes
Text

Across Virginia’s capital region, landowners are seeing development increase at staggering rates. The Capital Region Land Conservancy is here to protect lands through voluntary conservation easements and through the acquisition of land through donation or purchase. Our projects cover farmland, forests, historic battlefields, rivers and streams, and vulnerable ecosystems. We give great care to projects from small family farms to monumental undertakings like protecting Malvern Hill Farm.
---
Hey, nice! Here's what the protected land holdings in Richmond look like, on a map.
0 notes
Text
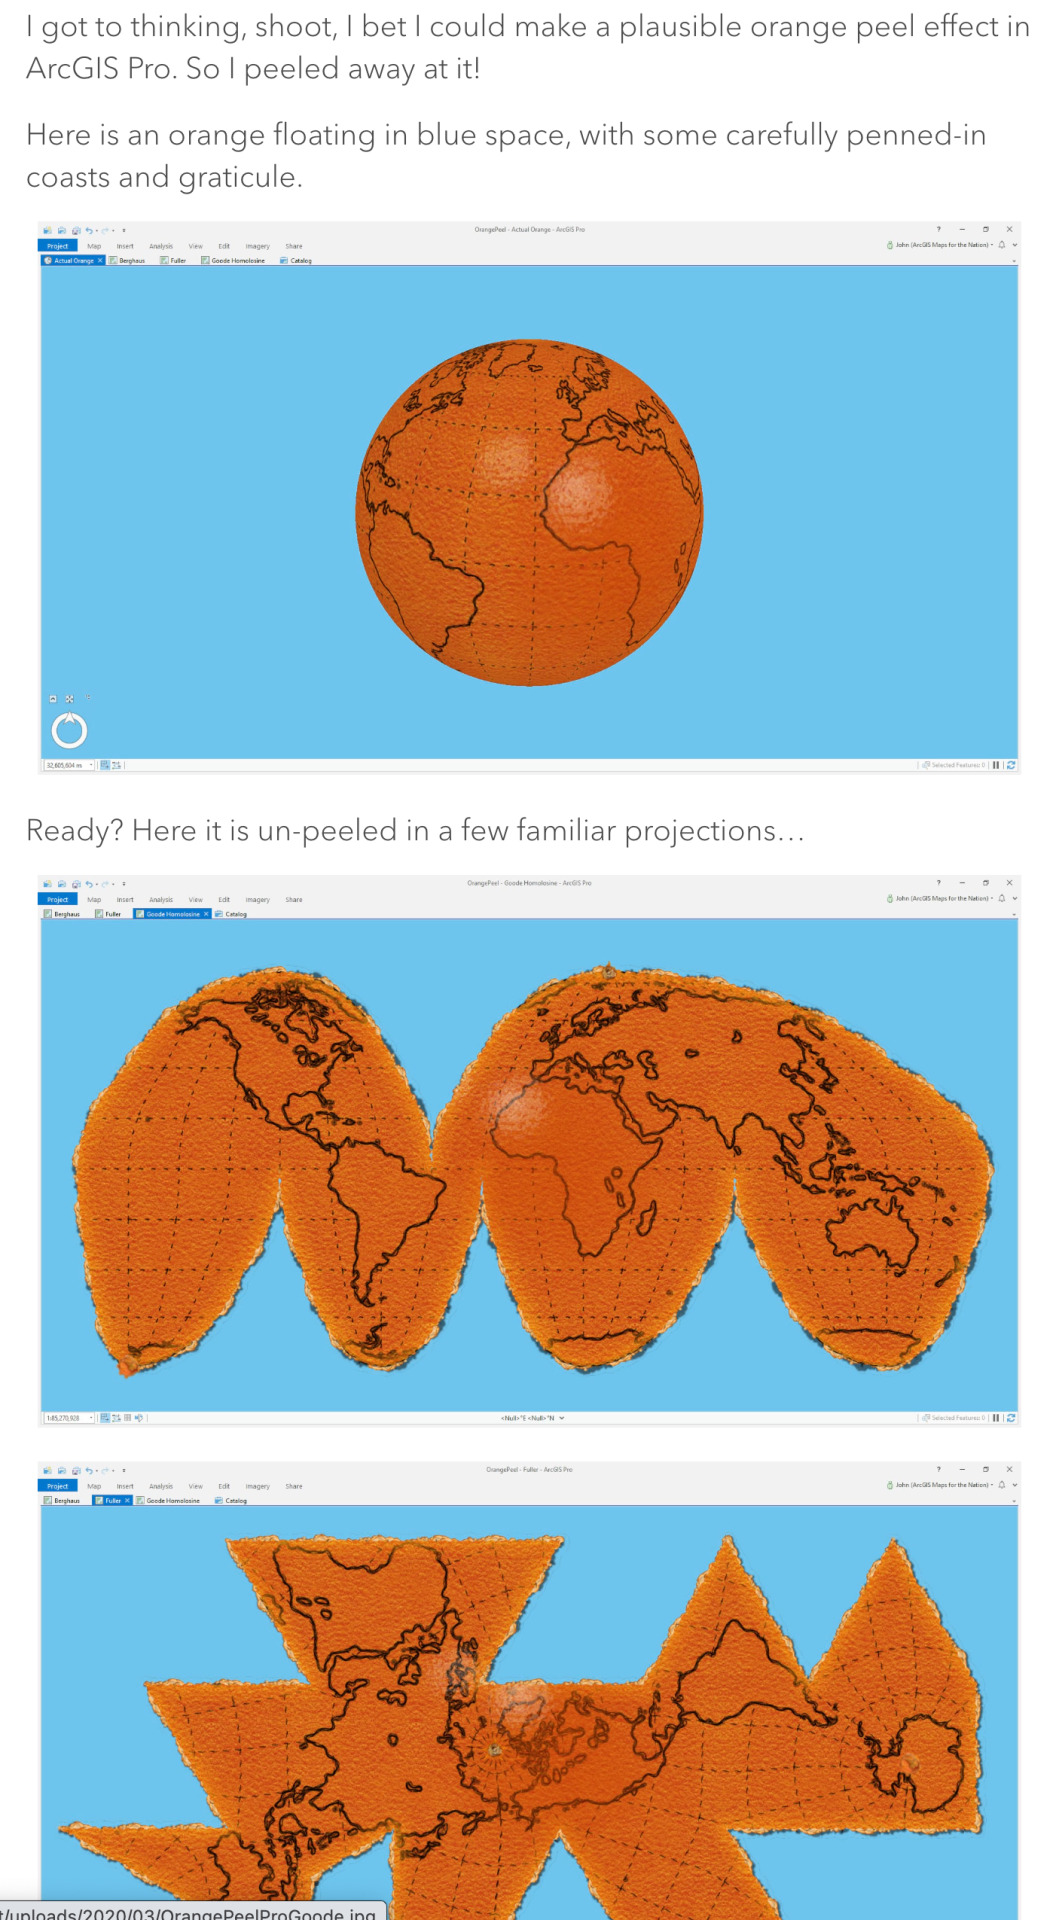
Downloadable Earth Peel project in ArcGIS Pro :)
0 notes
Photo

How reliable is the weather forecast across the US? (to within 3°F)
by nk_wapo
877 notes
·
View notes
Photo

The Decline of Trust Among Americans Has Been National: Only 1 in 4 Americans now agree that most people can be trusted. What can be done to stop the trend?
by mancub
313 notes
·
View notes
Text
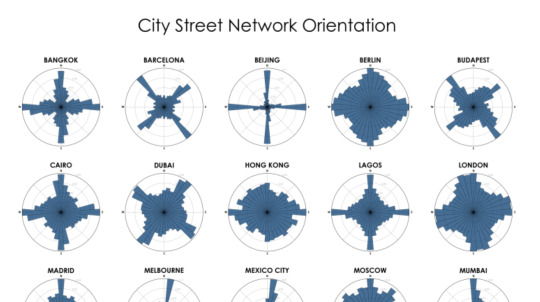
Map adjacent - analysis of different cities' street orientation as compared to the cardinal directions. Fascinating. I would love to see them arrayed on a globe or at least in latitude order.
This post is adapted from this research paper that you can read/cite for more info. It analyzes and visualizes 100 cities around the world.
This one is just for US cities.
1 note
·
View note
Text

Tokyo subway map!!!! WOWW
0 notes
Text

Aw hell yeah, interactive map of road trips stops from eleven different literary travels. Good for planning, good for book club.
0 notes
Text

0 notes
Text
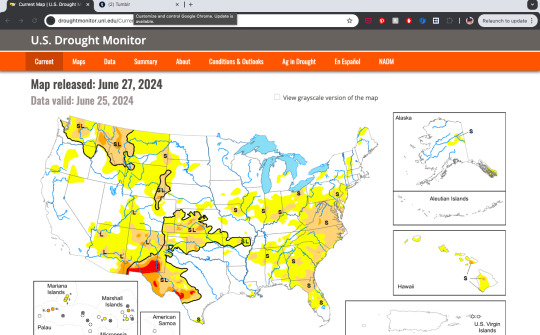
The U.S. Drought Monitor (USDM) is a map released every Thursday, showing where drought is and how bad it is across the U.S. and its territories. The map uses six classifications: normal conditions, abnormally dry (D0), showing areas that may be going into or are coming out of drought, and four levels of drought: moderate (D1), severe (D2), extreme (D3) and exceptional (D4).
They have many many excellent tools for viewing their data, which are well displayed and easily interactive.
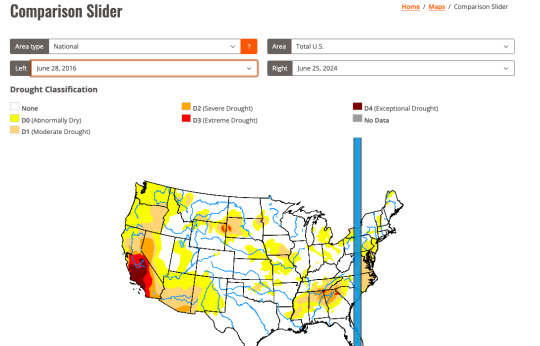
Several different agencies take turns updating the map :)
0 notes

Text
Very good dumpster diving map for if you find yourself hungry in Berlin!


3 notes
·
View notes
Text

A map of where the last few remaining Kmarts can be found :') Get em before they're gone, or don't.
0 notes
Photo


Where can you road trip in a week’s vacation? These maps show 500-mile (~800km) travel days along US Interstate Highways.
659 notes
·
View notes