Text

This was in Sioux Falls South Dakota! The green sky is caused by large hail stones within the storm refracting back green light to the observer.
204K notes
·
View notes
Photo

A pilot captured this thunderstorm as seen from 37,000 feet
7 notes
·
View notes
Text
Water, Water Everywhere; We Track Drops to Drink!
When we think about what makes a planet habitable, we’re often talking about water. With abundant water in liquid, gas (vapor) and solid (ice) form, Earth is a highly unusual planet. Almost 70% of our home planet’s surface is covered in water!
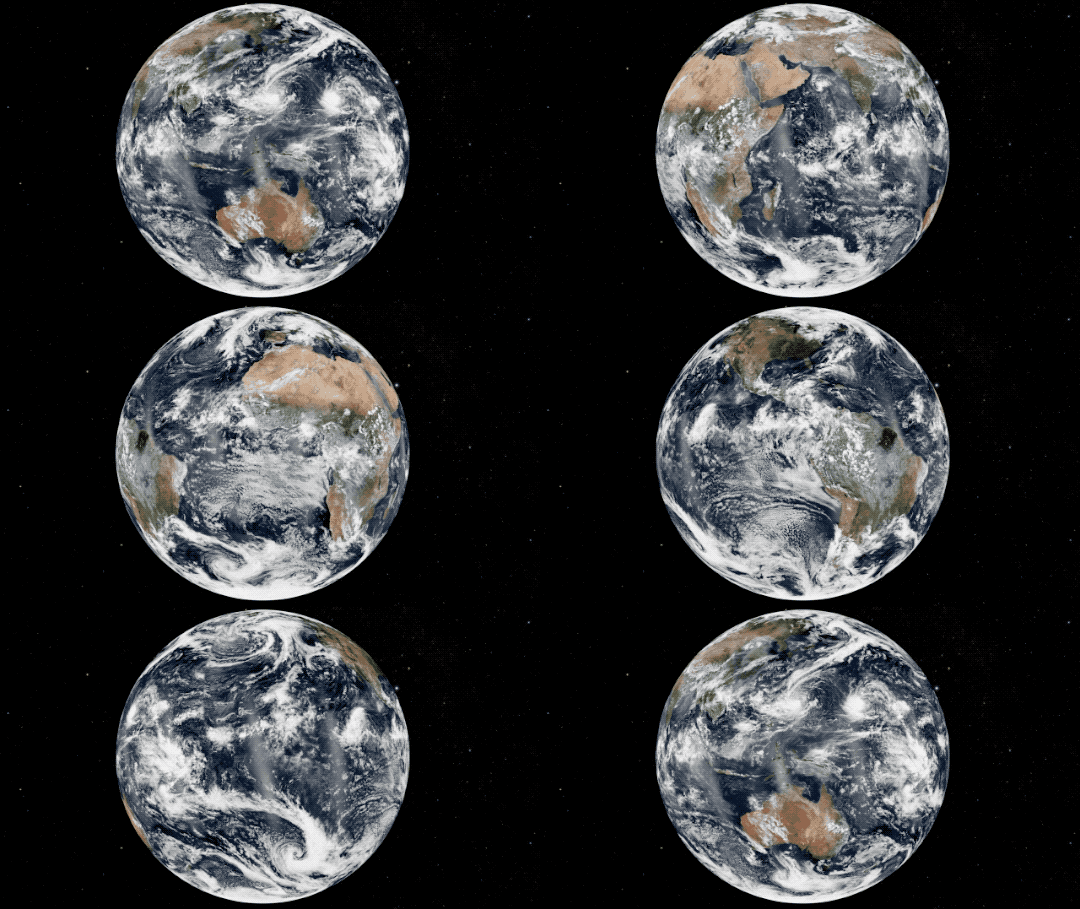
But about 97% of Earth’s water is salty – only a tiny amount is freshwater: the stuff humans, pets and plants need to survive.
Water on our planet is constantly moving, and not just geographically. Water shifts phases from ice to water to vapor and back, moving through the planet’s soils and skies as it goes.
That’s where our satellites come in.
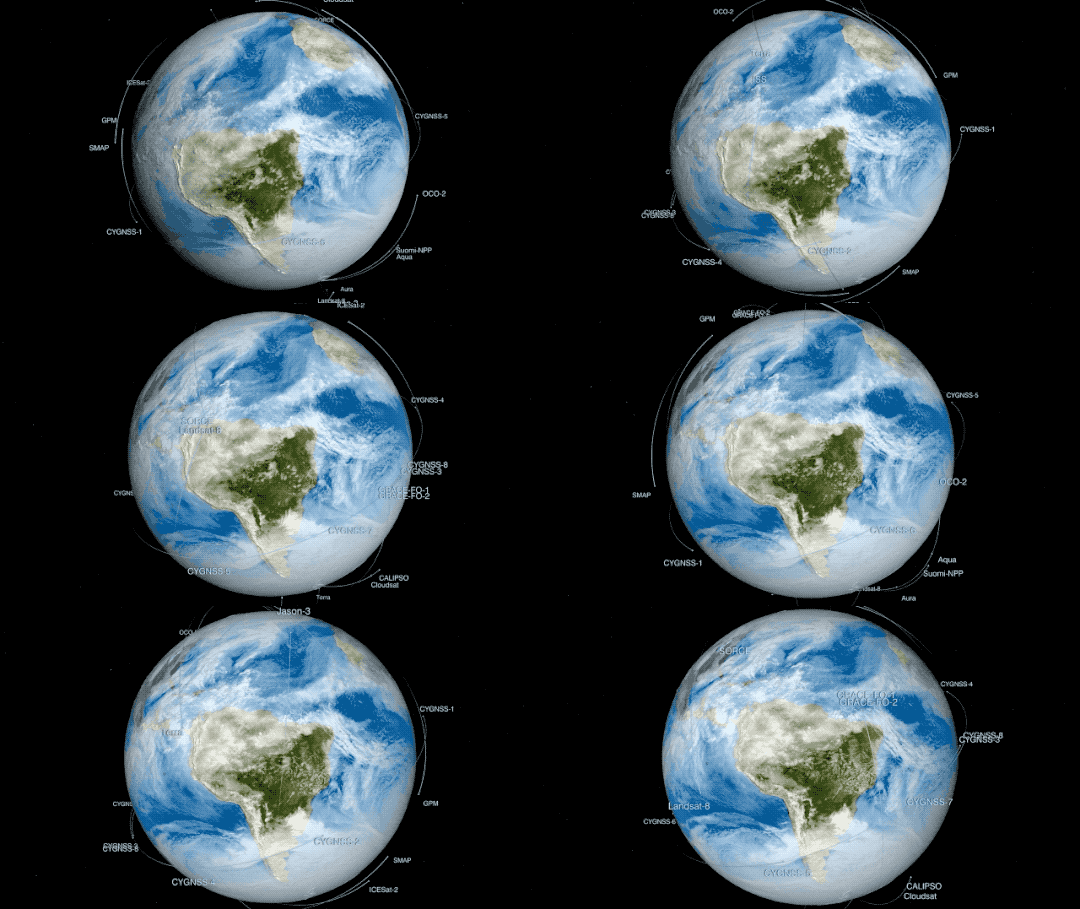
Knowing where the water is, and where it’s going, helps people make better decisions about how to manage it. Earth’s climate is changing rapidly, and freshwater is moving as a result. Some places are getting drier and some are getting much, much wetter.
Look at the Midwestern U.S. this spring, for example. Torrential rain oversaturated the soil and overflowed rivers, which caused severe flooding, seen by Landsat.

Our satellites also tracked a years-long drought in California. Between 2013 and 2014, much of the state turned brown, without visible green.

It’s not just rain. Where and when snow falls – and melts – is changing, too. The snow that falls and accumulates on the ground is called snowpack, which eventually melts and feeds rivers used for drinking water and crop irrigation. When the snow doesn’t fall, or melts too early, communities go without water and crops don’t get watered at the right time.

Even when water is available, it can become contaminated by blooms of phytoplankton, like cyanobacteria . Also known as blue-green algae, these organisms can make humans sick if they drink the water. Satellites can help track algae from space, looking for the brightly colored blooms against blue water.


Zooming even farther back, Earth’s blue water is visible from thousands of miles away. The water around us makes our planet habitable and makes our planet shine blue among the darkness of space.

Make sure to follow us on Tumblr for your regular dose of space: http://nasa.tumblr.com.
2K notes
·
View notes
Text
What Space Weather Means for You
In space, invisible, fast-moving particles from the Sun and other sources in deep space zip around, their behavior shaped by dynamic electric and magnetic fields. There are so few of these particles that space is considered a vacuum, but what’s there packs a punch. Together, we call all of this invisible activity space weather — and it affects our technology both in space and here on Earth.
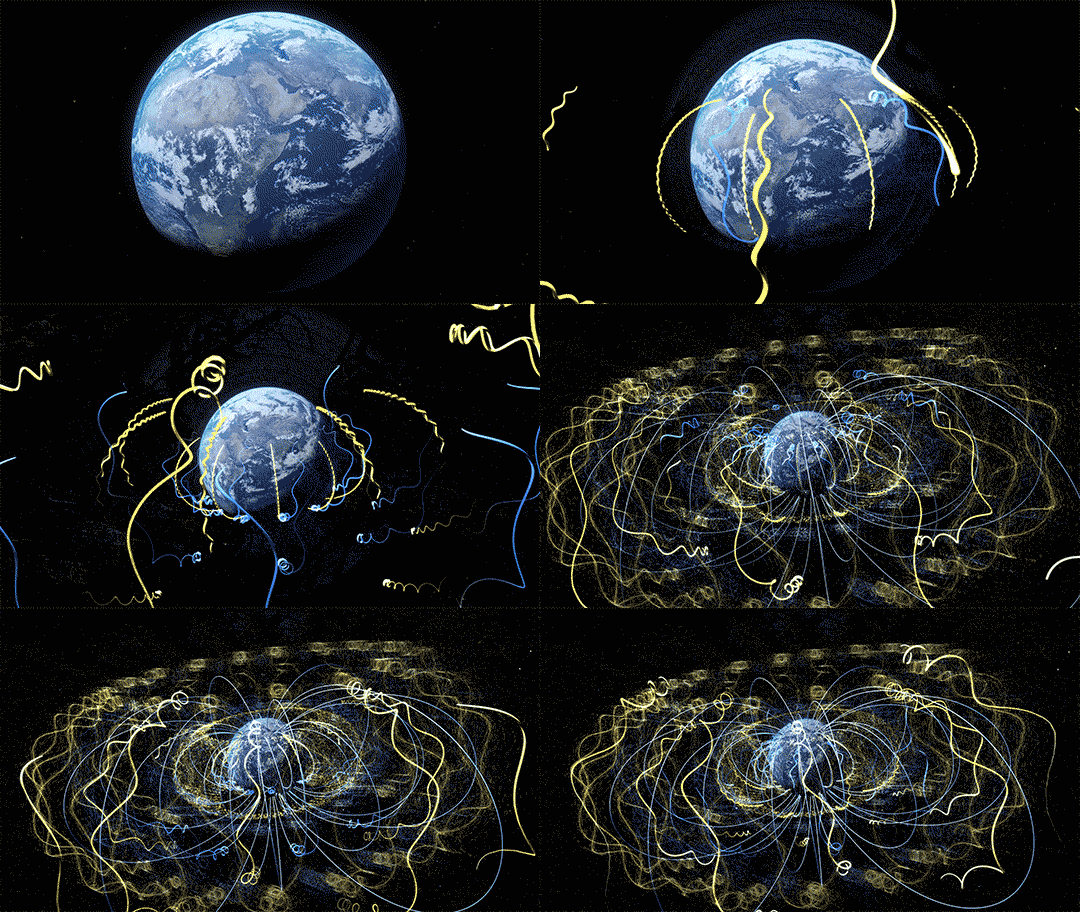
This month, two new missions are launching to explore two different kinds of space weather.
Scrambled signals
Many of our communications and navigation systems — like GPS and radio — rely on satellites to transmit their signals. When signals are sent from satellites down to Earth, they pass through a dynamic zone on the upper edge of Earth’s atmosphere called the ionosphere.
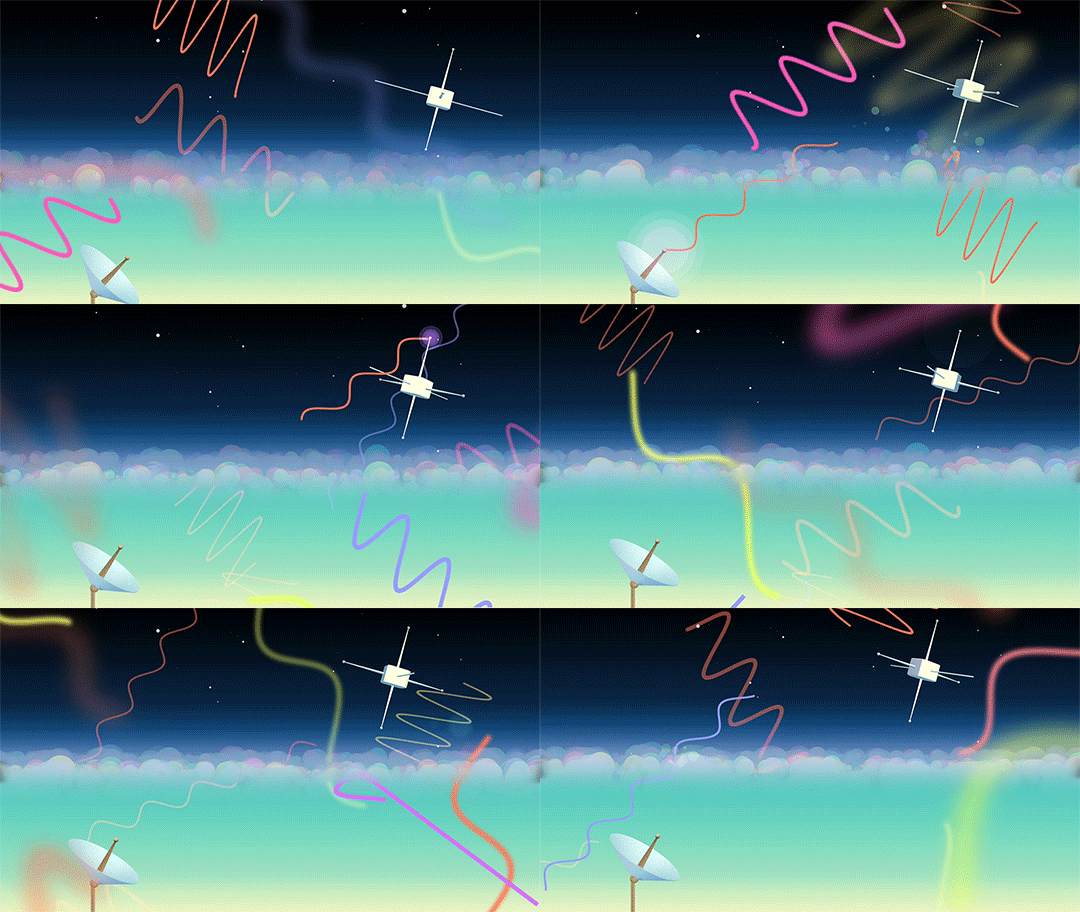
Gases in the ionosphere have been cooked into a sea of positive- and negative-charged particles by solar radiation. These electrically charged particles are also mixed in with neutral gases, like the air we breathe. The charged particles respond to electric and magnetic fields, meaning they react to space weather. Regular weather can also affect this part of the atmosphere.
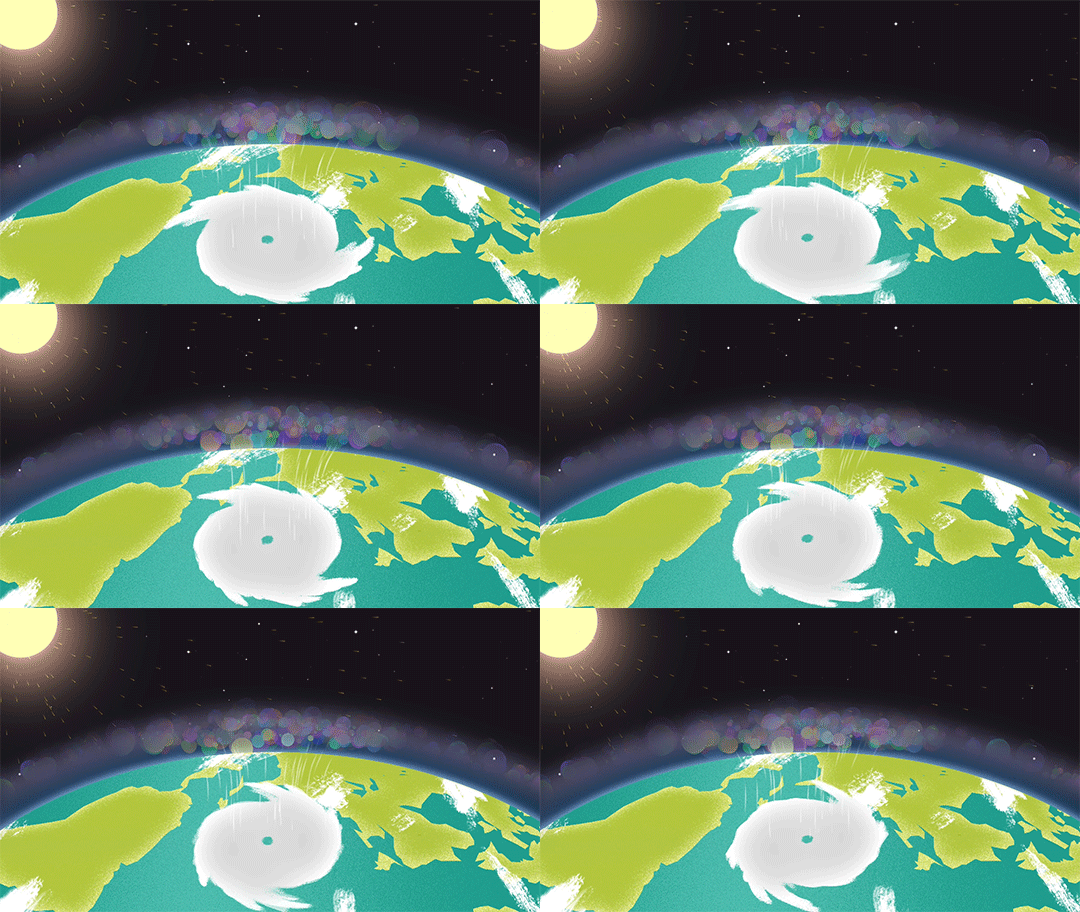
Influenced by this complicated web of factors, structured bubbles of charged gas sometimes form in this part of the atmosphere, particularly near the equator. When signals pass through these bubbles, they can get distorted, causing failed communications or inaccurate GPS fixes.
Right now, it’s hard to predict just when these bubbles will form or how they’ll mess with signals. The two tiny satellites of the E-TBEx mission will try to shed some light on this question.

As these CubeSats fly around Earth, they’ll send radio signals to receiving stations on the ground. Scientists will examine the signals received in order to see whether — and if so, how much — they were jumbled as they traveled through the upper atmosphere and down to Earth.
All together, this information will give scientists a better idea of how these bubbles form and change and how much they disrupt signals — information that could help develop strategies for mitigating these bubbles’ disruptive effects.
Damaged satellites
The high-energy, fast-moving particles that fill space are called radiation. Every single spacecraft — from scientific satellites sprinkled throughout the solar system to the communications satellites responsible for relaying the GPS signals we use every day — must weather the harsh radiation of space.
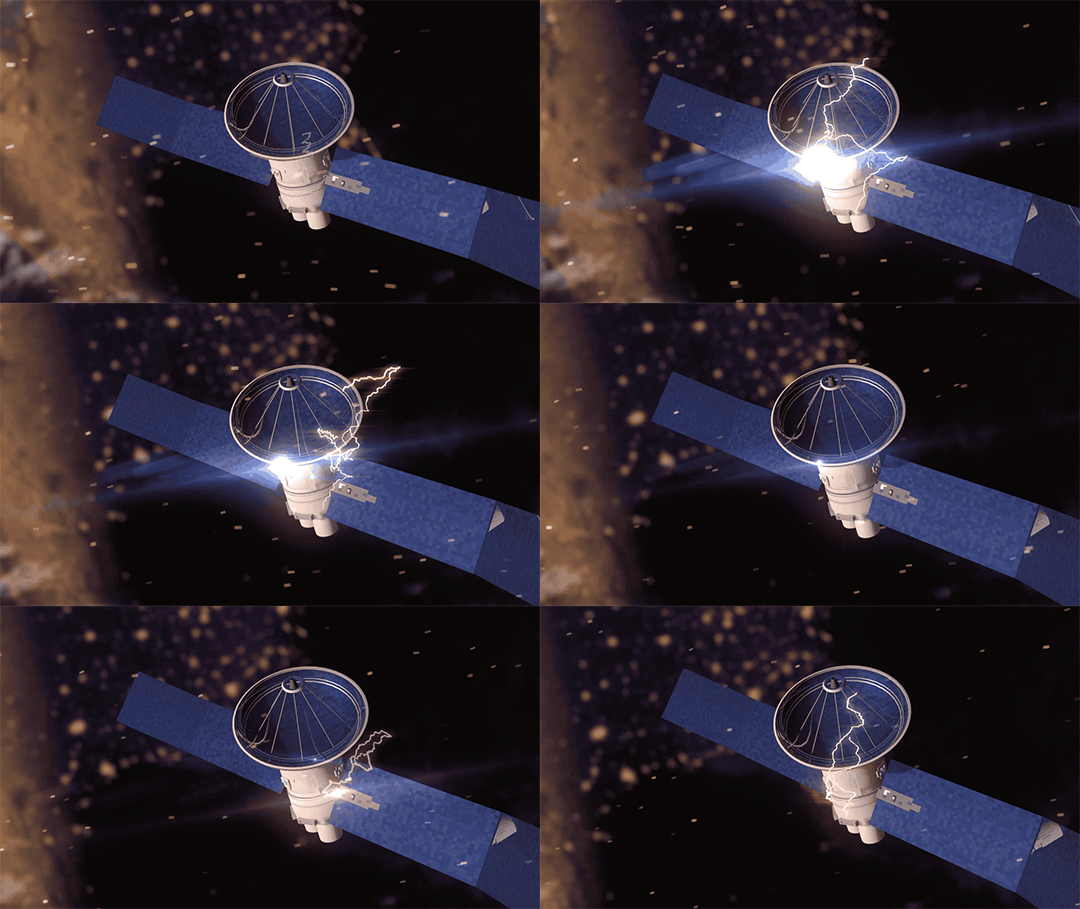
Strikes from tiny, charged particles can spark memory damage or computer upsets on spacecraft, and over time, degrade hardware. The effects are wide-ranging, but ultimately, radiation can impact important scientific data, or prevent people from getting the proper navigation signals they need.
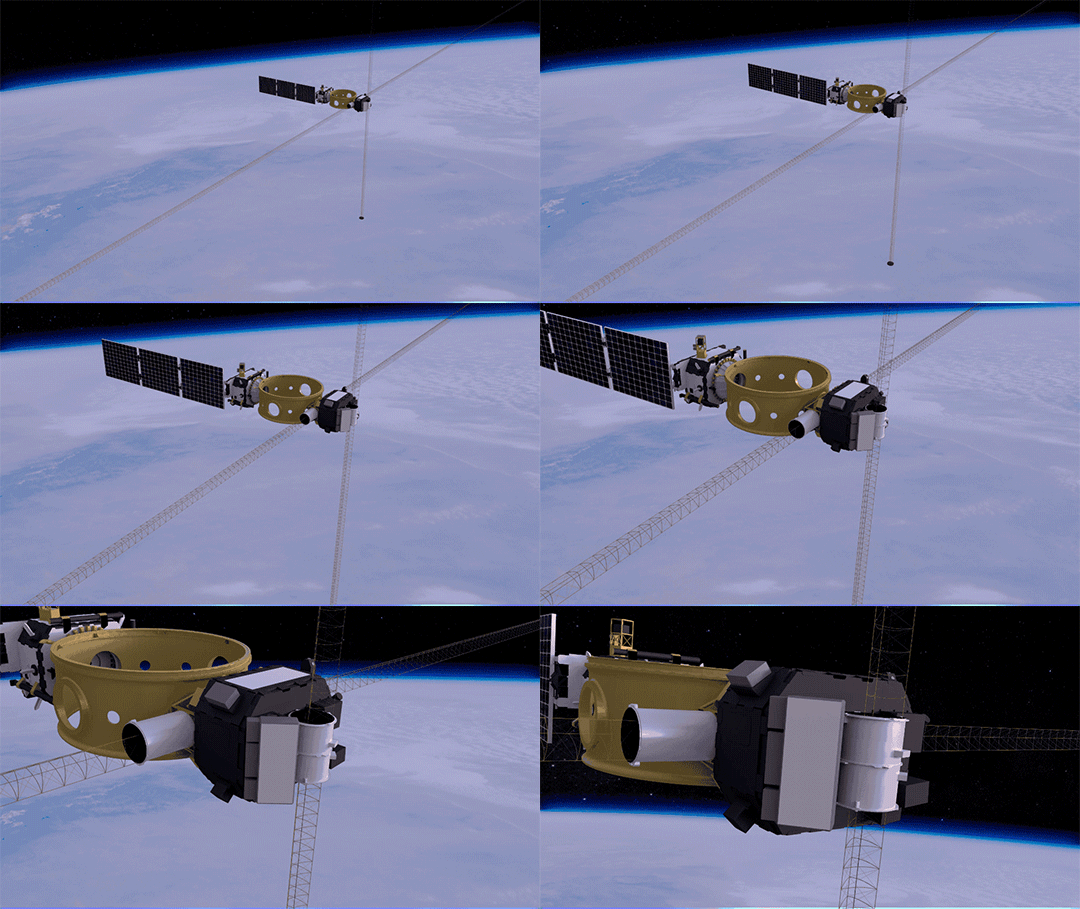
Space Environment Testbeds — or SET, for short — is our mission to study how to better protect satellites from space radiation.
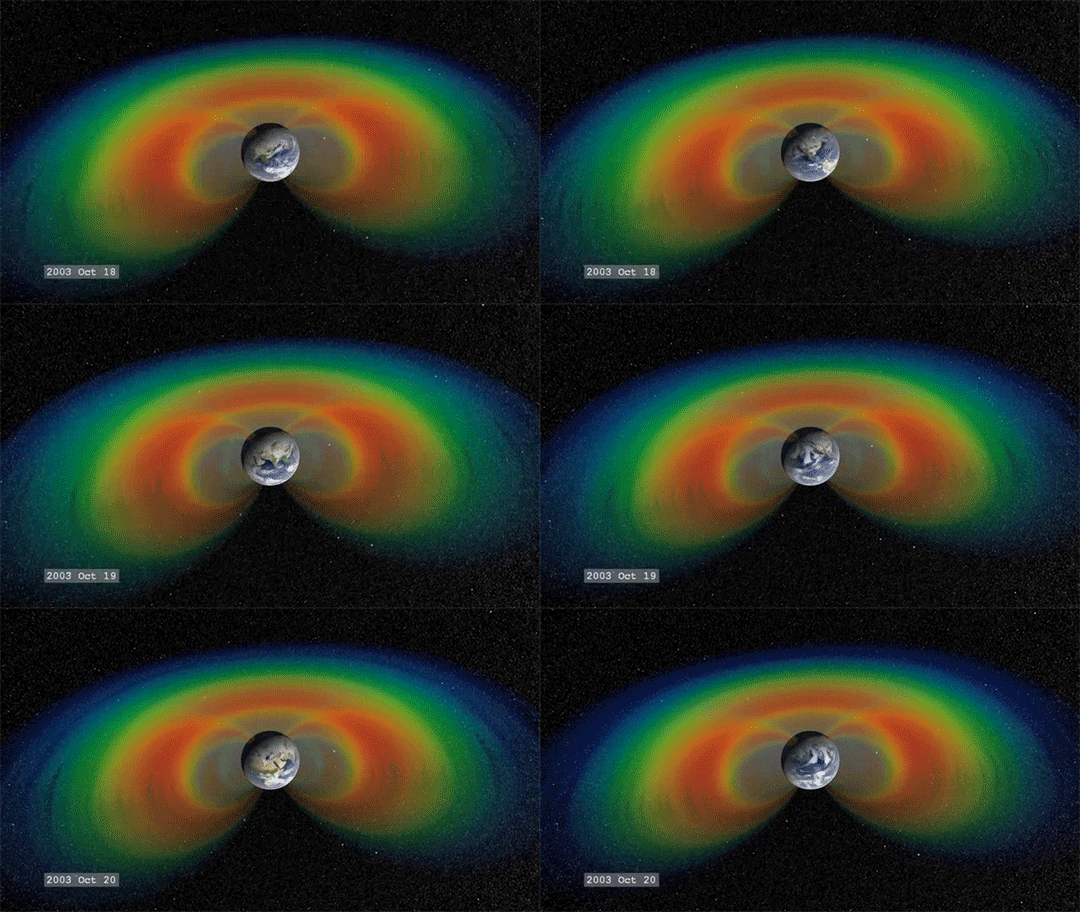
SET aims its sights on a particular neighborhood of near-Earth space called the slot region: the gap between two of Earth’s vast, doughnut-shaped radiation belts, also known as the Van Allen Belts. The slot region is thought to be calmer than the belts, but known to vary during extreme space weather storms driven by the Sun. How much it changes exactly, and how quickly, remains uncertain.
The slot region is an attractive one for satellites — especially commercial navigation and communications satellites that we use every day — because from about 12,000 miles up, it offers not only a relatively friendly radiation environment, but also a wide view of Earth. During intense magnetic storms, however, energetic particles from the outer belt can surge into the slot region.
SET will survey the slot region, providing some of the first day-to-day weather measurements of this particular neighborhood in near-Earth space. The mission also studies the fine details of how radiation damages instruments and tests different methods to protect them, helping engineers build parts better suited for spaceflight. Ultimately, SET will help other missions improve their design, engineering and operations to avoid future problems, keeping our space technology running smoothly as possible.
For more on our space weather research, follow @NASASun on Twitter and NASA Sun Science on Facebook.
Meet the other NASA missions launching on the Department of Defense’s STP-2 mission and get the latest updates at nasa.gov/spacex.
Make sure to follow us on Tumblr for your regular dose of space: http://nasa.tumblr.com.
1K notes
·
View notes
Text
Hurricanes Have No Place to Hide, Thanks to Better Satellite Forecasts
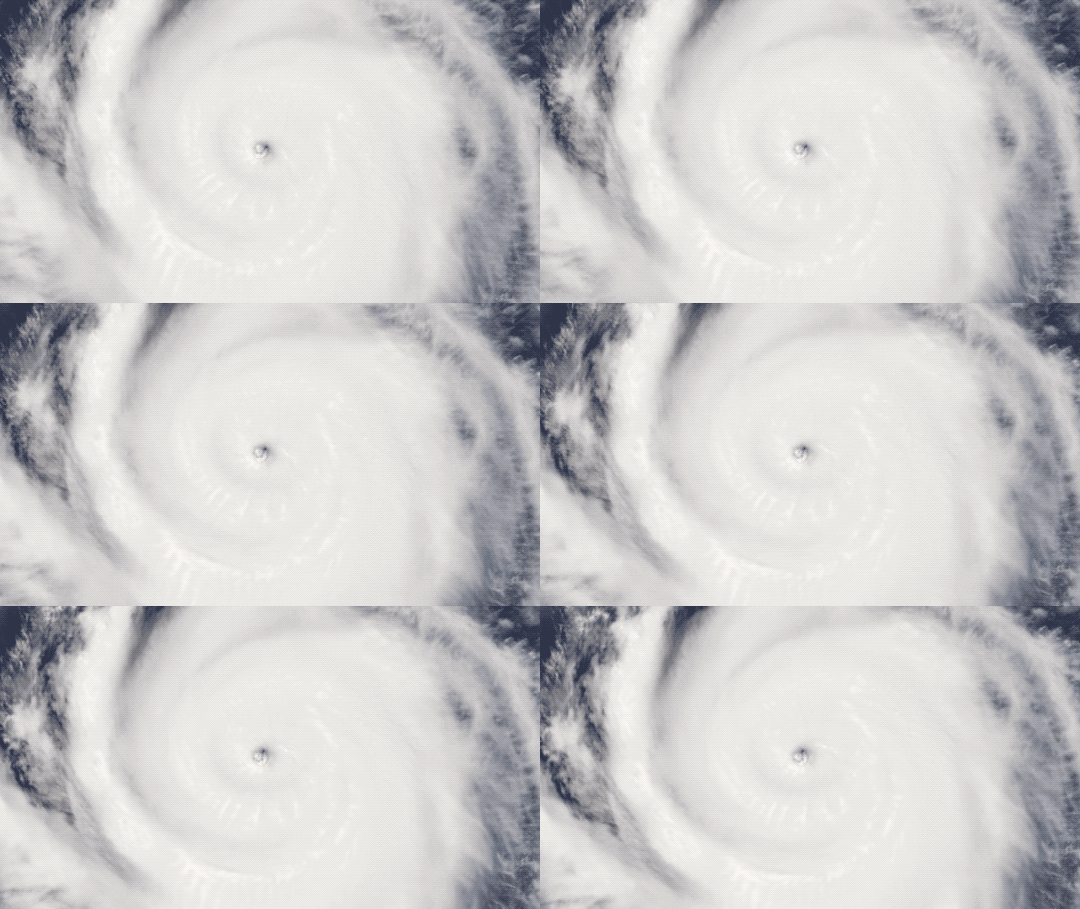
If you’ve ever looked at a hurricane forecast, you’re probably familiar with “cones of uncertainty,” the funnel-shaped maps showing a hurricane’s predicted path. Thirty years ago, a hurricane forecast five days before it made landfall might have a cone of uncertainty covering most of the East Coast. The result? A great deal of uncertainty about who should evacuate, where it was safe to go, and where to station emergency responders and their equipment.

Over the years, hurricane forecasters have succeeded in shrinking the cone of uncertainty for hurricane tracks, with the help of data from satellites. Polar-orbiting satellites, which fly nearly directly above the North and South Poles, are especially important in helping cut down on forecast error.

The orbiting electronic eyeballs key to these improvements: the Joint Polar Satellite System (JPSS) fleet. A collaborative effort between NOAA and NASA, the satellites circle Earth, taking crucial measurements that inform the global, regional and specialized forecast models that have been so critical to hurricane track forecasts.

The forecast successes keep rolling in. From Hurricanes Harvey, Irma and Maria in 2017 through Hurricanes Florence and Michael in 2018, improved forecasts helped manage coastlines, which translated into countless lives and property saved. In September 2018, with the help of this data, forecasters knew a week ahead of time where and when Hurricane Florence would hit. Early warnings were precise enough that emergency planners could order evacuations in time — with minimal road clogging. The evacuations that did not have to take place, where residents remained safe from the hurricane’s fury, were equally valuable.

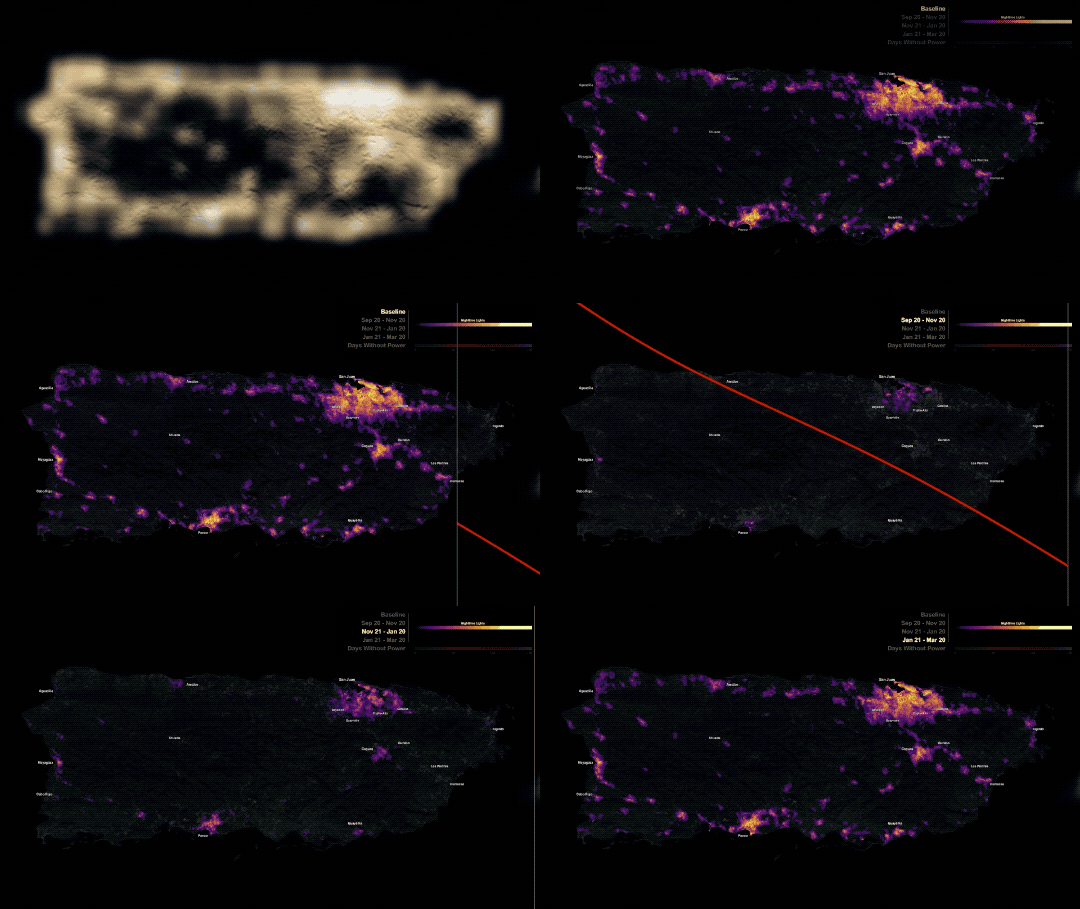
The satellite benefits come even after the storms make landfall. Using satellite data, scientists and forecasters monitor flooding and even power outages. Satellite imagery helped track power outages in Puerto Rico after Hurricane Maria and in the Key West area after Hurricane Irma, which gave relief workers information about where the power grid was restored – and which regions still lacked electricity.
Flood maps showed the huge extent of flooding from Hurricane Harvey and were used for weeks after the storm to monitor changes and speed up recovery decisions and the deployment of aid and relief teams.

As the 2019 Atlantic hurricane season kicks off, the JPSS satellites, NOAA-20 and Suomi-NPP, are ready to track hurricanes and tropical cyclones as they form, intensify and travel across the ocean – our eyes in the sky for severe storms.
For more about JPSS, follow @JPSSProgram on Twitter and facebook.com/JPSS.Program, or @NOAASatellites on Twitter and facebook.com/NOAASatellites.
Make sure to follow us on Tumblr for your regular dose of space: http://nasa.tumblr.com.
2K notes
·
View notes
Text
Catching up part 2:
A friend of mine sent me this photo looking towards Orland Park. About 5-10 minutes before funnel clouds were reported.

I didn’t know it at the time, but this is the back end of the storm that almost hit my neighborhood and dropped a tornado in Dyer Indiana, as well as possibly Sauk Villiage and/or Crete.


at about 4:30 I saw the radar for the first time in 20 minutes and started to book it towards home.


By now the storm was across the Indiana border and we were out of danger.

-Mod Dusty
0 notes
Text
Playing a little catch up... (part 1)
I meant to post these photos yesterday, but between the weather and finishing report cards, and then following the tornadoes in and around Dayton, I didn’t.

This was the sky about 1:00PM as I’m driving west towards my gig.

at 1:28 (thanks phone) the storm blowing in was a severe thunderstorm.

I took this right after the sirens went off and the circulation was moving into our area. There wasn’t a funnel, but it was rotating very clearly as it blew over.

the trees obscured our view, but it really organized as it moved from our area into Lockport and Orland Park.
-Mod Dusty
0 notes
Video
youtube
Reader embersofkymillo asks:
Hey FYFD, could you do some analysis/explanations behind the physics of this vortex stuff? I love when you do spots on Slow Mo Guys vids and figured I’d share a recent one w you
I enjoy doing that, too! So let’s talk a little about vortices. What Dan’s tea stirrer is doing is creating a low-pressure core for a vortex. We can see just how strong that low pressure region is by the way it sucks the air-water interface down toward the spinning arms. Eventually the interface and stirrer meet, and what was once a single, smooth(ish) surface gets torn into a myriad of bubbles. (As an aside, those bubbles get loud.)
I also like the sequence of sugar cube drops because they make for some very cool splashes. Notice how the orientation of the cube’s edges as it hits determines the shape of the inital splash curtain. The asymmetry borne out of that impact actually follows through all the way through the seal of the cavity behind the cube. It reminds me of this oldie-but-goodie video on drops hitting different shapes. (Video and image credit: The Slow Mo Guys; submitted by embersofkymillo)


192 notes
·
View notes
Photo

That was one of the clearest hooks I’ve seen on radar this season. Still waiting to see if any tornadoes were confirmed.
-Mod Dusty
2 notes
·
View notes
Text
There were some intense storms around Chicago today. I’ll be uploading photos and a video later, as soon as I get them off my phone.
-Mod Dusty
0 notes
Video
discovertornadoes
Wow, beautiful waterspout captured from Sochi Russia! 🌪 📸@kaxa_mikava_
603 notes
·
View notes
Photo

Super cell over Tornado Alley. While storm chasing, Marko Korošec captured this superb image near Julesburg, Colorado on May 28th, 2013. Mr. Korošec explained that the storm was predicted to produce a tornado but one never touched land. He has dubbed this image “Independence Day” as the storm structure reminded him of the spaceships from the (excellent) 1996 movie. This image was grand-prize winner of the 2014 National Geographic Traveler Photo Contest and rightly so! -Jean
815 notes
·
View notes


