
Don't wanna be here? Send us removal request.
Statistics
We looked inside some of the posts by suninblogs and here's what we found interesting.
Average Info
Notes Per Post
2
Likes Per Post
2
Reblog Per Post
0
Reply Per Post
0
Time Between Posts
7 hours
Number of Posts By Type
Text
3
Last Seen Tumblr Blogs


Fun Fact
The total number of visits Tumblr.com received during January 2021 is 327 million.
Text
Analysis of Macroeconomic indicators affecting GDP per capita
Preliminary statistical analysis:
Results
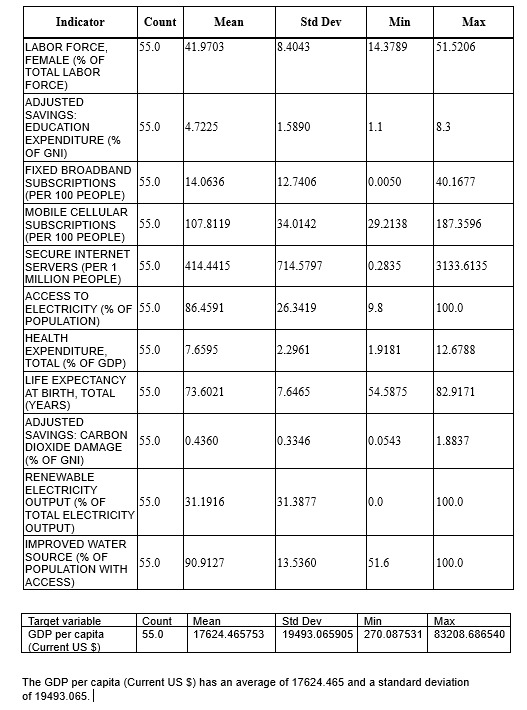
Descriptive statistics: descriptive statistics of all the predictor variables under the study and the target variable. The statistics obtained is after data cleaning.
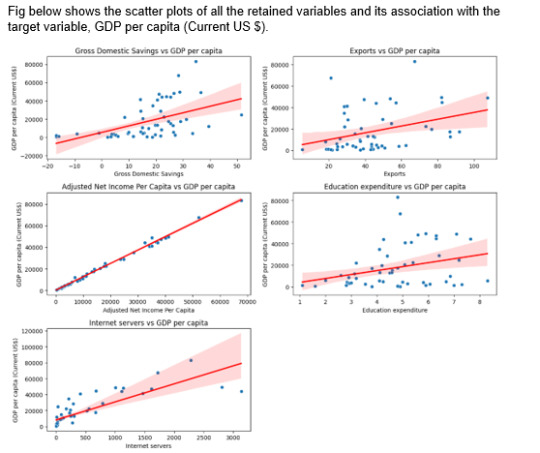
Bivariate analysis :Scatter plots are visualized to understand the association between individual quantitative predictor variables and GDP Per Capita,(Current US$) .Pearson correlation “r” values were calculated for the associations. The Adjusted Net Income Per Capita has the highest r value 0.997289 and p value= 9.550028e-62 which is close to 0.
Lasso regression analysis:
Using Lasso regression analysis, out of 24 predictor variables only 5 strongest predictor variables are retained in the model. The retained variables are:
ADJUSTED NET NATIONAL INCOME PER CAPITA (CURRENT US$)
GROSS DOMESTIC SAVINGS (% OF GDP)
EXPORTS OF GOODS AND SERVICES (% OF GDP)
SECURE INTERNET SERVERS (PER 1 MILLION PEOPLE)
ADJUSTED SAVINGS: EDUCATION EXPENDITURE (% OF GNI)
and rest of the predictor variables are eliminated as they remain insignificant and are shrunk to 0.0 after Lasso regression.
Initially prior to Lasso regression it is observed that Personal Remittance paid had the highest mean but post Lasso regression this variable is shrunk to 0. Lasso doesn’t just look at raw coefficients, it balances predictive accuracy with sparsity. It selectively shrinks coefficients based on their relative importance in explaining the variance of the dependent variable. If the high-mean variable is not strongly predictive (i.e., it is highly correlated with other predictors or adds little unique information), Lasso may shrink its coefficient aggressively.
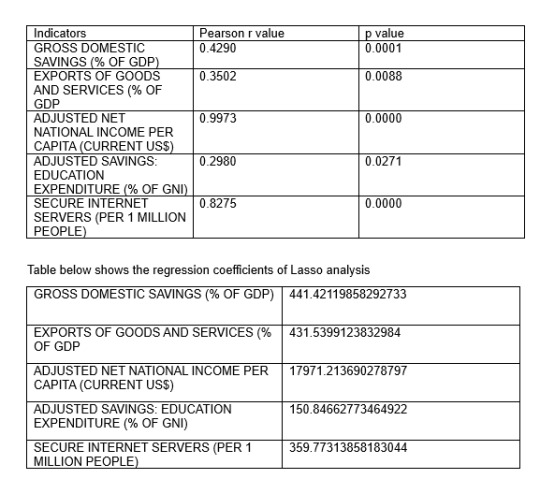
The strongest predictors are Adjusted Net National Income Per Capita (Current US$) followed by Gross Domestic Savings (% of GDP) and so on. Hence, these are the most significant predictors that have a positive influence on GDP per capita and help boost the nation’s economy.
Together, these 5 predictors accounted for 99.4 % accuracy in the training set and 99.5% accuracy in test set. Also, the mean squared error (MSE) for the test data (MSE= 2769007.811 differed slightly from the MSE for the training data (MSE= 1520763.18).
0 notes
Text
Analysis of Macroeconomic indicators affecting GDP per capita
Sample:
This World Bank data set is a subset of data extracted from the primary World Bank collection of development indicators, compiled from officially-recognized international sources. It presents the most current and accurate global development data available, and includes national, regional and global estimates. The data set used consists of over 80 variables on N=248 countries where all variables have valid data observations for minimum of 190 countries for the years 2012 and 2013. However, in this study, I am relying on sample data of the year 2012.
Measures:
Gross Domestic Product (GDP) is a key economic indicator that represents the total monetary value of all goods and services produced within a country's borders over a specific time period. It is used to gauge the health and size of the economy. GDP per capita is a measure of a country's economic output divided by its population. The Gross Domestic Product (GDP) per capita in current US Dollars is the quantitative target variable.
Listed below are the macroeconomic predictors, all being quantitative used for the analysis:
Variable Label x140_2012 GDP GROWTH (ANNUAL %) x146_2012 GROSS DOMESTIC SAVINGS (% OF GDP) x131_2012 FOREIGN DIRECT INVESTMENT, NET INFLOWS (% OF GDP) x121_2012 EXPORTS OF GOODS AND SERVICES (% OF GDP) x154_2012 IMPORTS OF GOODS AND SERVICES (% OF GDP) x161_2012 INDUSTRY, VALUE ADDED (% OF GDP) x35_2012 AGRICULTURE, VALUE ADDED (% OF GDP) x179_2012 MANUFACTURING, VALUE ADDED (% OF GDP) x162_2012 INFLATION, CONSUMER PRICES (ANNUAL %) x11_2012 ADJUSTED NET NATIONAL INCOME PER CAPITA (CURRENT US$) x212_2012 PERSONAL REMITTANCES, RECEIVED (CURRENT US$) x211_2012 PERSONAL REMITTANCES, PAID (CURRENT US$) x86_2012 COMMERCIAL BANK BRANCHES (PER 100,000 ADULTS) x169_2012 LABOR FORCE, FEMALE (% OF TOTAL LABOR FORCE) x16_2012 ADJUSTED SAVINGS: EDUCATION EXPENDITURE (% OF GNI) x126_2012 FIXED BROADBAND SUBSCRIPTIONS (PER 100 PEOPLE) x187_2012 MOBILE CELLULAR SUBSCRIPTIONS (PER 100 PEOPLE ) x261_2012 SECURE INTERNET SERVERS (PER 1 MILLION PEOPLE) x1_2012 ACCESS TO ELECTRICITY (% OF POPULATION) x150_2012 HEALTH EXPENDITURE, TOTAL (% OF GDP) x173_2012 LIFE EXPECTANCY AT BIRTH, TOTAL (YEARS) x12_2012 ADJUSTED SAVINGS: CARBON DIOXIDE DAMAGE (% OF GNI) x253_2012 RENEWABLE ELECTRICITY OUTPUT (% OF TOTAL ELECTRICITY OUTPUT) x156_2012 IMPROVED WATER SOURCE (% OF POPULATION WITH ACCESS)
Target variable: x142_2012 GDP PER CAPITA (CURRENT US $)
Analyses:
Descriptive statistics for all the predictors and the GDP Per Capita, (Current US$) (target variable) were evaluated by calculating the mean, standard deviation and minimum and maximum values as all are the variables are quantitative in nature.
Scatter plots were plotted to examine the bivariate associations between individual quantitative predictors and the GDP Per Capita, (Current US$), target variable. Also, Pearson correlation values are calculated and examined.
Further, Lasso regression with the least angle regression selection algorithm was used to identify the subset of variables that best predicted GDP Per Capita,(Current US$). Lasso regression is used in this analysis as it selects the best features, reduces overfitting, and improves prediction accuracy by shrinking less important feature coefficients to zero. The lasso regression model was estimated on a training data set consisting of a random sample of 70% and a test data set included the other 30% of the batches. All predictor variables were standardized to have a mean=0 and standard deviation=1 prior to conducting the lasso regression analysis. Cross validation was performed using k-fold cross validation specifying 10 folds. The change in the cross validation mean squared error rate at each step was used to identify the best subset of predictor variables. Predictive accuracy was assessed by determining the mean squared error rate of the training data prediction algorithm when applied to observations in the test data set.
0 notes
Text
Analysis of Macroeconomic indicators affecting GDP per capita
Project title:
Analysis of Macroeconomic indicators affecting GDP per capita
Research question:
What are the key macroeconomic indicators that significantly impact GDP per capita?
Motivation/rationale:
GDP (Gross Domestic product) per capita plays a vital role in shaping a nation’s economy. There are several indicators that influence the GDP of a country. I believe that macroeconomic indicators such as Investment and Savings, Trade and economic activity, Labour market, Finance & Banking sector, Infrastructure & Technology, Health, Environment, etc have a major influence on country’s GDP. Therefore, this study aims to analyse the influence of macroeconomic indicators on GDP per capita and identify the significant predictors.
Implications:
Answering the research question will help in understanding the key macroeconomic indicators that influence the GDP per capita and guide the policymakers to formulate strategies and take data- driven decisions to enhance growth of GDP per capita.
2 notes
·
View notes