#Bollinger Squeeze
Video
youtube
Mastering Forex Trading Unleashing Profit Potential with the Bollinger B...
0 notes
Text
4 Trade Ideas for Caterpillar: Bonus Idea

Caterpillar, $CAT, comes into the week at short term resistance in a pullback and over the 20 day SMA for the first time in over a month. The Bollinger Bands® are squeezed in, often a precursor to a move and it has retraced 38.2% of the last leg higher. It has a RSI at the midline and rising, a positive divergence, with the MACD crossed up and rising but negative. There is resistance at 333.50 and 337.50 then 351.50 and 355.50 before 364 and 373 with the all-time high at 379.30 above that. Support lower is at 330 and 325 then 321. Short interest is low at 2.4%.
The stock pays a dividend with an annual yield of 1.69% and will trade ex-dividend n July 24th. The company is expected to report earnings next on July 30th. The July options chain shows biggest open interest at the 330 strike on the put side and at the 350 call strike. The August chain shows open interest spread from 330 to 280, biggest at 290 then 310, on the put side. On the call side it is biggest at 330 then fades to 370. The September chain has biggest open interest at the 290 put and the 330 call strikes.
Caterpillar, Ticker: $CAT

Trade Idea 1: Buy the stock on a move over 333.50 with a stop at 321.
Trade Idea 2: Buy the stock on a move over 333.50 and add an August 320/310 Put Spread ($3.00) while selling the September 380 Call ($2.90).
Trade Idea 3: Buy the July/August 340 Call Calendar ($6.80) while selling the July 325 Puts ($2.70).
Trade Idea 4: Buy the September 320/340/370 Call Spread Risk Reversal (30 cents).
Start of Summer Annual Sale! Hi all the Start of Summer Annual Sale is entering its last day at Dragonfly Capital. Get an annual subscription for 38.2% off or pay quarterly for 15% off. Both auto-renew at that discounted rate until you decide to leave.
After reviewing over 1,000 charts, I have found some good setups for the week. These were selected and should be viewed in the context of the broad Market Macro picture reviewed Friday which with the 2nd Quarter of 2024 in the books and heading into the holiday shortened week, saw equity markets showing resilience with a rebound from a pullback and large caps and tech names holding at the highs.
Elsewhere look for Gold to continue its consolidation after the record move higher while Crude Oil consolidates in a broad range. The US Dollar Index continues the short term move to the upside while US Treasuries continue in their secular downtrend. The Shanghai Composite looks to continue the downtrend while Emerging Markets consolidate under long term resistance.
The Volatility Index looks to remain very low and stable making the path easier for equity markets to the upside. Their charts look strong, especially on the longer timeframe. On the shorter timeframe both the QQQ and SPY are showing signs of a possible reset on momentum measures as both are extended. The IWM continues to lag in a long term channel. Use this information as you prepare for the coming week and trad’em well.
44 notes
·
View notes
Text
Bitcoin’s ‘Squeezed’ Bollinger Bands Predict Possible $190K BTC Value
Key Points
Bitcoin’s price could potentially surge to $190,000 due to intense volatility, according to Julien Bittel, head of macro research at Global Macro Investor.
This prediction is based on the current state of Bollinger Bands, a key volatility indicator, which suggests a significant price movement may be imminent.
Julien Bittel, head of macro research at Global Macro Investor, has hinted at a significant surge in the price of Bitcoin.
According to Bittel, the price of Bitcoin could reach up to $190,000 due to the current state of the Bollinger Bands, a key volatility indicator.
The Role of Bollinger Bands
Bittel notes that the Bollinger Bands are unusually tight at present.
This has only happened twice before, in April 2016 and July 2023, and on both occasions, it was followed by a significant increase in Bitcoin’s price.
The Bollinger Bands measure market volatility and the strength of price trends, and their current narrow range suggests a potential for a significant price movement.
If the pattern repeats, Bitcoin’s price could target a range between $140,000 and $190,000.
Bollinger Bands have previously suggested a substantial price increase in the current market cycle.
In late 2023, a similar scenario occurred just before a surge to local highs, which was followed by the introduction of U.S. spot Bitcoin exchange-traded funds (ETFs).
Recent Performance and Future Predictions
As of July 19, Bitcoin was trading at around $64,000, up 11% over the past week.
Despite growing confidence among traders and indicators pointing to continued bullish momentum, some skepticism remains due to the lack of mainstream retail investor participation.
Trader Rekt Capital suggests that September could be a critical month for Bitcoin’s potential breakout, based on historical cycles.
Analysts, including Glassnode co-founder Negentropic and Scott Melker, also known as “The Wolf of All Streets”, have expressed bullish sentiments about Bitcoin.
Negentropic maintains a bullish outlook, targeting the $69,000 to $74,000 range as the next potential price levels.
Melker has identified bullish signals on shorter timeframes, while analyst Moustache has pointed out a bullish cross on Bitcoin’s monthly chart, similar to the setup before the 2017 bull run.
Despite recent gains, Bitcoin faces strong resistance around the $65,000 level.
Market technician Aksel Kibar has noted that Bitcoin’s ability to stay close to this resistance without a significant drop is a positive long-term sign.
In the short term, Bitcoin’s price appears to be consolidating within a narrow range, with the upcoming weekend potentially bringing increased volatility and setting the stage for a notable price movement.
0 notes
Text
XRP Set To Skyrocket 60,000% On Tightest Bollinger Bands Ever
In an evaluation shared through X and YouTube, crypto analyst Matt “The Nice Mattsby” Hughes highlighted what might be a historic transfer for the XRP worth, primarily based on the Bollinger Bands indicator. Hughes factors to an impending squeeze in XRP’s month-to-month Bollinger Bands, suggesting a possible spike just like earlier rallies the place the cryptocurrency noticed large…
0 notes
Text
On-chain datalar, Bitcoin madencilerinin son vakitlerde bir sefer daha satışa yaptığını gösteriyor. Birtakım analistlere nazaran bunun da BTC fiyatının düşmesine yol açması mümkün.Bitcoin madenci rezervi düşüyor, BTC çökecek mi?Bir CryptoQuant analisti, BTC madenci rezervinin son vakitlerde çıkışlara şahit olduğunu söylüyor. Bu metriğin bedeli yükseldiğinde, bu Blockchain doğrulayıcılarının şu anda adreslerine kripto para aktardığı manasına gelir. Bu cins bir eğilim madencilerin birikim yaptığının bir işareti olabilir. Hasebiyle varlığın fiyatı için yükseliş manasına gelir.Öte yandan, düşüş eğilimi gösteren gösterge, madencilerin şu anda BTC’yi cüzdanlarından çıkardığını gösteriyor. Genel olarak, bu yatırımcılar satışla ilgili emeller için rezervlerinden coin çekerler. Bu nedenle, bu türlü bir eğilim muhtemelen kripto paranın kıymeti için düşüş istikametinde sonuçlar doğurur. Mevcut tartışma bağlamında, madenci rezervinin kendisi değil, daha çok “değişim oranı” (ROC) ilgi caziptir. Bu metrik, belli bir periyot boyunca madenci rezervindeki yüzde değişimlerini takip eder. Burada ilgili periyot 14 günlük bir periyottur. Aşağıda, son birkaç ay içinde Bitcoin madenci rezervlerinin 14 günlük ROC’sindeki eğilimi gösteren bir grafik yer alıyor.Metriğin bedeli son günlerde negatif / Kaynak: CryptoQuantYukarıdaki grafikte de gördüğünüz üzere, madenci rezervinin 14 günlük ROC pahası, Bitcoin’in 30.000 dolar düzeyinin üzerine çıktığı geçen ay yeşil renkteydi. Göstergenin bu olumlu bedelleri madenci rezervinin süratle arttığı manasına geliyor. Lakin bu ayın birinci haftasında metrik negatife dönerek, madenci rezervinin azalmaya başladığını ima etti. Göstergenin bedeli kırmızı kaldığı için madenciler o vakitten beri cüzdanlarından coin çekmeye devam etmiş üzere görünüyor. Madenci rezervinin 14 günlük ROC’si son vakitlerde kayda kıymet kırmızı bedellerde olmaya devam ediyor. Bu Blockchain doğrulayıcılarının satışlarını şimdi bırakmamış olmaları mümkün.Büyük Bitcoin hareketi önümüzde: Üst mı aşağı mı?On-cahin bilgi sağlayıcısı olan Glassnode, bugün Bitcoin piyasasının mevcut durumuna dikkat çekti. Bu doğrultuda, epey düşük bir dalgalanma ortamına işaret etti. 20 günlük Bollinger Bantları, üst ve alt bantları ayıran sadece %4,2’lik bir fiyat aralığı ile çok bir ‘squeeze’ yaşıyor. Bu durum, Bitcoin’in şu anda hudutlu bir fiyat hareketi devrinde olduğunu gösteriyor. Ayrıyeten, “Ocak ayı başındaki sakinlikten bu yana en sessiz Bitcoin piyasası olduğunu” işaret ediyor.20 günlük Bitcoin Bollinger Bantları / Kaynak: GlassnodeBollinger Bantlarının sıkışması, azalan süreç hacimleriyle birleştiğinde, Bitcoin piyasasında artan bir baskı senaryosu yaratıyor. Süreç hacmi azaldıkça, bu sarmal yayda depolanan potansiyel güç ağırlaşıyor. CryptoCon’daki analistlere nazaran, şu anda tercih edilmesi gereken senaryo yükseliş senaryosu. Analistler, “Ayı piyasasında Bitcoin volatilitesi düştüğünde, bu çok aşağı taraflıdır. Bir boğa piyasasında volatilite düştüğünde, bu delicesine yükseliş manasına gelir,” diyor. Analistlere nazaran, Bitcoin yeni bir boğa piyasasının başlangıcında olduğundan, üst tarafta güçlü bir hareket mümkün.Bitcoin fiyatı yatay süreç görüyor, 1 günlük grafik / Kaynak: TradingViewBTC’nin haftalık fiyat trendlerinin kodu!SEC-XRP durumunun çözülmesinin akabinde Bitcoin boğaları başlangıçta heyecanlandı. Lakin, fiyat evvelki düzeylerine geri dönmeden evvel kısa bir mühlet yükseldi. Şu anda Bitcoin, ralli öncesiyle tıpkı düzeylerde süreç görüyor. Bununla birlikte, gelecekte mevcut yapıdan bir bozulma olması olası. Uzmanlara nazaran, bu da potansiyel bir düzeltmeye yol açacak. Yaklaşan Fed pivotu piyasanın şekillenmesinde çok kıymetli bir rol oynayacak. Bu yüzden, yatırımcılar değerli bir çöküşe hazırlıklı olmalı.Son gelişmeler kurumsal yatırımcıların alım baskısını artırdığını gösteriyor. Bu da bir sonraki boğa koşusunun başlangıcı hakkında spekülasyonlara yol açıyor. Cheeky Crypto’ya nazaran, arka arda dördüncü hafta boyunca Bitcoin belli bir direnç düzeyinin ötesine geçemedi.
Üst bölgeyi test etmesine karşın, fiyat 31.848 doların üzerindeki arz bölgesini kırmakta zorlandı. Şayet Bitcoin Fed’in pivotundan evvel 40,000 dolar üzere daha yüksek fiyat düzeylerine ulaşmayı başarırsa, bu durum piyasanın bir sonraki düşüşüne karşı belirli bir müdafaa sağlayacaktır. Öte yandan, BTC Fed pivotundan evvel 20.000 ila 21.000 dolar aralığında bir bilakis dönüş yaşarsa, evvelki düşük düzeyleri test edecektir.Usta analistten Bitcoin uyarısı: Işıklar sönebilir!DonAlt takma isimli analist, piyasa için olumlu gelişmelere karşın, Bitcoin rallisinin sona yaklaşıyor olduğunu söylüyor. Analist, BTC için muhtemelen ufukta bir ölçü zayıflık olduğunu kaydediyor. DonAlt, Bitcoin’in 30.000 doların altına inmesi halinde, spot bazlı BTC borsa yatırım fonu (ETF) duyurularını, BlackRock CEO’su Larry Fink’in bu hususta olumlu konuşmasını ve ABD Menkul Değerler ve Borsa Komisyonu’nun (SEC) Ripple’a karşı açtığı davada olumlu karar çıkmasını görmezden geleceğini tabir ediyor. Bu bağlamda analist, şu açıklamasına şu tarafta devam ediyor:…Bu kayayı ne pompalayabilir? Boğalar burada büyük bir adım atmalı yoksa 20.000 doların imkansız olmadığını düşünüyorum.DonAlt, gücünü korumak ve yeni doruklara ulaşma bahtına sahip olmak için BTC’nin 33.000 doların üzerinde kapanması gerektiğini söylüyor. Aksi takdirde, 29.500 dolar işaretinin altında bir kapanış, başkan kripto için uyguna işaret olmayacak. Buradan hareketle analist, şu değerlendirmeyi paylaşıyor:Piyasaya kısaca bir göz atalım: Bence burada durum karışık, hem boğaların hem de ayıların talihi var. 29.500 doların altındaki kapanışlar makûs görünecektir. BTC’nin ETF momentumunu muhafazası gerekiyor. 33.000 doların üzerinde kapanır ve ETF kuyruk rüzgarıyla tüm vakitlerin en yüksek aralığına geri döneriz. Ben karışmadan evvel piyasanın bunu çözmesine müsaade vereceğim.Kaynak: DonAlt/Twitter
0 notes
Text
Harnessing Volatility: Understanding Bollinger Bands in Trading

Introduction:
In the world of technical analysis, traders rely on various tools and indicators to make informed decisions about buying and selling securities. One such popular tool is Bollinger Bands, developed by John Bollinger in the 1980s. Bollinger Bands are a versatile technical indicator that helps traders analyze volatility, identify potential price reversals, and gauge market trends. Understanding how to interpret and apply Bollinger Bands can empower traders to navigate the complexities of the financial markets more effectively.
What are Bollinger Bands?
Bollinger Bands consist of three lines plotted on a price chart: a middle band and two outer bands. The middle band is typically a simple moving average (SMA) of the security's price over a specified period, while the outer bands are positioned above and below the middle band at a certain distance, usually two standard deviations away. The distance between the outer bands and the middle band fluctuates based on the volatility of the security, expanding during periods of high volatility and contracting during periods of low volatility.
Interpreting Bollinger Bands:
Bollinger Bands serve multiple purposes in technical analysis, providing valuable insights into the market's volatility, trend direction, and potential reversal points.
Volatility Measurement:
One of the primary functions of Bollinger Bands is to measure volatility. When the bands widen, it indicates increased volatility in the market, while narrowing bands suggest decreasing volatility. Traders can use this information to adjust their trading strategies accordingly, such as adopting more conservative approaches in volatile markets or seeking opportunities for breakout trades when volatility expands.
Trend Identification:
Bollinger Bands can also help traders identify market trends and their strength. In an uptrend, prices tend to stay above the middle band and occasionally touch or exceed the upper band, signaling strong bullish momentum. Conversely, in a downtrend, prices typically remain below the middle band and occasionally test or breach the lower band, indicating robust bearish sentiment. Traders can look for confirmation of trend direction by analyzing other technical indicators or price action signals in conjunction with Bollinger Bands.
Reversal Signals:
Another valuable aspect of Bollinger Bands is their ability to generate signals for potential price reversals. When prices touch or penetrate the outer bands, it suggests that the security may be overbought or oversold, respectively, and could experience a reversal in the near term. Traders often look for confirmation signals, such as candlestick patterns or momentum oscillators, to validate potential reversal opportunities identified by Bollinger Bands.
Trading Strategies with Bollinger Bands:
Several trading strategies can be implemented using Bollinger Bands, depending on the trader's objectives, risk tolerance, and market conditions. Some common strategies include:
Bollinger Band Squeeze: This strategy involves waiting for the bands to contract, indicating low volatility, followed by a breakout when the bands expand, signaling a potential price movement. Traders may enter long or short positions depending on the direction of the breakout, using stop-loss orders to manage risk.
Mean Reversion: In this strategy, traders anticipate that prices will revert to the mean (middle band) after touching or breaching the outer bands. They may enter counter-trend trades when prices reach the outer bands, aiming to profit from the expected price retracement towards the middle band.
Trend Following: Traders can use Bollinger Bands to identify trends and ride the momentum by entering trades in the direction of the trend when prices bounce off the middle band or break through the outer bands. They may employ additional trend-confirming indicators to filter out false signals and increase the probability of successful trades.
Risk Management and Limitations:
While Bollinger Bands offer valuable insights into market dynamics, they are not foolproof and may produce false signals or misinterpretations, especially during choppy or range-bound market conditions. Traders should exercise caution and combine Bollinger Bands with other technical indicators or fundamental analysis to validate their trading decisions and mitigate risks.
Conclusion:
Bollinger Bands are a powerful tool in the arsenal of technical traders, providing valuable insights into volatility, trend direction, and potential reversal points in the financial markets. By understanding how to interpret and apply Bollinger Bands effectively, traders can enhance their decision-making process, identify high-probability trading opportunities, and manage risk more adeptly. However, like any technical indicator, Bollinger Bands should be used in conjunction with other tools and analysis methods to form a comprehensive trading strategy tailored to individual preferences and market conditions. With diligent practice and disciplined execution, traders can harness the predictive power of Bollinger Bands to achieve greater success and profitability in their trading endeavors.
0 notes
Text
What are Bollinger Bands?
Bollinger Bands, developed by John Bollinger in the 1980s, are a pivotal tool in technical analysis for stock trading. These bands provide a volatility indicator, measuring a security's price relative to past trades.
The concept revolves around volatility, gauged through standard deviation, which adjusts with market fluctuations.
As prices surge, the bands widen, while they contract during declines. Their dynamic nature makes them versatile across various securities.
Calculation
To understand Bollinger Bands®, it's essential to comprehend the calculation behind them. The process begins with computing the simple moving average (SMA) of the security, typically based on a 20-day SMA.
This SMA averages the closing prices for the initial 20 days, with subsequent data points adjusting as new information arrives.
Next, we determine the standard deviation of the security price. Standard deviation, a fundamental statistical concept, measures the average variance within a dataset. By taking the square root of the variance, we derive the standard deviation.
What Do Bollinger Bands® Tell You?
Bollinger Bands® provide valuable insights into market conditions, particularly regarding volatility and potential overbought or oversold scenarios.
Traders often interpret the proximity of prices to the upper or lower bands as indications of market sentiment. When prices approach the upper band, it may suggest an overbought market, while proximity to the lower band could indicate oversold conditions.
John Bollinger, the creator of Bollinger Bands®, has outlined a set of rules to guide traders in utilizing these bands effectively.
The Squeeze
One central concept of Bollinger Bands® is the "squeeze," occurring when the bands constrict around the moving average.
This period of low volatility is often considered a precursor to increased volatility and potential trading opportunities. Conversely, wider bands signal decreased volatility, potentially prompting traders to consider exiting positions.
Breakouts
Approximately 90% of price action occurs between the two bands of Bollinger Bands®. Breakouts, occurring when prices move beyond these bands, are significant events.
However, it's crucial to note that breakouts themselves do not provide directional cues for future price movement. Traders should exercise caution and consider other factors in their decision-making process.
Example
Visualizing Bollinger Bands® in action can enhance understanding. In a typical chart, these bands encapsulate the 20-day SMA of a stock, illustrating price movements relative to volatility.
As market volatility increases, the bands widen, while less volatile periods lead to band contraction.
W-Bottoms and M-Tops
Bollinger Bands facilitate the identification of W-Bottoms and M-Tops, patterns indicative of potential trend reversals.
W-Bottoms form near or below the lower band, followed by a rebound towards the middle band, signaling a bullish reversal. Conversely, M-Tops occur near or above the upper band, foreshadowing a bearish reversal.
Limitations
While Bollinger Bands® offer valuable insights, they are not infallible and come with limitations. Traders should not rely solely on them as a standalone trading system but rather integrate them with other indicators for a comprehensive analysis.
John Bollinger himself recommends combining Bollinger Bands® with two or three non-correlated indicators to enhance signal accuracy.
Additionally, the use of a 20-day SMA and two standard deviations may not suit all market conditions, necessitating adjustments based on individual preferences and market dynamics.
Bollinger Bands® FAQs
Which Indicators Work Best with Bollinger Bands®?
Bollinger Bands® complement various technical indicators, with popular choices including the relative strength index (RSI) and the BandWidth indicator.
Traders often use BandWidth to identify Bollinger Squeezes, indicating periods of low volatility and potential breakout opportunities.
How Accurate Are Bollinger Bands®?
Given their construction around two standard deviations from an SMA, Bollinger Bands® offer a statistical framework where approximately 95% of price action is expected to fall within the bands. However, traders should exercise caution and not solely rely on Bollinger Bands® for trading decisions.
What Time Frame Is Best Used With Bollinger Bands®?
Bollinger Bands® typically employ a 20-day moving average, providing a balanced perspective on short to medium-term price movements.
https://ezyforextrading.com/learn-trading/bollinger-bands/?feed_id=3963&_unique_id=65c374ceb15b8&EzyForexTrading
0 notes
Text
Dogecoin Faces Bollinger Band Squeeze, Prompts Cryptocurrency Expert's Predictions
The world of Dogecoin is experiencing a notable shift as market analyst Ali highlights a rare event in the cryptocurrency's trading pattern. Ali points out the unprecedented tightening of Bollinger Bands on the four-hour DOGE chart, a phenomenon not observed since October 2023. This development suggests an impending spike in Dogecoin's market volatility, prompting investors and traders to closely watch these indicators for potential significant movements in the price trajectory of the meme coin.
As of the latest update, Dogecoin's price stands at $0.07804, reflecting a decrease of 0.83% over the last 24 hours. However, the trading volume has reached a substantial $197 million, signaling increased investor engagement. With a market capitalization of $11.15 billion, Dogecoin maintains its position among the top ten cryptocurrencies.
Over the past week, Dogecoin has been navigating beneath a significant long-term trend line, fluctuating between $0.0750 and $0.0900. Despite this volatility, market analysts maintain a positive outlook on Dogecoin's future, acknowledging the potential ups and downs it may face. The broader market sentiment leans towards bullish prospects, even as Dogecoin encounters resistance in its attempt to breach the $0.0800 level.
Market analysis suggests that sustaining a closing price above the $0.0800 resistance could lead to a rebound, pushing Dogecoin to the $0.0900 mark and potentially reaching the crucial $0.095 level. Surpassing these resistance levels might propel Dogecoin toward the $0.1 threshold, contingent on maintaining upward momentum in the market.
On the contrary, failure to surpass the $0.0800 mark may result in a downward trend. Immediate support lies around $0.0750, with a critical support level at $0.0700. A break below this point could see Dogecoin sliding towards the $0.0710 level. The current Average Directional Index (ADX) stands at 19, suggesting a potential increase in market activity, while the Relative Strength Index (RSI) for DOGE/USD, currently below the 50 mark, indicates a neutral market position.
0 notes
Text
Imminent Bitcoin Price Surge Predicted by Market Participant

Bitcoin (BTC) may be on the verge of a price increase, according to market participant Matthew Hyland. He highlighted two indicators, Bollinger bands and the relative strength index (RSI), as suggesting a short-term turnaround. The narrowing Bollinger bands on the daily timeframe indicate an upcoming surge in volatility, while the RSI is currently below the overbought threshold, leaving room for price growth. However, there is a bearish trend flip possibility with the moving average convergence divergence (MACD) on three-day timeframes.
Hyland's analysis indicates that Bitcoin's price could soon experience a bullish movement. Previous instances of the Bollinger bands squeezing resulted in upward price movements in the past. Additionally, the RSI, a momentum indicator, is currently at a level that historically preceded price increases. However, the MACD could potentially disrupt these bullish predictions if it confirms a bearish trend flip. It remains to be seen how the price will react in the coming days.
Read more
0 notes
Text
As September draws to a close, Bitcoin enthusiasts are eyeing potential bullish trends, with indications pointing towards a positive trajectory. The leading cryptocurrency has already exhibited a bullish candle this month, suggesting a possible continuation of this trend into October if the candle closes in the green.
Bitcoin Trend Reversal
Amidst these developments, market veteran John Bollinger, the creator of the widely used market indicator Bollinger Bands, shared his insights on Thursday. In a tweet, the 73-year-old noted that a two-bar reversal occurred for $BTCUSD at the lower Bollinger Band on September 11/12, which he believed to be a crucial technical factor.
Bollinger further tweeted;
“This is a good setup for a walk up the upper band, just need a bit more strength to confirm.” To provide a visual context for his statement, he also shared the chart below.
In addition to Bollinger Bands, other Bitcoin fundamentals have also been falling into place. Crypto analyst Matthew Hayland noted in Friday tweet that the two-week Bollinger Bands for Bitcoin have reached their tightest levels since 2015, and they are currently the tightest ever recorded.
Historically, when such tight squeezes occur, they are often followed by explosive price movements, catching many by surprise. Hayland also mentioned that he has been closely monitoring the weekly Bollinger Band width, which has also tightened significantly.
Positive Signs in Bitcoin’s Performance
Beyond Bollinger Bands, Bitcoin’s overall performance has displayed positive signs. Gert van Lagen, anther crypto analyst, highlighted a crucial bullish cross in Bitcoin’s moving averages. Via a Thursday tweet, he mentioned that the 200-day Simple Moving Average (SMA) has crossed above the 200-week SMA, which is seen as a bullish signal. This follows a bullish crossover that occurred in June involving the faster daily 200 and Weekly 200 exponential moving averages (EMAs).
That said, combined, these technical indicators and expert opinions have brought renewed optimism to the Bitcoin market, suggesting the potential for an upward surge.
In the meantime, Bitcoin remained in a state of tight consolidation following a price pullback that occurred after an impressive surge beyond $27,000 on Thursday. At press time, BTC was trading at $26,864, reflecting a 0.70% decrease over the past 24 hours.
0 notes
Text
What to expect from the stock market this week

Last week, the review of the macro market indicators saw heading into the unofficial end of summer and with August in the books, that equity markets showed a preference for some rest after the 3 week move higher. Elsewhere looked for Gold ($GLD) to continue its uptrend while Crude Oil ($USO) consolidated in a tightening range. The US Dollar Index ($DXY) continued to bounce to the upside while US Treasuries ($TLT) consolidated in their downtrend. The Shanghai Composite ($ASHR) looked to continue the downtrend while Emerging Markets ($EEM) consolidated over support in a possible start of a new uptrend.
The Volatility Index ($VXX) looked to remain low and stable making the path easier for equity markets to the upside. Their charts looked strong, especially on the longer timeframe. On the shorter timeframe the week long consolidation left the $SPY with only 2 hours to rocket to just shy of a new all-time high close while the $QQQ and the $IWM ended near the high of the week. All were prepped to start September stronger.
The week played out with Gold holding at the highs in consolidation while Crude Oil broke down to a nearly 10 month low. The US Dollar fell back from its quick bounce while Treasuries rose to test the December 2023 high. The Shanghai Composite fell to a 7 month low while Emerging Markets broke support to hit a 1 month low.
Volatility rose Monday out of the teens and held the rest of the week. This put pressure on equities and they responded by moving lower all week and closing the mid-August gaps. This resulted in the SPY, the QQQ and the IWM confirming lower highs as recession fear overtook the market. What does this mean for the coming week? Let’s look at some charts.
SPY Daily, $SPY

The SPY came into the week holding in consolidation just under the all-time high. It dropped Tuesday touching the 50 day SMA and held there through Thursday before a second big fall Friday closed the mid-August gap down. It closed at the lowest level since August 13th. The RSI is falling below the midline after making a lower high with the MACD crossed down but positive. The Bollinger Bands® are squeezing in with price now closing in on the 100 day SMA.
The weekly chart shows the confirmation of a reversal with a strong move lower following the doji. It ended at the 20 week SMA. There is also a momentum divergence with the RSI making a lower high as price made a higher high. The RSI remains bullish over the midline with the MACD positive but moving lower. There is support lower at 540 and 537 then 534 and 530 before 524.50 and 520.50. Resistance higher is at 542 and 545.75 then 549.50 and 556.50 before 561.50 and 565.50. Broad Consolidation with Possible Change of Character.
SPY Weekly, $SPY

With the first week of September in the books, equity markets reverted to weakness, trending lower all week. Elsewhere look for Gold to continue its uptrend while Crude Oil continues to move lower. The US Dollar Index continues in broad consolidation while US Treasuries show signs of a possible new uptrend. The Shanghai Composite looks to continue the downtrend while Emerging Markets drop back into a short term downtrend.
The Volatility Index looks to shift from low and stable to low and rising making the path more difficult for equity markets. Their charts look weak om the shorter time frame as price pulls back from a lower high, but they remain above making a lower low for now. On the longer timeframe they look stronger, but vulnerable with the SPY strongest then the IWM and the QQQ the weakest. Use this information as you prepare for the coming week and trad’em well.
Join the Premium Users and you can view the Full Version with 20 detailed charts and analysis: Macro Week in Review/Preview September 6, 2024
7 notes
·
View notes
Text
Crypto Daily Trade Signals: A Beacon Amidst the Cryptocurrency Storm
Cryptocurrencies have become a prominent player in the global financial landscape, captivating investors with their potential for extraordinary returns. However, the volatile nature of the crypto market can be both a blessing and a curse, as it presents lucrative opportunities alongside significant risks. For traders looking to navigate this ever-changing terrain, crypto daily trade signals serve as a guiding light, offering valuable insights to make informed decisions and optimize their trading strategies.
Unraveling Crypto Daily Trade Signals
Crypto daily trade signals are real-time notifications or alerts that suggest potential trading opportunities in the cryptocurrency market. These signals are usually generated by advanced algorithms, technical analysis tools, or experienced traders who analyze market data, trends, and historical patterns to identify promising entry and exit points for specific cryptocurrencies.
The Significance of Crypto Daily Trade Signals
Time Efficiency: The crypto market operates 24/7, making it impossible for traders to monitor it continuously. Crypto daily trade signals come to the rescue by providing timely alerts, saving traders from constant vigilance and allowing them to capitalize on opportunities in real-time.
Objective Analysis: Emotions often cloud judgment when it comes to trading decisions. Crypto daily trade signals rely on data and technical indicators, mitigating the influence of emotions and promoting a rational approach to trading.
Risk Management: Trade signals often come with predefined stop-loss and take-profit levels, helping traders manage risk effectively and protect their capital in the unpredictable crypto market.
Accessibility: Trade signals cater to traders of all levels, including beginners who may lack experience in technical analysis. They provide an accessible pathway to participate in the crypto market with some degree of guidance.
Diverse Types of Crypto Daily Trade Signals
Moving Averages Crossovers: This type of signal involves two moving averages, typically a short-term and a long-term one. When the short-term moving average crosses above the long-term moving average, it generates a bullish signal, and vice versa for a bearish signal.
RSI and Stochastic Oscillators: These momentum-based indicators measure overbought and oversold conditions in the market. An RSI reading above 70 indicates overbought conditions, while a reading below 30 suggests oversold conditions.
Bollinger Bands Squeezes and Expansions: Bollinger Bands are volatility indicators. A squeeze, where the bands narrow, suggests lower volatility and is often followed by a breakout with higher volatility when the bands expand.
Fibonacci Retracement Levels: These signals are based on Fibonacci ratios and are used to identify potential support and resistance levels in a cryptocurrency's price chart.
Ichimoku Cloud: This comprehensive indicator offers insights into support/resistance levels, trend direction, and potential entry/exit points, providing a holistic view of the market.
Important Considerations
Validation and Research: While trade signals are useful, traders should validate them with their analysis and research. Relying solely on signals may lead to missed opportunities and hinder personal growth as a trader.
Risk Awareness: The crypto market remains highly unpredictable, and there are no guarantees of profits. Traders must be aware of the risks involved and trade with money they can afford to lose.
Selecting Reliable Providers: With the popularity of trade signals, numerous providers have emerged. Traders should exercise caution and choose reputable sources with a track record of accuracy.
Adaptability: Market conditions change rapidly, and not all signals will lead to successful trades. Traders must remain flexible and adapt their strategies as the market evolves.
In conclusion, crypto daily trade signals are valuable tools for traders navigating the complex and volatile world of cryptocurrencies. By incorporating these signals into their trading strategy and complementing them with personal research and analysis, traders can increase their chances of success and uncover profitable opportunities amidst the stormy seas of the crypto market. However, prudent risk management and continuous learning remain essential for long-term trading prosperity.
0 notes
Text
Bollinger Bands Strategy Guide to Trading Success Trading

The key to success in the ever-changing world of trading is the ability to anticipate market moves and make calculated choices. Bollinger Bands is a popular strategy among traders because of its flexibility and efficiency. This in-depth manual will teach you everything you need to know to use this trading strategy successfully.
An Overview of the Bollinger Bands Strategy

Bollinger Bands Strategy
The Bollinger Bands Strategy is defined as follows.
John Bollinger created the Bollinger Bands strategy in the 1980s as a technical analysis tool. Its purpose is to aid traders in determining when to enter and quit the market. The process employs a triangular plot with a simple moving average in the center and two lines at different standard deviations above and below it. This produces a moving border around the price activity, giving traders a graphical depiction of the market's condition.
Where Bollinger Bands Came From and Why They Matter in Trading
Technical analyst veteran John Bollinger first popularized the Bollinger Bands.
The strategy's value comes from its ability to quantify market volatility and provide benchmarks for a price high or low. Because of its importance in spotting trading opportunities and controlling risk, this data is a must-have for investors.
Learning How Bollinger Bands Are Made
Bollinger Bands include three primary parts:
The Center Line: This short moving average is a foundation for the upper and lower bands. As a symbol of the trend in the medium term, it is often a point of support or resistance.
Overbought conditions are indicated by a move above the Upper Band, which may be seen as a signal to reduce holdings. When the price of an asset reaches or passes this level, it may be a sign that it is overvalued and that a decline in its value is likely.
As indicated by the Lower Band presence, Oversold situations may signal a good time to purchase. Price action around or crossing this level may tell that the asset is underpriced, and a price rise is likely.

Top Methods For Using Bollinger Bands
Profitable Trading Requires Recognizing The Bollinger Squeeze
Top Methods for Using Bollinger Bands
Profitable Trading Requires Recognizing the Bollinger Squeeze
An essential part of the Bollinger Bands strategy is the Bollinger Squeeze. This happens when there is less volatility in the market and the bands' contract. When the band's arrangement is like this, volatility increases, causing significant price swings. Squeezes like this may provide profitable trading chances, so traders watch for them.
Taking Advantage of Market Volatility with the Bollinger Bounce
Another crucial idea essential to the Bollinger Bands strategy is the Bollinger Bounce.
That's jargon for how often prices "bounce" between the two bands. Markets whose prices tend to fluctuate between a specific high and low might benefit significantly from recognizing this trend.
Why RSI and Bollinger Bands Work So Well Together
The efficiency of your trading strategy may be improved by integrating Bollinger Bands with the Relative Strength Index (RSI). The Relative Strength Index (RSI) is a momentum oscillator that evaluates the price change rate. Used in tandem with Bollinger Bands, it may corroborate the signals given by the bands, lowering the chance of receiving a false signal and increasing the strategy's overall dependability.
Strategy for Using Bollinger Bands
Preparing Your Trading Platform Using Bollinger Bands
Bollinger Bands are a standard indicator on most trading platforms. Please select it from the list of possible hands, then tweak the parameters to your liking. Bollinger Bands have two standard deviations for the upper and lower bands and a 20-day simple moving average for the center line. But you may tweak these parameters to suit your trading preferences and time horizon.
Bollinger Bands: An Introduction and Explanation
Bollinger Bands are easy to understand and apply.
A widening of the bands shows increased market volatility. Conversely, narrower bands are indicative of lower volatility. Prices tend to fluctuate towards the bands during high volatility and shift closer to the center line during low volatility.
Traders might utilize these insights to spot future market openings. When the price reaches the top band, it may be time to sell, while when it goes to the lower band, it may be time to purchase. These signals, however, should be double-checked with other indications to ensure their accuracy.
Divergence, convergence, and other high-level methods
Expert traders often use Bollinger Bands to search for divergence and convergence patterns. When the price and band trends are heading in opposing directions, we have divergence; when they run similarly, we see convergence. These patterns may help traders spot good opportunities by revealing information about possible market reversals.
Bollinger Bands and Compatible Indicators
Bollinger Bands and Simple Moving Averages: A Powerful Combination
Smoothing out price data using moving averages makes it worthwhile in technical analysis since patterns become more apparent. When combined with Bollinger Bands, these indicators are helpful for trading. For instance, a trading opportunity may present when the price moves above or below a moving average line.

An Unbeatable Combination: Macd And Bollinger Bands
An Unbeatable Combination: MACD and Bollinger Bands
Another common technique that combines nicely with Bollinger Bands is the Moving Average Convergence Divergence (MACD). The Moving Average Convergence Divergence (MACD) is a momentum indicator that tracks price trends. When used with Bollinger Bands, it may corroborate the signals provided by the bands, making their signs more trustworthy.
A Potent Combination of the Relative Strength Index (RSI) and Bollinger Bands
The Relative Strength Index (RSI) is a momentum oscillator that evaluates the price change rate. By highlighting overbought and oversold circumstances, Bollinger Bands may serve as a helpful trading indication. When the price reaches the upper band and the RSI shows overbought events, this is an excellent time to sell.
Analysis of Bollinger Bands' Performance
The Reasons Why Bollinger Bands Are So Popular With Traders
Because of their adaptability, Bollinger Bands are often used in trading. They are helpful for both short-term traders and long-term investors since they can be used across all markets and time durations. And since they show the market situation graphically, even inexperienced traders can understand them.
Using Bollinger Bands Successfully in Real-World Trading Scenarios
Bollinger Bands have been used successfully by many traders. This trading strategy has shown itself successful time and time again, as seen by these examples of its use. Examples of this use include the identification of overbought/oversold circumstances in range-bound markets and the identification of breakouts in turbulent markets.
What Bollinger Bands Can't Tell You and How to Fix It
Bollinger Bands, like any other trading technique, has its limits. For instance, they may give out misleading readings during high volatility. A disciplined trading strategy and supplementary indicators help traders get beyond these restrictions. Combining Bollinger Bands with other indicators like the Relative Strength Index (RSI) or the Moving Average Convergence Divergence (MACD) may assist in eliminating spurious signals and boost the strategy's consistency.
Improving Your Use of Bollinger Bands
How to Use Price Movement with Bollinger Bands
The term "price action" describes the fluctuations in the value of securities, which are often shown in real-time on a chart. Bollinger Bands are helpful, but you may get more insight into market behavior by including price action in your strategy. For instance, pin bars and engulfing patterns are two examples of price action patterns that may indicate a market reversal. Strong trading signals may be generated by the appearance of such patterns at the band's upper or lower boundary.
Bollinger Bands and the Importance of Candlestick Patterns Trading
Potential market reversals might be predicted with the use of candlestick patterns. Bollinger Bands help determine when to enter and leave a market. For example, in the lower band, a bullish engulfing pattern might indicate a buying chance, while near the higher bar, a bearish engulfing pattern could indicate a selling opportunity.
The Importance of Risk Management in Bollinger Bands Trading
A successful trading strategy must prioritize risk control. Stop-loss orders may
Control losses and gains can be cashed at predefined points. Stop-loss orders may be placed above the upper band or below the lower band when using Bollinger Bands to guard against potentially disastrous price swings. Similarly, take-profit orders might be placed in the opposite band to benefit from price increases.
Market Conditions and Bollinger Bands
Market Trends and Bollinger Bands
Bollinger Bands help determine when to enter and leave moving markets. The upper and lower bands can serve as shifting support and resistance zones. In an upward trend, for instance, a price that encounters resistance at the lower Bollinger Bands may rebound off that level and proceed toward the upper Bands, creating a purchasing opportunity. When prices fall, they can bounce off the upper band and go back down, creating a selling opportunity.
The Breakout Strategy for Bollinger Bands in Choppy Markets
Bollinger Bands are helpful in sideways markets because they reveal stretches of low volatility that usually precede a breakthrough. Investors might use this data to be ready for any price shifts. For instance, if the bands narrow, it may be a precursor to a breakthrough. When a breakout occurs, traders may cash in by placing entry orders either above the upper band or below the lower band.
Bollinger Bands: Riding the Waves in Turbulent Markets
When market volatility is high, Bollinger Bands widen to account for more price movement. Investors might use this data in their trading techniques. They may, for instance, increase the distance between their stop-loss and take-profit levels in anticipation of the higher levels of volatility.
Different Trading Strategies Using Bollinger Bands
Bollinger Bands for Swing Trading: Taking Advantage of Price Movements
Swing traders may use Bollinger Bands to forecast price changes. The higher and lower bands represent possible turning points. For instance, a chance to sell may present itself when the price increases to the upper band. The same holds for the bottom band, as a price touching that level may indicate a possible upward movement and a purchasing opportunity.

Using Bollinger Bands
Using Bollinger Bands for Intraday Trading
Day traders may use Bollinger Bands to monitor temporary price shifts. The strategy may aid in providing signs for entering and leaving markets quickly. For instance, a touch of the upper band may indicate a short-term selling opportunity, while a touch of the lower band may indicate a short-term purchasing opportunity.
Using Bollinger Bands Patiently for Long-Term Gains
Bollinger Bands may help long-term investors see possible shifts in the market's long-term trend. Signals for promising long-term investments may be gleaned by using the strategy. For instance, if the price stays above the upper band for an extended time, it may indicate a robust upward trend and a promising chance for long-term investment. Similarly, if prices stay below the lower range for an extended time, it may indicate a significant negative trend and provide an opportunity for short sellers.
Successfully Using Bollinger Bands, Final Thoughts
Bollinger Bands is a strategy that calls for time and dedication to master. However, if you take the time to learn how it works, you can use it to your advantage in the trading world, bolstering your strategy while increasing your earnings. In trading, remember that finding opportunities is just half the battle; the other half is risk management. Never put more money at risk in the market than you can afford to lose.
Read the full article
#BollingerBands#ForexTrading#MACD#MarketTrends#MovingAverage#PriceAction#RSI#StandardDeviation#TechnicalAnalysis#TradingSignals#TradingStrategy#Volatility
0 notes
Text
John Bollinger's Bitcoin Warning: Brace for a Bollinger Bands Squeeze https://t.co/G6wzKRT8yX
John Bollinger’s Bitcoin Warning: Brace for a Bollinger Bands Squeeze https://t.co/G6wzKRT8yX
— Patrick Rooney (@patrickrooney)
Apr 7, 2023
https://platform.twitter.com/widgets.js
from Twitter https://twitter.com/patrickrooney
View On WordPress
0 notes
Text
Giao dịch forex khi nút thắt cổ chai Bollinger Band
Nút thắt cổ chai Bollinger Band là một khái niệm tương đối hay ho trong giao dịch thị trường. Điểm đặc biệt của phương pháp này bởi vì nó là một chiến lược giao dịch trung lập và được sử dụng để có thể kiếm tìm một sự break ở thời điểm tiếp theo. Vậy thì Bollinger Band Squeeze là gì? Cách giao dịch khi xảy ra hiện tượng này ra sao? Tất cả sẽ được giải đáp qua bài viết sau đây của Forex Dictionary.
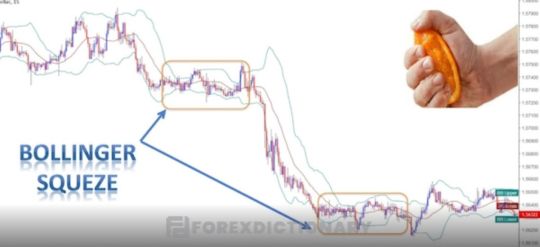
https://forexdictionary.com/nut-that-co-chai-bollinger-band/
0 notes
Text
'Big move brewing' for BTC price? Bitcoin may stay flat, hints analyst

The Bitcoin Bollinger Band "squeeze" is not a firm indicator of a breakout, says the metric's creator.
from Cointelegraph.com News https://ift.tt/6iPwnlT
0 notes
Last Seen Blogs

dog-boarding-with-a-family
Dog Boarding With A Family

uncheminquichemine
Un chemin qui chemine

ludy-86
Sem título

documentsforsale
Untitled

gloriousbae
𝐆𝐥𝐨𝐫𝐢𝐨𝐮𝐬