#CSV file to table example
Explore tagged Tumblr posts
Visit Tumblr Blog
Explore Tumblr blogs with no restrictions, modern design and the best experience.
Last Seen Tumblr Blogs


Fun Fact
Tumblr’s reach among the 26-to-35-year-olds in the US is 11%.
Text
Build a Dynamic Dashboard Using VBA and Excel
In today’s fast-paced business world, data visualization and automation have become essential tools for professionals. One of the most powerful ways to combine both is by creating dynamic dashboards using VBA in Excel. With the right VBA (Visual Basic for Applications) skills, you can automate data processing and build interactive dashboards that update with just one click.
In this blog, we'll explore how you can build a dynamic Excel dashboard using VBA, step-by-step. We’ll also show you how you can upgrade your skills with expert training from Innozant Institute, a leading name in smart tech learning.
🧩 What is a Dynamic Dashboard?
A dynamic dashboard is an interactive visual representation of your data that updates in real-time or with minimal manual effort. It includes charts, pivot tables, buttons, drop-downs, and reports that respond to user inputs like date selection, product filter, or region.
Unlike static reports, dynamic dashboards can be reused, refreshed, and reused with just a few clicks. And when combined with Excel VBA automation, they become even more powerful.
🛠️ Why Use VBA in Dashboards?
While Excel’s native tools like PivotTables and slicers are helpful, VBA offers added flexibility. Here’s what VBA can do:
Automate data import and cleanup
Dynamically refresh charts and PivotTables
Hide/show sheets, rows, and columns based on selections
Trigger actions with buttons or UserForms
Save or send dashboard reports in PDF or email
In short, VBA gives life to your static Excel files and makes your dashboards dynamic and intelligent.
📊 Step-by-Step: Build a Dynamic Dashboard Using VBA
Let’s look at how to build a simple yet dynamic sales dashboard using Excel and VBA.
Step 1: Prepare the Data
First, get your data ready. It could be from an Excel sheet, a database, or even an imported CSV file. Make sure it’s well structured — rows for records and columns for fields like Date, Region, Product, Sales, etc.
Step 2: Insert PivotTables and Charts
Use Excel’s built-in PivotTable feature to summarize your data — total sales by region, top products, monthly sales trends. Then, insert PivotCharts based on these tables.
To make the dashboard dynamic, we’ll now connect it with VBA.
Step 3: Add Form Controls (Buttons, Drop-downs)
Go to the Developer Tab in Excel and insert buttons and drop-downs. For example:
Combo box to select Region
Button to refresh data
Button to export dashboard as PDF
Name these controls so you can reference them in your VBA code.
Step 4: Open VBA Editor and Write Code
Press ALT + F11 to open the VBA editor. Create a new module and add code like:
Sub RefreshDashboard()
Sheets("Dashboard").PivotTables("SalesPivot").PivotCache.Refresh
MsgBox "Dashboard Updated!"
End Sub
You can also automate chart updates, formatting, and data filters. Connect your buttons to the macros via "Assign Macro."
Step 5: Add Export or Email Option
Want to share your dashboard? Try this code:
Sub ExportDashboardToPDF()
Sheets("Dashboard").ExportAsFixedFormat Type:=xlTypePDF, Filename:="Sales_Report.pdf"
MsgBox "Dashboard Exported as PDF!"
End Sub
This allows users to download or email the dashboard as a professional PDF report — all from within Excel.
Step 6: Build a UserForm for Advanced Control
Using a VBA UserForm, you can let users select multiple filters (like date range, region, or category) and click a button to view updated results. This adds a sleek, app-like feel to your Excel file.
🎯 Real-World Uses of Dynamic Dashboards
Sales Teams: Track targets, product performance, and regional trends
HR Departments: Monitor hiring status, attrition, and employee engagement
Finance Teams: Compare monthly expenses, profits, and forecasts
Project Managers: View project timelines, milestones, and risks
With just a bit of VBA, your Excel file becomes a powerful business intelligence tool.
📚 Learn Excel VBA Dashboard Design at Innozant Institute
Want to master the art of Excel VBA dashboards? Join Innozant Institute, the fastest-growing training hub for data, digital, and tech skills. Our Excel VBA course covers:
Macro recording and editing
VBA syntax, loops, and conditions
Working with charts, forms, and events
Creating real-time dashboards
Automating reports and emails
✅ Live Projects ✅ Expert Trainers ✅ Hybrid (Online + Offline) Classes ✅ Placement Support
Whether you’re a student, working professional, or business owner, Innozant Institute can help you upgrade your skills and boost your career.
🚀 Final Thoughts
Creating a dynamic dashboard using VBA in Excel is not only fun but also incredibly useful in real-world business situations. It gives you more control, automation, and speed.
If you want to go beyond the basics and become an Excel automation expert, start learning VBA today — and there’s no better place than Innozant Institute to begin that journey.
0 notes
Text
From List to Data: A Beginner’s Guide to Data Transformation
In today’s data-driven world, transforming raw information into structured formats is a critical skill. One common task in data processing is converting a list—a simple, unstructured sequence of values—into structured data that can be analyzed, visualized, or stored. A “list” might be a shopping list, a sequence of names, or numbers collected from user inputs. “Data,” in contrast, refers to a structured format such as a table, database, or dataset. The goal of transforming a list to data is to make it usable for insights, automation, or further manipulation. Understanding this process helps beginners make sense of how information is organized in software systems, spreadsheets, or databases. It’s not just a programming task—it’s a foundational part of digital literacy.
Why Converting Lists to Data Matters
Lists are everywhere: in text files, spreadsheets, form submissions, or even copied from emails. But these lists often need structure before they can be used. Structured data can be sorted, filtered, analyzed, or even turned into charts. For example, if you receive a list of customer names and purchases, it’s just raw text until it’s organized into phone number data and columns—where each row is a customer and each column is a data point like name, item, or price. Without this transformation, automation tools, machine learning models, or even basic Excel functions can’t work effectively. Converting lists to structured data enables better decisions, reporting, and scaling of workflows.

Simple Tools for List-to-Data Conversion
You don’t need to be a coder to transform lists into data. Tools like Microsoft Excel, Google Sheets, or Notepad++ make this easy. For example, using the "Text to Columns" feature in Excel, you can split list items into cells. In Google Sheets, functions like SPLIT() and ARRAYFORMULA() help break down and reorganize text. Online tools like CSV converters also turn lists into structured CSV files. These steps make it easier for users to handle raw data without complex scripts. Beginners can start with drag-and-drop interfaces and learn basic data formatting.
Moving Beyond Basics: Automation with Python and Scripts
Once you’re comfortable with basic tools, learning to automate list-to-data conversions with scripting languages like Python is a powerful next step. Python libraries such as pandas make it simple to import a list from a file and convert it into a DataFrame—a table-like data structure. For example, if you have a list stored in a .txt file, Python can read it, parse it using string functions, and format it into rows and columns automatically. This is especially useful when handling large or repetitive data. Automating the process not only saves time but also reduces human error. It opens the door to building entire data pipelines, integrating APIs, or performing advanced analysis.
0 notes
Text
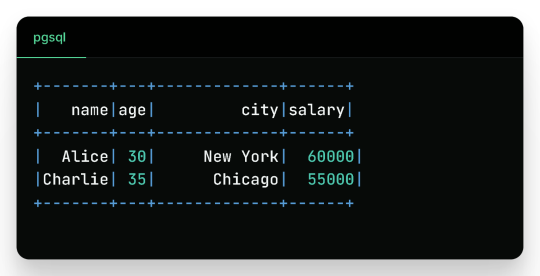
Pandas DataFrame Tutorial: Ways to Create and Manipulate Data in Python Are you diving into data analysis with Python? Then you're about to become best friends with pandas DataFrames. These powerful, table-like structures are the backbone of data manipulation in Python, and knowing how to create them is your first step toward becoming a data analysis expert. In this comprehensive guide, we'll explore everything you need to know about creating pandas DataFrames, from basic methods to advanced techniques. Whether you're a beginner or looking to level up your skills, this tutorial has got you covered. Getting Started with Pandas Before we dive in, let's make sure you have everything set up. First, you'll need to install pandas if you haven't already: pythonCopypip install pandas Then, import pandas in your Python script: pythonCopyimport pandas as pd 1. Creating a DataFrame from Lists The simplest way to create a DataFrame is using Python lists. Here's how: pythonCopy# Creating a basic DataFrame from lists data = 'name': ['John', 'Emma', 'Alex', 'Sarah'], 'age': [28, 24, 32, 27], 'city': ['New York', 'London', 'Paris', 'Tokyo'] df = pd.DataFrame(data) print(df) This creates a clean, organized table with your data. The keys in your dictionary become column names, and the values become the data in each column. 2. Creating a DataFrame from NumPy Arrays When working with numerical data, NumPy arrays are your friends: pythonCopyimport numpy as np # Creating a DataFrame from a NumPy array array_data = np.random.rand(4, 3) df_numpy = pd.DataFrame(array_data, columns=['A', 'B', 'C'], index=['Row1', 'Row2', 'Row3', 'Row4']) print(df_numpy) 3. Reading Data from External Sources Real-world data often comes from files. Here's how to create DataFrames from different file formats: pythonCopy# CSV files df_csv = pd.read_csv('your_file.csv') # Excel files df_excel = pd.read_excel('your_file.xlsx') # JSON files df_json = pd.read_json('your_file.json') 4. Creating a DataFrame from a List of Dictionaries Sometimes your data comes as a list of dictionaries, especially when working with APIs: pythonCopy# List of dictionaries records = [ 'name': 'John', 'age': 28, 'department': 'IT', 'name': 'Emma', 'age': 24, 'department': 'HR', 'name': 'Alex', 'age': 32, 'department': 'Finance' ] df_records = pd.DataFrame(records) print(df_records) 5. Creating an Empty DataFrame Sometimes you need to start with an empty DataFrame and fill it later: pythonCopy# Create an empty DataFrame with defined columns columns = ['Name', 'Age', 'City'] df_empty = pd.DataFrame(columns=columns) # Add data later new_row = 'Name': 'Lisa', 'Age': 29, 'City': 'Berlin' df_empty = df_empty.append(new_row, ignore_index=True) 6. Advanced DataFrame Creation Techniques Using Multi-level Indexes pythonCopy# Creating a DataFrame with multi-level index arrays = [ ['2023', '2023', '2024', '2024'], ['Q1', 'Q2', 'Q1', 'Q2'] ] data = 'Sales': [100, 120, 150, 180] df_multi = pd.DataFrame(data, index=arrays) print(df_multi) Creating Time Series DataFrames pythonCopy# Creating a time series DataFrame dates = pd.date_range('2024-01-01', periods=6, freq='D') df_time = pd.DataFrame(np.random.randn(6, 4), index=dates, columns=['A', 'B', 'C', 'D']) Best Practices and Tips Always Check Your Data Types pythonCopy# Check data types of your DataFrame print(df.dtypes) Set Column Names Appropriately Use clear, descriptive column names without spaces: pythonCopydf.columns = ['first_name', 'last_name', 'email'] Handle Missing Data pythonCopy# Check for missing values print(df.isnull().sum()) # Fill missing values df.fillna(0, inplace=True) Common Pitfalls to Avoid Memory Management: Be cautious with large datasets. Use appropriate data types to minimize memory usage:
pythonCopy# Optimize numeric columns df['integer_column'] = df['integer_column'].astype('int32') Copy vs. View: Understand when you're creating a copy or a view: pythonCopy# Create a true copy df_copy = df.copy() Conclusion Creating pandas DataFrames is a fundamental skill for any data analyst or scientist working with Python. Whether you're working with simple lists, complex APIs, or external files, pandas provides flexible and powerful ways to structure your data. Remember to: Choose the most appropriate method based on your data source Pay attention to data types and memory usage Use clear, consistent naming conventions Handle missing data appropriately With these techniques in your toolkit, you're well-equipped to handle any data manipulation task that comes your way. Practice with different methods and explore the pandas documentation for more advanced features as you continue your data analysis journey. Additional Resources Official pandas documentation Pandas cheat sheet Python for Data Science Handbook Real-world pandas examples on GitHub Now you're ready to start creating and manipulating DataFrames like a pro. Happy coding!
0 notes
Text
🚀 Power BI MySQL Integration: The Ultimate No-Code Guide to Real-Time Analytics
📈 Why Power BI MySQL Integration is a Game-Changer
In today’s data-first world, real-time insights are more than a luxury—they’re a necessity. According to recent studies, 80% of companies are investing in data analytics to gain a competitive edge. Without accurate, up-to-date data, business decisions can miss the mark.
That's why integrating your MySQL database with Power BI can be a total game-changer.
Imagine pulling live sales data from MySQL straight into Power BI dashboards—no manual exports, no code, no delays. It’s not just about saving time (though it can cut reporting time in half)—it’s about making better, faster, smarter decisions.

🔍 What is Power BI and MySQL? Why Should You Care?
Before jumping into the “how,” let’s understand the “why.”
💡 Power BI: The Visual Storyteller
Power BI is a powerful data visualization tool by Microsoft. It helps you create interactive dashboards, reports, and analytics that help decision-makers see the bigger picture.
🗃️ MySQL: The Backbone of Your Data
MySQL is one of the world’s most popular open-source relational database systems. It can handle massive amounts of structured data—and it’s the go-to for many organizations' back-end systems.
🤝 The Magic of Integration
By connecting Power BI to MySQL, you combine MySQL’s data storage strength with Power BI’s visualization brilliance. That means:
Real-time reporting
Automated dashboards
Zero manual effort
And the best part? With Konnectify, you don’t need to write a single line of code to get started.
⚙️ What You Need for Power BI MySQL Integration
To get your integration up and running, you’ll need:

🧩 How to Connect Power BI to MySQL (Step-by-Step)
Let’s walk through how to get everything set up—whether you’re a data novice or a pro.
Step 1: Download MySQL Workbench
Start by managing your MySQL databases with MySQL Workbench. You can download it from the official MySQL site.
Step 2: Install the MySQL ODBC Connector
You’ll need the MySQL ODBC driver so Power BI can connect to your MySQL database.
Go to MySQL's official site and download the ODBC Connector for Windows or Mac.
Install it and take note of the DSN name you create.
Step 3: Connect MySQL to Power BI Desktop
Open Power BI Desktop
Click Get Data > MySQL Database
Enter your server address and database name
Authenticate using your credentials
Click Connect, and boom—your MySQL tables are now visible in Power BI
🔄 Automate Data Sync Between Power BI and MySQL with Konnectify
Manual syncing is a thing of the past. Here’s how to automate the entire workflow using Konnectify:
Step-by-Step Konnectify Setup
Log into Konnectify Go to your Konnectify dashboard and sign in.
Choose MySQL from the App Marketplace
Set Your Trigger Example: "New data entry in MySQL."
Create Your Action Example: "Create row in Power BI dashboard."
Customize Workflow Use Konnectify’s visual editor to map fields, add filters, and set conditions.
Activate It Click "Activate" and your workflow starts running 24/7.
Now, every time your MySQL database updates, Power BI reflects it instantly—zero manual work.
🔎 Real-World Use Cases for Power BI and MySQL Integration
Let’s explore how different departments can use this integration to transform workflows and drive results.
1. 📊 Automate Financial Reports in Power BI
With Konnectify pulling MySQL data into Power BI:
Financial dashboards update automatically
No need to manually extract CSV files
Get real-time metrics like revenue, expenses, and profit margins
Organizations using real-time analytics saw a 20% increase in operational efficiency.
2. 💸 Analyze Sales Performance with Live MySQL Data
Sales teams can monitor:
Conversion rates
Customer acquisition cost
Regional performance
Power BI helps visualize this sales data and spot trends or bottlenecks—all in real-time, thanks to MySQL integration.
3. 🏷️ Manage Inventory with Real-Time Dashboards
Inventory dips below minimum stock? Trigger alerts.
With Power BI + MySQL:
Track current stock levels
Monitor restocking needs
Visualize inventory turnover
Set up Power BI dashboards that refresh automatically as MySQL updates your stock records.
4. 🛠️ Track Customer Support KPIs
Integrate your helpdesk MySQL tables and watch:
Response times
Ticket resolution rates
SLA compliance metrics
All of this is visualized in Power BI without pulling a single report manually.
5. 📅 Project Management & Timelines
By integrating MySQL with Power BI:
Track project deadlines
Monitor team performance
Visualize tasks at risk of delay
Project managers can act faster using data-driven alerts and Gantt-style dashboards in Power BI.
📅 How to Set Up Real-Time Dashboards in Power BI
Once your integration is live:
Go to Power BI Service
Create a dashboard using your connected MySQL data
Pin visuals and set refresh schedules
Optional: Set up alerts for KPIs
With Konnectify automating your backend sync, your Power BI dashboards are always accurate.
🔒 Is It Secure to Integrate Power BI with MySQL?
Yes if you follow best practices:
Use secure credentials (OAuth or 2FA if possible)
Install the latest ODBC Connector versions
Limit data access to essential users
Monitor logs via Konnectify’s dashboard
Both Power BI and MySQL are enterprise-grade platforms with robust compliance and encryption standards.
✨ Why Konnectify is the Best Tool for Power BI MySQL Integration
Konnectify is more than just a connector. It’s a complete automation platform that lets you:
Connect 150+ apps, including CRMs, email tools, cloud storage, and ERPs
Build visual workflows with drag-and-drop logic
Monitor errors, delays, and sync status
Save hundreds of hours on manual tasks
And yes no coding required.
🧠 FAQs: Power BI MySQL Integration
Q1: Is Power BI compatible with MySQL? ✅ Yes. Power BI supports MySQL through ODBC and native connectors.
Q2: Do I need a premium Power BI account? ❌ No. Power BI Desktop works with MySQL even on the free tier.
Q3: Can I connect multiple MySQL databases? ✅ Yes. Konnectify allows multiple workflows across various databases.
Q4: What if MySQL has sensitive data? 🔐 Use encryption, access control, and filtered queries to secure data.
Q5: Will the integration slow down MySQL? ❌ No. With proper indexing and sync schedules, performance remains stable.
Q6: Is Konnectify safe to use? ✅ Absolutely. It uses encrypted tokens, secure OAuth, and follows GDPR compliance.
🏁 Final Thoughts: It’s Time to Sync Smarter
Gone are the days of juggling spreadsheets, exporting CSVs, or waiting on IT teams to build custom connectors. With Power BI MySQL integration via Konnectify, you unlock:
Real-time analytics
Fully automated dashboards
Insights that move your business forward
Stop manually syncing data—start automating it today.
#it services#saas#saas development company#saas platform#information technology#saas technology#b2b saas#software#software development#ipaas
0 notes
Text
Building Metadata-Driven Pipelines in Azure Data Factory
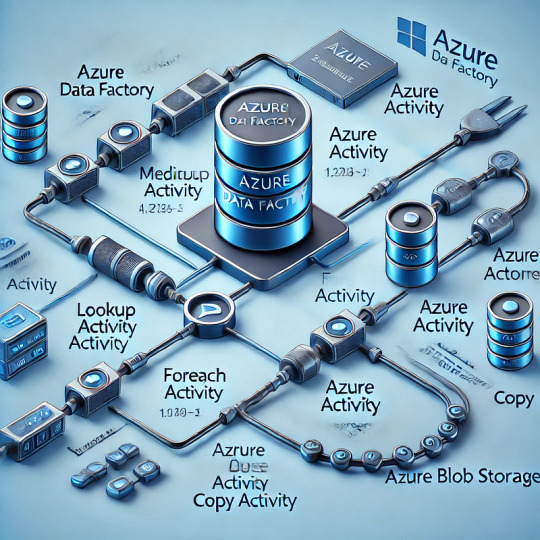
1. Introduction to Metadata-Driven Pipelines
Metadata-driven pipelines in Azure Data Factory (ADF) provide a dynamic and scalable approach to orchestrating data workflows. Instead of hardcoding pipeline configurations, metadata (stored in a database or JSON file) defines:
Source & destination locations
File formats & schemas
Transformation logic
Processing rules
This approach enhances reusability, reduces maintenance efforts, and allows for seamless pipeline modifications without redeploying code.
2. Storing and Managing Metadata
Metadata can be stored in:
Azure SQL Database: Structured metadata for multiple pipelines
Azure Blob Storage (JSON/CSV files): Unstructured metadata for flexible processing
Azure Table Storage: NoSQL metadata storage for key-value pairs
For this blog, we’ll cover two practical examples:
Using a JSON file stored in Azure Blob Storage
Using a metadata table in Azure SQL Database
3. Example 1: JSON-Based Metadata in Azure Blob Storage
Step 1: Define Metadata JSON File
Create a JSON file (metadata.json) in Azure Blob Storage to define source and destination details:json{ "pipelines": [ { "pipeline_name": "CopyDataPipeline", "source": { "type": "AzureBlobStorage", "path": "source-container/raw-data/" }, "destination": { "type": "AzureSQLDatabase", "table": "ProcessedData" }, "file_format": "csv" } ] }
Step 2: Create a Lookup Activity in ADF
Add a Lookup Activity in ADF to read the JSON metadata from Azure Blob Storage.
Configure the Dataset to point to the JSON file.
Enable the First row only option if fetching a single record.
Step 3: Use Metadata in a ForEach Activity
Add a ForEach Activity to iterate over metadata records.
Inside the loop, use a Copy Activity to dynamically move data based on metadata.
Step 4: Configure Dynamic Parameters
In the Copy Activity, set dynamic parameters:
Source Dataset: @activity('Lookup').output.pipelines[0].source.path
Destination Table: @activity('Lookup').output.pipelines[0].destination.table
Now, the pipeline dynamically reads metadata and copies data accordingly.
4. Example 2: SQL-Based Metadata for Pipeline Execution
Step 1: Create Metadata Table in Azure SQL Database
Execute the following SQL script to create a metadata table:sqlCREATE TABLE MetadataPipelineConfig ( ID INT IDENTITY(1,1) PRIMARY KEY, PipelineName NVARCHAR(100), SourceType NVARCHAR(50), SourcePath NVARCHAR(255), DestinationType NVARCHAR(50), DestinationTable NVARCHAR(100), FileFormat NVARCHAR(50) );INSERT INTO MetadataPipelineConfig (PipelineName, SourceType, SourcePath, DestinationType, DestinationTable, FileFormat) VALUES ('CopyDataPipeline', 'AzureBlobStorage', 'source-container/raw-data/', 'AzureSQLDatabase', 'ProcessedData', 'csv');
Step 2: Use a Lookup Activity to Fetch Metadata
Add a Lookup Activity in ADF.
Configure the Source Dataset to point to the MetadataPipelineConfig table.
Fetch all metadata records by disabling the First row only option.
Step 3: Use ForEach Activity and Copy Activity
Add a ForEach Activity to loop over the metadata rows.
Inside the loop, configure a Copy Activity with dynamic expressions:
Source Dataset: @item().SourcePath
Destination Table: @item().DestinationTable
Step 4: Deploy and Run the Pipeline
Once the pipeline is deployed, it dynamically pulls metadata from SQL and executes data movement accordingly.
5. Benefits of Metadata-Driven Pipelines
✅ Flexibility: Modify metadata without changing pipeline logic ✅ Scalability: Handle multiple pipelines with minimal effort ✅ Efficiency: Reduce redundant pipelines and enhance maintainability
6. Conclusion
Metadata-driven pipelines in Azure Data Factory significantly improve the efficiency of data workflows. Whether using JSON files in Azure Blob Storage or structured tables in Azure SQL Database, this approach allows for dynamic and scalable automation.
WEBSITE: https://www.ficusoft.in/azure-data-factory-training-in-chennai/
0 notes
Text
Data import and export in R
R is a versatile tool that can handle a wide range of data sources, making it a go-to language for data analysis and statistical computing. Whether you’re working with CSV files, Excel spreadsheets, or databases, R provides powerful functions and packages to import and export data efficiently. In this section, we’ll explore how to import data from various sources and export your results back into different formats.
Importing Data from CSV Files
CSV (Comma-Separated Values) is one of the most common formats for storing and exchanging data. R has built-in functions to read and write CSV files, making it easy to import data for analysis.
Using read.csv():
The read.csv() function is used to read data from a CSV file into a data frame.# Importing a CSV file data <- read.csv("path/to/your/file.csv") # Display the first few rows of the data head(data)
Customizing the Import:
You can customize how the data is imported by using additional arguments such as header, sep, and stringsAsFactors.# Importing a CSV file with custom settings data <- read.csv("path/to/your/file.csv", header = TRUE, sep = ",", stringsAsFactors = FALSE)
header = TRUE: Indicates that the first row contains column names.
sep = ",": Specifies the separator used in the CSV file.
stringsAsFactors = FALSE: Prevents character strings from being converted into factors.
Importing Data from Excel Files
Excel is another widely used format for storing data, especially in business environments. R provides several packages to read and write Excel files, with readxl and openxlsx being two popular options.
Using readxl Package:
The readxl package allows you to read Excel files without needing to install external dependencies.# Install and load the readxl package install.packages("readxl") library(readxl) # Importing an Excel file data <- read_excel("path/to/your/file.xlsx", sheet = 1) # Display the first few rows of the data head(data)
sheet = 1: Specifies which sheet to read from the Excel file.
Using openxlsx Package:
The openxlsx package offers more flexibility, including writing data back to Excel files.# Install and load the openxlsx package install.packages("openxlsx") library(openxlsx) # Importing an Excel file data <- read.xlsx("path/to/your/file.xlsx", sheet = 1) # Display the first few rows of the data head(data)
Importing Data from Databases
R can also connect to various databases, allowing you to import large datasets directly into R. The DBI package is a standard interface for communication between R and databases, and it works with several backend packages like RMySQL, RPostgreSQL, and RSQLite.
Using DBI and RSQLite:
Here’s an example of how to connect to a SQLite database and import data.# Install and load the DBI and RSQLite packages install.packages("DBI") install.packages("RSQLite") library(DBI) library(RSQLite) # Connect to a SQLite database con <- dbConnect(RSQLite::SQLite(), dbname = "path/to/your/database.sqlite") # Importing a table from the database data <- dbGetQuery(con, "SELECT * FROM your_table_name") # Display the first few rows of the data head(data) # Disconnect from the database dbDisconnect(con)
Connecting to Other Databases:
Similar procedures apply when connecting to MySQL, PostgreSQL, or other databases, with the appropriate backend package (RMySQL, RPostgreSQL, etc.).
Importing Data from Other Sources
R supports data import from various other sources such as: JSON: Using the jsonlite package.
XML: Using the XML or xml2 packages.
Web Data: Using the httr or rvest packages to scrape data from websites.
SPSS, SAS, Stata: Using the haven package to import data from statistical software.
Here’s an example of importing JSON data:# Install and load the jsonlite package install.packages("jsonlite") library(jsonlite) # Importing a JSON file data <- fromJSON("path/to/your/file.json") # Display the first few rows of the data head(data)
Exporting Data from R
Once you’ve processed or analyzed your data in R, you may want to export it for reporting, sharing, or further use.
Exporting to CSV:
The write.csv() function allows you to export data frames to a CSV file.# Exporting data to a CSV file write.csv(data, "path/to/save/your/file.csv", row.names = FALSE)
row.names = FALSE: Prevents row names from being written to the file.
Exporting to Excel:
If you used the openxlsx package, you can also write data frames to Excel files.# Exporting data to an Excel file write.xlsx(data, "path/to/save/your/file.xlsx")
Exporting to Databases:
You can use the dbWriteTable() function from the DBI package to export data back into a database.# Connecting to the database con <- dbConnect(RSQLite::SQLite(), dbname = "path/to/your/database.sqlite") # Writing data to a new table in the database dbWriteTable(con, "new_table_name", data) # Disconnecting from the database dbDisconnect(con)
Best Practices for Data Import and Export
Data Validation: Always inspect the first few rows of your imported data using head() to ensure it has been read correctly.
Customizing Imports: Use the various arguments available in the import functions to handle specific file structures or formatting issues.
Keep a Clean Workspace: After importing and exporting data, clean up your workspace by removing temporary objects or closing database connections to prevent memory issues.
Full details available at https://strategicleap.blogspot.com/
0 notes
Text
Excel Data analysis
Excel Data analysis Data analysis Excel is a powerful tool for data analysis, offering a wide range of features to help you understand and interpret your data. Here are some key aspects of data analysis in Excel: 1. Data Preparation: Data Entry and Import: Excel allows you to manually enter data or import it from various sources like CSV files, databases, and other spreadsheets. Data Cleaning: This involves identifying and correcting errors, inconsistencies, and missing values. Techniques include: Filtering: Isolating specific data based on criteria. Sorting: Arranging data in ascending or descending order. Removing Duplicates: Eliminating redundant data. Text to Columns: Splitting data within a single cell into multiple columns. Data Transformation: This involves modifying data to suit your analysis needs. Techniques include: Formulas and Functions: Using built-in functions like SUM, AVERAGE, IF, and VLOOKUP to perform calculations and manipulate data. PivotTables: Summarizing and analyzing large datasets by grouping and aggregating data. Data Tables: Performing "what-if" analysis by changing input values and observing the impact on results. 2. Data Analysis Techniques: Descriptive Statistics: Calculating summary statistics like mean, median, mode, standard deviation, and percentiles to describe the central tendency and variability of your data. Data Visualization: Creating charts and graphs (e.g., bar charts, line graphs, scatter plots, pie charts) to visually represent data and identify trends, patterns, and outliers. Regression Analysis: Modeling the relationship between variables to make predictions or understand cause-and-effect relationships. Hypothesis Testing: Using statistical tests to determine if there is significant evidence to support a claim or hypothesis about your data. Data Mining: Discovering hidden patterns and relationships within large datasets using techniques like clustering and classification. 3. Tools and Features: Formulas and Functions: A vast library of built-in functions for calculations, data manipulation, and statistical analysis. PivotTables: Powerful tool for summarizing and analyzing large datasets by creating interactive tables. Charts and Graphs: A variety of chart types to visualize data effectively. Conditional Formatting: Applying visual rules to highlight data that meets specific criteria. Data Analysis ToolPak: An add-in that provides advanced statistical and data analysis tools, including regression, ANOVA, and time series analysis. 4. Examples of Data Analysis in Excel: Financial Analysis: Calculating financial ratios, analyzing stock trends, and forecasting future performance. Sales Analysis: Tracking sales trends, identifying top-selling products, and analyzing customer behavior. Market Research: Analyzing survey data, identifying customer preferences, and segmenting markets. Quality Control: Monitoring product quality, identifying defects, and analyzing production processes. Scientific Research: Analyzing experimental data, conducting statistical tests, and generating reports. By effectively utilizing Excel's data analysis features, you can gain valuable insights from your data, make informed decisions, and improve your business or research outcomes. اكسل متقدم via عالم الاوفيس https://ift.tt/k2WmMpl January 01, 2025 at 01:03AM
0 notes
Text
Power BI Training | Power BI Online Training
Power BI Training: What Types of Data Can Power BI Handle?

Power BI Training equips individuals and businesses with the skills to transform raw data into actionable insights. One of the primary reasons Power BI has gained immense popularity in recent years is its unparalleled ability to handle a wide variety of data types. Whether you’re analyzing financial reports, visualizing customer trends, or integrating cloud data sources, Power BI is a versatile tool that supports diverse data formats and systems. With the growing demand for Power BI Online Training, users can now easily master the techniques to utilize its capabilities and integrate data from multiple sources seamlessly.
In this article, we will explore the types of data that Power BI can handle and highlight how the tool empowers users to extract value from various data streams. From relational databases to real-time cloud data, understanding Power BI's compatibility with different data formats is essential for both beginners and advanced users.
Relational Databases: The Foundation of Business Insights
Relational databases are among the most commonly used data sources in businesses. Power BI connects seamlessly with relational databases such as SQL Server, MySQL, Oracle Database, and PostgreSQL. These databases store structured data in tables, making them ideal for generating reports and dashboards. Power BI Training emphasizes leveraging these connections to perform efficient data modeling, create calculated columns, and design measures using DAX (Data Analysis Expressions).
By utilizing Power BI's built-in data connectors, users can import large volumes of structured data without compromising performance. Whether it’s sales data, inventory records, or employee metrics, Power BI empowers users to uncover insights through its interactive dashboards.
Excel and CSV Files: Simplicity Meets Functionality
Power BI is widely known for its compatibility with Excel and CSV files, making it a favourite tool among professionals who work with these formats. Many organizations rely on spreadsheets for budgeting, forecasting, and reporting. Power BI allows users to directly import and transform this data into visually appealing reports.
With Power BI Online Training, users can also learn how to automate the refresh of data from Excel files stored on One Drive or SharePoint. This ensures that reports and dashboards remain up-to-date without manual intervention. Its drag-and-drop interface simplifies the process of merging multiple datasets, enabling users to create comprehensive views of their business operations.
Cloud Data Sources: Real-Time Data at Your Fingertips
As businesses transition to cloud-based platforms, the ability to analyze real-time data has become critical. Power BI supports a wide range of cloud-based data sources, including Azure SQL Database, Google BigQuery, Amazon Redshift, and Salesforce. This capability allows users to connect to live datasets and monitor key performance indicators (KPIs) in real time.
Power BI Training often covers best practices for working with cloud data, including configuring gateways and optimizing queries for faster performance. This is particularly useful for businesses that rely on SaaS (Software as a Service) applications for their day-to-day operations. Real-time analytics in Power BI can drive immediate decision-making, helping businesses stay competitive in dynamic markets.
Unstructured Data: Making Sense of Complexity
While structured data is easy to analyze, unstructured data presents a unique challenge. Unstructured data includes formats like text files, PDFs, social media content, and multimedia files. With the help of tools like Power BI and its integration with Azure Cognitive Services, users can analyze and visualize unstructured data effectively.
For example, sentiment analysis can be performed on customer reviews or social media posts, providing businesses with valuable insights into consumer behaviour. Advanced Power BI Online Training delves into techniques for handling unstructured data, including natural language processing (NLP) and custom visualizations.
Big Data: Harnessing Volume, Variety, and Velocity
In the era of big data, organizations must process large datasets that often come from diverse sources. Power BI integrates seamlessly with big data platforms like Hadoop, Apache Spark, and Azure Data Lake. These integrations enable users to analyze massive datasets without requiring extensive technical expertise.
During Power BI Training, participants learn how to use DirectQuery and import modes to optimize big data workflows. DirectQuery allows users to query large datasets without importing them into Power BI, which is particularly useful for businesses dealing with high-volume data streams. These capabilities make Power BI an essential tool for industries such as finance, healthcare, and retail.
APIs and Custom Data Sources: Flexibility Redefined
Power BI's ability to connect with APIs (Application Programming Interfaces) opens up a world of possibilities for developers and data analysts. APIs allow Power BI to pull data from custom sources, including proprietary systems and third-party applications. By configuring API connections, users can create custom dashboards tailored to their specific needs.
Through Power BI Online Training, users can learn how to set up and manage these custom integrations. This feature is particularly beneficial for organizations that rely on niche software solutions for their operations. With Power BI, even the most complex data sources can be visualized and shared across teams.
IoT Data: Driving Innovation with Real-Time Insights
The Internet of Things (IoT) has revolutionized industries by providing real-time data from sensors, devices, and machines. Power BI supports IoT data integration through Azure IoT Hub, enabling users to monitor equipment performance, track energy consumption, or analyze logistics operations in real time.
Participants in Power BI Training gain hands-on experience in working with IoT data, learning how to build dynamic dashboards that capture and visualize live data streams. These capabilities are critical for industries like manufacturing, transportation, and energy, where timely insights can prevent downtime and improve efficiency.
Conclusion
Power BI's versatility lies in its ability to handle a wide range of data types, from structured and unstructured datasets to real-time IoT and big data sources. By integrating with relational databases, spreadsheets, cloud services, and APIs, Power BI has established itself as a comprehensive tool for data analysis and visualization.
For professionals and organizations looking to harness the full potential of this tool, Power BI Training provides the foundation needed to master its features. Whether you're a beginner or an experienced analyst, Power BI Online Training ensures that you can work efficiently with various data formats and create impactful reports. With Power BI, the possibilities for data-driven decision-making are virtually limitless.
Visualpath is the Leading and Best Institute for learning in Hyderabad. We provide Power BI Course Online. You will get the best course at an affordable cost.
Attend Free Demo
Call on – +91-9989971070
Blog: https://visualpathblogs.com/
What’s App: https://www.whatsapp.com/catalog/919989971070/
Visit: https://www.visualpath.in/powerbi-training.html
#Power BI Training#Power BI Online Training#Power BI Course Online#Power BI Training in Hyderabad#Power BI Training in Ameerpet#Power BI Training Institute in Hyderabad#Power BI Online Training Hyderabad#Power BI Course in Hyderabad
1 note
·
View note
Text

We, at Centizen aim to give the best products and services to our clients. So, when questioned about the best component libraries in the market, we rolled our sleeves for you, and researched the top libraries available. Here is a brief report on the top library files, Angular Material vs PrimeNG.
Angular Material
Angular Material is a UI component library, owned by Google and used by developers. The components are reusable and customizable. Angular official component library implements Google’s Material Design, built with Angular and Typescript. The UI components serve in a descriptive format with their Lines of code as an example. It also facilitates learners and beginners to incorporate individual components from this Bit Scope.

A peak of Angular Material UI Components

Descriptive Code for the Components
PrimeNG
PrimeNG is a comprehensive component suite that includes over 70+ UI components and is popular among organizations such as eBay, FOX etc., However with the available number of components, it still does not allow developers to customize. Similar to material, Prime NG provides you with templates and code below them.


When to use Angular Material?
When focused on performance over themes & styles.
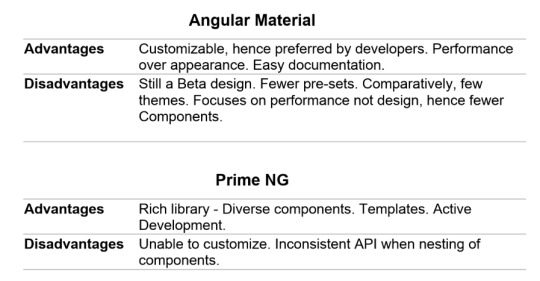
Advantages
Effective documentation provides clarity for components and their respective codes.
Widely effective because of its ability to customize the pre-available designs as per our needs.
Disadvantages
Still a Beta version meaning under constant enhancement and experimentation can put a strain on a long-term project.
Comparatively fewer controls/components as compared to Prime NG.
The themes available are one quarter in comparison to Prime NG.
Caution: Using more than one library (from both Angular & Prime NG) simultaneously, complicates the code.
When to use PrimeNG?
When designs and appearance mean more to your project.
Advantages
From the diverse options available, adding a series of libraries for different UI requirements can be avoided and thus comparatively less complicated code.
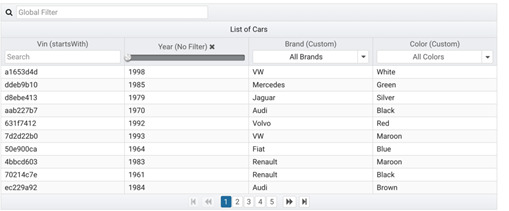
e.g. Options for a Date Table
Sorting, filtering, lazy loading, in addition offers column toggles, column reordering, in-cell editing, expandable rows, row and column grouping, CSV Export, etc.
The Components are provided with a decent number of events and properties with a certain level of customization.
Disadvantages
Inconsistent API — the features present in one component, but completely absent on another.
Not beginner-friendly. As most customizations do not come with the package. Well, versed experts can include basic elements inside the source code.
No proper explanation/documentation about the available components.
Things to consider before you choose Angular Material vs PrimeNG !
Whenever we use a similar package, we indirectly use angular material as a base. The same goes for all software built on Angular material.
Summary
For custom software development at Centizen we researched about Angular Material vs PrimeNG over a notable period of time. However even after almost a year and a half, Angular Material manages to hover PrimeNG. The main reason would be that Angular lets people customize with basic elements added with the clear information of what it does and what can be expected whereas PrimeNG is abstract about it which makes it difficult for beginners.
0 notes
Text
Common XML Conversion Challenges and How to Overcome Them

One famous layout for storing and sharing records is XML (eXtensible Markup Language), that is widely used for its potential to maintain established facts in a bendy manner. However, converting records to or from XML can be tough, particularly when you have to ensure that the conversion is accurate and prefer minded with other structures.
1. Data Integrity Issues
When converting records to XML or from XML to different formats, one of the maximum not unusual challenges is ensuring the integrity of the records. If records is lost or corrupted during the conversion manner, it may result in incomplete or faulty information. This should bring about errors, lacking information, or misaligned records whilst the record is opened in a special machine.
How to Overcome It:
To avoid facts integrity problems, continually validate your XML documents before and after conversion. Use XML schema validation equipment to make sure that the records comply with the suitable structure and layout. Make positive that each one required factors are gift and correctly located within the XML document.
Additionally, it’s crucial to check the conversion process on a small subset of data earlier than changing the whole report. This let you become aware of capacity issues early on, saving you effort and time in the end.

2. Inconsistent Data Formatting
XML is a versatile layout, which means that there may be a whole lot of variation in how statistics is represented. For instance, one XML report would possibly use a specific date format, or more than a few might be formatted otherwise. If you are converting records from XML to any other format, these inconsistencies can purpose issues when the information is transferred to a brand new device, ensuing in mistakes or incorrect statistics.
How to Overcome It:
Standardize the format of the records earlier than conversion. This can be done by way of ensuring that all XML documents follow a consistent schema or fashion guide. If you’re converting from XML to a special layout, including CSV or JSON, make sure that the conversion device can take care of distinct records sorts effectively.
Also, test if the machine you are changing the XML records to has precise formatting requirements. For example, in case you're changing XML to a database, make sure the database helps the information kinds you're using (like dates or numbers) and that the conversion technique adheres to the ones specifications.
3. Nested Structures and Complex Hierarchies
XML permits you to store data in complex, nested systems, which can once in a while make conversion difficult. For example, a single XML record may comprise a couple of nested factors, making it difficult to map that shape right into a less complicated layout inclusive of CSV, which doesn’t aid hierarchical records.
How to Overcome It:
To manage complicated hierarchies, you may use specialized conversion tools which are designed to deal with nested XML structures. This equipment can flatten the hierarchy, creating separate tables or files for unique stages of information. If you're manually coping with the conversion, try to simplify the XML structure with the aid of breaking it down into smaller, extra plausible portions.
Another solution is to apply a mapping technique, in which the XML form is mapped to the target format based totally on predefined pointers. This way, nested facts can be treated in a manner that guarantees it remains correct whilst transferred to the today's tool.
4. Character Encoding Problems
Character encoding is any other not unusual issue when converting XML files. XML files can incorporate special characters (including accented letters, symbols, or non-Latin characters) that might not be well suited with the machine you’re changing the information to. If the encoding isn’t handled efficiently, it is able to lead to unreadable or corrupted facts.
How to Overcome It:
Ensure that the XML file uses a broadly customary character encoding wellknown consisting of UTF-eight or UTF-16, which helps a wide variety of characters. When converting XML to any other layout, double-test that the man or woman encoding settings suit between the supply and target documents.
Most modern-day conversion equipment routinely come across and keep man or woman encoding, however it’s constantly a terrific concept to check the encoding settings and perform a little testing to make sure the whole lot is working as anticipated.
5. Data Loss During Conversion
When changing from XML to some other format, there’s a danger that some of the facts can be misplaced or now not translated properly. For example, sure records factors in XML won't have an immediate equivalent inside the goal format, that could result in lack of data. This trouble is especially not unusual whilst changing to simpler codecs like CSV, which can't absolutely seize the complexity of an XML report.
How to Overcome It:
To save you information loss, carefully verify the goal layout and make certain that it can handle all of the facts types and structures in the XML report. If you’re changing XML to a database, as an instance, make certain that the database schema can help all of the elements and attributes inside the XML report.
Before beginning the conversion, find out any records factors that won't be supported in the target layout and create a plan for how to address the ones elements. This may additionally contain omitting non-essential records or restructuring the statistics to inform the modern-day format.

6. Lack of Proper Conversion Tools
Finding the right tools for XML conversion may be a mission. Much free or low-price gear might not provide the flexibility or accuracy required for complicated conversions. Additionally, some equipment might not guide the cutting-edge XML capabilities, together with XML namespaces, that could cause incomplete or incorrect conversion.
How to Overcome It:
Choose reliable and specialized XML conversion equipment that offer the capabilities you want. Popular equipment like Altova MapForce, Oxygen XML, and special XML conversion software provide a large style of features, inclusive of help for superior XML systems and multiple output codecs.
If you're working with a big extent of information, keep in mind making an investment in a paid answer, because it will generally offer greater comprehensive support and capabilities. Additionally, ensure that the device you choose can cope with the unique XML schema and structure you’re running with.
7. Limited Support for XML Schema
XML documents may be defined the usage of XML Schema, which allows put in force policies approximately how the information ought to be dependent. However, now not all conversion gear fully supports XML schemas, which can lead to problems when converting XML data that is based on strict schema rules.
How to Overcome It:
If your XML files are tested the usage of a schema, make sure the conversion tool you’re using can handle XML schemas well. Some superior conversion gear provide integrated help for XML Schema, allowing you to transform information while keeping the integrity of the schema.
If your preferred tool does no longer help XML schemas, you may need to manually map the XML information to the desired layout, making sure that the schema’s policies are reputable at some stage in the conversion system.
Conclusion
XML conversion can be a complex technique, especially when managing huge or complex facts sets. However, through know-how the common challenges—inclusive of facts integrity troubles, inconsistent formatting, nested systems, encoding troubles, information loss, and tool obstacles—you could take proactive steps to triumph over them.
By the usage of the right equipment, validating your records, standardizing formats, and ensuring right mapping, you could efficaciously convert XML documents without losing crucial facts or growing errors. Whether you’re converting information for inner use, integration with 1/three-birthday celebration systems, or sharing statistics with stakeholders, overcoming XML conversion demanding situations will help ensure that your records stays correct, usable, and handy for the duration of unique structures.
0 notes
Text
Testing a Potential Moderator
Research: Testing for a Potential Mediator Using ANOVA
Introduction: Testing for a potential mediator is a statistical method used to examine if a third variable (mediator) affects the relationship between two other variables. This mediator can contribute to understanding the mechanism by which the independent variable influences the dependent variable. By identifying the mediator, researchers can gain deeper insights into the causal processes underlying the relationship.
In this study, we will use Analysis of Variance (ANOVA) to test for the potential mediating effect of physical activity on the relationship between treatment type and disease outcome.
1. Objectives:
Research Objective: Analyze the relationship between treatment type (independent variable) and disease outcome (dependent variable) using ANOVA, and test for physical activity as a mediator.
Research Questions:
Does physical activity affect the relationship between treatment type and disease outcome?
Can physical activity be considered a mediator in this relationship?
2. Variables:
Independent Variable: Treatment type (e.g., medication treatment vs. physical therapy treatment).
Dependent Variable: Disease outcome (e.g., improvement in health).
Mediator Variable: Physical activity level.
3. Hypotheses:
Null Hypothesis (H0): There is no effect of physical activity on the relationship between treatment type and disease outcome.
Alternative Hypothesis (H1): There is an effect of physical activity on the relationship between treatment type and disease outcome.
4. Methodology:
In this study, we will use ANOVA to test whether physical activity mediates the relationship between treatment type and disease outcome.
Steps for Analysis:
Data Collection: The dataset contains information on treatment type, physical activity level, and disease outcome. The data will be in a table format with the following columns:
Outcome: Disease outcome (degree of improvement or deterioration).
Treatment: Treatment type (e.g., medication, physical therapy).
PhysicalActivity: Physical activity level (e.g., low, moderate, high).
Statistical Analysis: We will use ANOVA to test for the interaction between Treatment and PhysicalActivity on the Outcome.
Hypothesis Testing: Using statistical values such as F-statistic and p-value, we will determine whether the interaction is statistically significant.
5. Software Tools Used:
We will use Python programming language and its statistical libraries for data analysis, particularly:
pandas for data manipulation.
statsmodels for performing ANOVA.
6. Implementing ANOVA in Python:
Code Example:

Explanation of the Code:
First, we load the data from a CSV file using pandas.
Then, we use the ols() function from the statsmodels library to create an ANOVA model that includes the interaction between Treatment and PhysicalActivity on Outcome.
Finally, we use sm.stats.anova_lm() to compute the results of the ANOVA and display the output in a table.
7. Results:
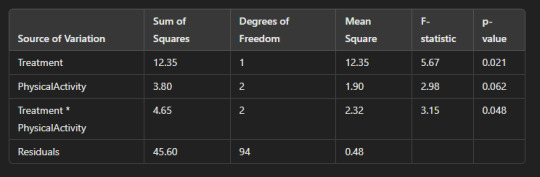
After performing the analysis, we will obtain an ANOVA table with the following components:
Sum of Squares: This shows the variance explained by each factor (Treatment, PhysicalActivity, and their interaction).
Mean Square: This is calculated by dividing the Sum of Squares by the degrees of freedom (Degrees of Freedom).
F-statistic: This measures how much the factors influence the outcome.
p-value: The p-value indicates whether the interaction is statistically significant.
Assuming the results are as follows (for illustrative purposes):
8. Interpretation:
Interaction between Treatment and Physical Activity: Since the p-value for the interaction term (Treatment * PhysicalActivity) is 0.048 (less than 0.05), we reject the null hypothesis and conclude that there is a statistically significant interaction between treatment type and physical activity affecting the disease outcome.
Effect of Physical Activity: The p-value for physical activity alone is 0.062, which is greater than 0.05, indicating that physical activity alone does not have a statistically significant effect on the disease outcome in this case.
Effect of Treatment: The p-value for treatment is 0.021, which is less than 0.05, indicating that treatment type has a statistically significant effect on the disease outcome.
9. Conclusion:
From the results of the ANOVA analysis, we conclude that physical activity acts as a mediator between treatment type and disease outcome. The interaction between treatment and physical activity was statistically significant, suggesting that physical activity influences the way treatment affects the disease outcome.
10. Future Recommendations:
Larger sample size: Using a larger sample could provide more accurate and reliable results.
Comparative studies: Comparing the effects of other factors on treatment and outcome could help provide a more comprehensive understanding.
Testing other mediators: Exploring other potential mediators, such as nutrition or psychological factors, might reveal additional insights into the treatment-outcome relationship.
Conclusion:
Using ANOVA to test for potential mediators provides an effective means of understanding the relationship between variables and how mediating factors influence these relationships. In this research, we found that physical activity acts as a mediator between treatment type and disease outcome, opening avenues for further studies that could apply these findings to improve healthcare treatments.
0 notes
Text
How to Read and Write Data in PySpark
The Python application programming interface known as PySpark serves as the front end for Apache Spark execution of big data operations. The most crucial skill required for PySpark work involves accessing and writing data from sources which include CSV, JSON and Parquet files.
In this blog, you’ll learn how to:
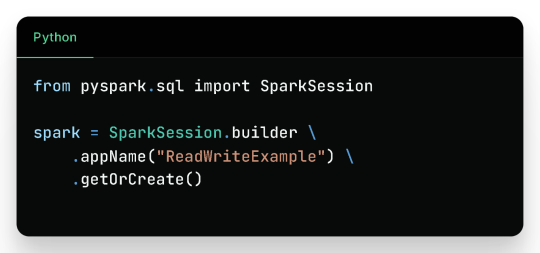
Initialize a Spark session
Read data from various formats
Write data to different formats
See expected outputs for each operation
Let’s dive in step-by-step.
Getting Started
Before reading or writing, start by initializing a SparkSession.
Reading Data in PySpark
1. Reading CSV Files

Sample CSV Data (sample.csv):

Output:

2. Reading JSON Files
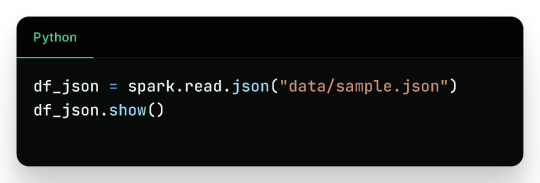
Sample JSON (sample.json):

Output:

3. Reading Parquet Files
Parquet is optimized for performance and often used in big data pipelines.

Assuming the parquet file has similar content:
Output:
4. Reading from a Database (JDBC)

Sample Table employees in MySQL:

Output:

Writing Data in PySpark
1. Writing to CSV

Output Files (folder output/employees_csv/):

Sample content:

2. Writing to JSON

Sample JSON output (employees_json/part-*.json):

3. Writing to Parquet

Output:
Binary Parquet files saved inside output/employees_parquet/
You can verify the contents by reading it again:

4. Writing to a Database
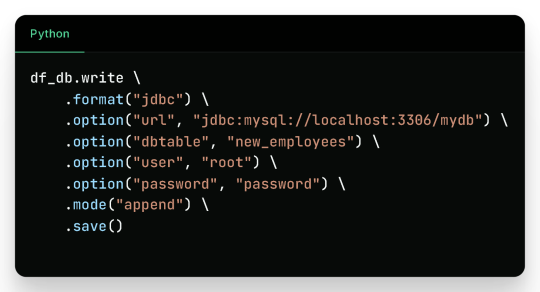
Check the new_employees table in your database — it should now include all the records.
Write Modes in PySpark
Mode
Description
overwrite
Overwrites existing data
append
Appends to existing data
ignore
Ignores if the output already exists
error
(default) Fails if data exists
Real-Life Use Case
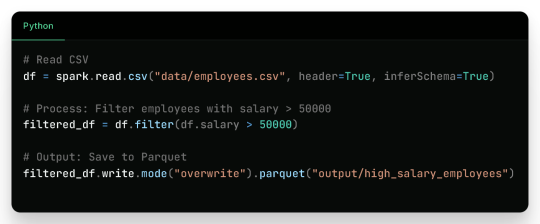
Filtered Output:
Wrap-Up
Reading and writing data in PySpark is efficient, scalable, and easy once you understand the syntax and options. This blog covered:
Reading from CSV, JSON, Parquet, and JDBC
Writing to CSV, JSON, Parquet, and back to Databases
Example outputs for every format
Best practices for production use
Keep experimenting and building real-world data pipelines — and you’ll be a PySpark pro in no time!
🚀Enroll Now: https://www.accentfuture.com/enquiry-form/
📞Call Us: +91-9640001789
📧Email Us: [email protected]
🌍Visit Us: AccentFuture
#apache pyspark training#best pyspark course#best pyspark training#pyspark course online#pyspark online classes#pyspark training#pyspark training online
0 notes
Text
Python Fundamentals for New Coders: Everything You Need to Know
Learning Python is an exciting journey, especially for new coders who want to explore the fundamentals of programming. Known for its simplicity and readability, Python is an ideal language for beginners and professionals alike. From understanding basic syntax to mastering more advanced concepts, Python equips you with tools to build everything from small scripts to full-scale applications. In this article, we’ll explore some core Python skills every new coder should know, such as file handling, reading and writing files, and handling data in various formats.
One essential skill in Python is file handling, which is vital for working with external data sources. Our Python file handling tutorial covers how to open, read, write, and close files. In real-world applications, you often need to process data stored in files, whether for analysis or to store program output. File handling enables you to manage these files directly from your Python code. With just a few commands, you can open a file, modify its contents, or create a new file. This skill becomes especially valuable as you begin working with larger projects that rely on reading or writing to files.
Once you understand file handling basics, you can dive deeper into how Python works with different types of files. One common use case for file handling is working with CSV files, which store data in a table-like format. Python CSV file handling allows you to read and write data organized in rows and columns, making it easy to process structured data. With Python’s built-in csv module, you can access and manipulate CSV files effortlessly. For example, if you have a list of students and their grades in a CSV file, you can use Python to calculate average grades or filter data. Understanding how to handle CSV files helps you manage structured data effectively and is a critical skill for any data-related task.
Moving on, another key skill is working with file content—specifically, learning to read and write files in various formats. Python offers a variety of methods for reading files line-by-line or loading the entire content at once. Writing to files is just as simple, allowing you to add new data or update existing information. For instance, in a data analysis project, you might read raw data from a file, process it, and save the results to another file. This read-and-write capability forms the backbone of many Python programs, particularly when dealing with external data.
Finally, many applications require more complex data storage and exchange formats, such as JSON. Python JSON data processing is essential for working with APIs or handling nested data structures. JSON, which stands for JavaScript Object Notation, is a popular format for representing structured data. Using Python’s json module, you can easily convert JSON data into Python dictionaries and vice versa. This ability to parse and write JSON data is crucial for building applications that interact with web services, allowing you to read data from an online source and process it in your program. As you gain more experience, you’ll find JSON data handling indispensable for projects involving external APIs and structured data storage.
Our company is committed to helping students learn programming languages through clear, straightforward tutorials. Our free online e-learning portal provides Python tutorials specifically designed for beginners, with live examples that bring each concept to life. Every tutorial is written in an easy-to-understand style, ensuring that even complex topics are approachable. Whether you’re a student or a hobbyist, our tutorials give you the practical tools to start coding confidently.
In summary, understanding Python fundamentals such as file handling, CSV and JSON processing, and read/write operations can take you far in your coding journey. Each of these skills contributes to building powerful applications, from data analysis scripts to interactive web applications. By mastering these concepts, you’ll be well-prepared to tackle real-world coding challenges, and our platform will support you every step of the way. With consistent practice and our structured tutorials, you’ll gain the confidence to explore Python and bring your ideas to life.
0 notes
Text
How to Connect MySQL to Power BI (Without Writing a Single Line of Code!)
Data is a big deal. No, scratch that data is everything when it comes to making smart business moves. And that’s exactly why 80% of companies are investing heavily in data analytics.
If you’re still stuck manually exporting and importing data between MySQL and Power BI, you’re wasting valuable time. The good news? You can automate the entire process and get real-time insights without writing a single line of code. Sounds amazing, right?
This guide will walk you through how to integrate MySQL with Power BI, automate data syncs, and level up your analytics game effortlessly.

Why Should You Connect Power BI with MySQL?
Before we jump into the steps, let’s break down why this integration is a game-changer.
Power BI & MySQL: A Perfect Match
🔹 Power BI → A top-tier data visualization tool that helps you create stunning dashboards and reports.
🔹 MySQL → One of the most widely used open-source databases, perfect for handling massive amounts of structured data.
When you connect MySQL to Power BI, you get the best of both worlds—rock-solid data storage with real-time, interactive visualizations. Imagine not having to manually refresh reports or pull CSV files every time your data updates.
The best part? Thanks to SaaS integration platforms like Konnectify, you don’t need a developer to make it happen.
💡 Fact: Automating data syncs can save up to 50% of the time spent on manual reporting.
How to Connect MySQL to Power BI (Step-by-Step Guide)
What You’ll Need
✔️ A Power BI account ✔️ A MySQL database ✔️ MySQL ODBC Connector (This acts as the bridge between MySQL and Power BI) ✔️ A Konnectify account to automate the integration
Step 1: Install MySQL ODBC Connector
1️⃣ Head over to the MySQL official website and download MySQL Workbench if you don’t have it. 2️⃣ Install the MySQL ODBC Connector this is what allows Power BI to talk to MySQL.
Step 2: Connect MySQL Database to Power BI
1️⃣ Open Power BI Desktop 2️⃣ Click on Get Data → MySQL Database 3️⃣ Enter your server details and credentials 4️⃣ Click Connect to pull in your MySQL tables
🚀 Boom! Your data is now inside Power BI. But let’s take it a step further—let’s automate the entire process so you never have to manually refresh again.
Automate MySQL Data Sync with Power BI Using SaaS Integration
Here’s where Konnectify makes life ridiculously easy.
Instead of manually updating reports, Konnectify automates everything with zero coding.
How to Set Up Konnectify for MySQL → Power BI Automation
1️⃣ Log into Konnectify 2️⃣ Select MySQL from the app marketplace 3️⃣ Set up a trigger like “New data entry in MySQL” 4️⃣ Choose an action like “Create row in Power BI” so your reports update automatically 5️⃣ Customize your workflow with Konnectify’s drag-and-drop builder and hit Activate
And that’s it! Your Power BI dashboard now updates in real-time whenever MySQL gets new data. 🎉
💡 Real-World Example: A finance team using MySQL to store transactions can automatically generate financial reports in Power BI without touching a spreadsheet.
🔗 Want a more detailed walkthrough? Check out this step-by-step guide from the Konnectify blog.
5 Game-Changing Use Cases for Power BI + MySQL Integration
Still wondering why this setup is worth it? Here’s how real businesses are using it:
1. Automate Financial Reports 💰
Sync MySQL’s financial data with Power BI to auto-generate revenue dashboards and track expenses in real-time.
✅ Fact: Real-time analytics can boost operational efficiency by 20%.
2. Analyze Sales Data 📊
Use Power BI to visualize sales trends, customer acquisition costs, and churn rates straight from MySQL.
3. Manage Inventory in Real-Time 📦
No more stockouts! Set up dashboards to track inventory levels and trigger alerts when stock is low.
4. Monitor Customer Support Performance 🎧
Track response times, ticket volume, and resolution rates with live MySQL data in Power BI.
5. Improve Project Management 🚀
Connect Power BI and MySQL to track deadlines, workloads, and team performance all automated!
Frequently Asked Questions (FAQs)
1. Can I Connect Power BI to MySQL Without Coding?
Yes! With SaaS integration via Konnectify, you can set up MySQL-Power BI sync without writing a single line of code.
2. How Can I Get Real-Time Updates in Power BI from MySQL?
Automate it using Konnectify. Any updates in MySQL will instantly reflect in Power BI dashboards no manual refresh needed.
3. Why Use Konnectify for MySQL + Power BI?
No coding needed—anyone can use it
Automates reporting so you don’t have to
Works with 150+ apps, making it the best SaaS integration tool for automation
Final Thoughts
Let’s be real—manual data exports are a waste of time. If you want real-time Power BI dashboards, integrating MySQL is a must. And with SaaS integration tools like Konnectify, you can set up automated syncs in minutes—no coding required.
🔗 Want to see how it works? Check out the full guide here: How to Connect Power BI to MySQL Database.
Now go automate your analytics and thank yourself later! 🚀
#it services#saas development company#saas platform#saas#saas technology#software#b2b saas#information technology#software development#ipaas
0 notes
Text
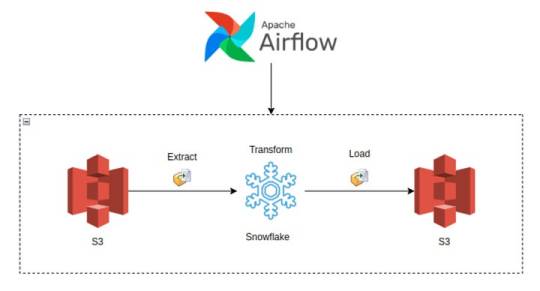
Building Data Pipelines with Snowflake and Apache Airflow

1. Introduction to Snowflake
Snowflake is a cloud-native data platform designed for scalability and ease of use, providing data warehousing, data lakes, and data sharing capabilities. Unlike traditional databases, Snowflake’s architecture separates compute, storage, and services, making it highly scalable and cost-effective. Some key features to highlight:
Zero-Copy Cloning: Allows you to clone data without duplicating it, making testing and experimentation more cost-effective.
Multi-Cloud Support: Snowflake works across major cloud providers like AWS, Azure, and Google Cloud, offering flexibility in deployment.
Semi-Structured Data Handling: Snowflake can handle JSON, Parquet, XML, and other formats natively, making it versatile for various data types.
Automatic Scaling: Automatically scales compute resources based on workload demands without manual intervention, optimizing cost.
2. Introduction to Apache Airflow
Apache Airflow is an open-source platform used for orchestrating complex workflows and data pipelines. It’s widely used for batch processing and ETL (Extract, Transform, Load) tasks. You can define workflows as Directed Acyclic Graphs (DAGs), making it easy to manage dependencies and scheduling. Some of its features include:
Dynamic Pipeline Generation: You can write Python code to dynamically generate and execute tasks, making workflows highly customizable.
Scheduler and Executor: Airflow includes a scheduler to trigger tasks at specified intervals, and different types of executors (e.g., Celery, Kubernetes) help manage task execution in distributed environments.
Airflow UI: The intuitive web-based interface lets you monitor pipeline execution, visualize DAGs, and track task progress.
3. Snowflake and Airflow Integration
The integration of Snowflake with Apache Airflow is typically achieved using the SnowflakeOperator, a task operator that enables interaction between Airflow and Snowflake. Airflow can trigger SQL queries, execute stored procedures, and manage Snowflake tasks as part of your DAGs.
SnowflakeOperator: This operator allows you to run SQL queries in Snowflake, which is useful for performing actions like data loading, transformation, or even calling Snowflake procedures.
Connecting Airflow to Snowflake: To set this up, you need to configure a Snowflake connection within Airflow. Typically, this includes adding credentials (username, password, account, warehouse, and database) in Airflow’s connection settings.
Example code for setting up the Snowflake connection and executing a query:pythonfrom airflow.providers.snowflake.operators.snowflake import SnowflakeOperator from airflow import DAG from datetime import datetimedefault_args = { 'owner': 'airflow', 'start_date': datetime(2025, 2, 17), }with DAG('snowflake_pipeline', default_args=default_args, schedule_interval=None) as dag: run_query = SnowflakeOperator( task_id='run_snowflake_query', sql="SELECT * FROM my_table;", snowflake_conn_id='snowflake_default', # The connection ID in Airflow warehouse='MY_WAREHOUSE', database='MY_DATABASE', schema='MY_SCHEMA' )
4. Building a Simple Data Pipeline
Here, you could provide a practical example of an ETL pipeline. For instance, let’s create a pipeline that:
Extracts data from a source (e.g., a CSV file in an S3 bucket),
Loads the data into a Snowflake staging table,
Performs transformations (e.g., cleaning or aggregating data),
Loads the transformed data into a production table.
Example DAG structure:pythonfrom airflow.providers.snowflake.operators.snowflake import SnowflakeOperator from airflow.providers.amazon.aws.transfers.s3_to_snowflake import S3ToSnowflakeOperator from airflow import DAG from datetime import datetimewith DAG('etl_pipeline', start_date=datetime(2025, 2, 17), schedule_interval='@daily') as dag: # Extract data from S3 to Snowflake staging table extract_task = S3ToSnowflakeOperator( task_id='extract_from_s3', schema='MY_SCHEMA', table='staging_table', s3_keys=['s3://my-bucket/my-file.csv'], snowflake_conn_id='snowflake_default' ) # Load data into Snowflake and run transformation transform_task = SnowflakeOperator( task_id='transform_data', sql='''INSERT INTO production_table SELECT * FROM staging_table WHERE conditions;''', snowflake_conn_id='snowflake_default' ) extract_task >> transform_task # Define task dependencies
5. Error Handling and Monitoring
Airflow provides several mechanisms for error handling:
Retries: You can set the retries argument in tasks to automatically retry failed tasks a specified number of times.
Notifications: You can use the email_on_failure or custom callback functions to notify the team when something goes wrong.
Airflow UI: Monitoring is easy with the UI, where you can view logs, task statuses, and task retries.
Example of setting retries and notifications:pythonwith DAG('data_pipeline_with_error_handling', start_date=datetime(2025, 2, 17)) as dag: task = SnowflakeOperator( task_id='load_data_to_snowflake', sql="SELECT * FROM my_table;", snowflake_conn_id='snowflake_default', retries=3, email_on_failure=True, on_failure_callback=my_failure_callback # Custom failure function )
6. Scaling and Optimization
Snowflake’s Automatic Scaling: Snowflake can automatically scale compute resources based on the workload. This ensures that data pipelines can handle varying loads efficiently.
Parallel Execution in Airflow: You can split your tasks into multiple parallel branches to improve throughput. The task_concurrency argument in Airflow helps manage this.
Task Dependencies: By optimizing task dependencies and using Airflow’s ability to run tasks in parallel, you can reduce the overall runtime of your pipelines.
Resource Management: Snowflake supports automatic suspension and resumption of compute resources, which helps keep costs low when there is no processing required.1. Introduction to Snowflake
0 notes
Text
Data is everywhere! Consider any industry, be it healthcare, finance, or education; there is a lot of information to be stored. Storing data can be done efficiently in the cloud using data storage services like Azure Blob store, Azure SQL Database, etc., or you can prefer keeping it on-premises. Whatever may be the case, a considerable amount of unstructured data is stored every day. Also, some enterprises will ingest data across both cloud & on-premises where there might be a need to combine data from both these sources to perform better analytics. What is Azure Data Factory? In the above situations, it becomes more important to transform and move data across different datastores, and this is when Azure Data Factory comes into play! Data Factory is a cloud-based ETL (Extract-Transform-load) and data integration service that allows you to automate data movement between various data stores and perform data transforming by creating pipelines. Where can I use it? Data Factory helps in the same way as any other traditional ETL tool, which helps extract raw data from one/multiple sources to transform & load them to any destination like a Data warehouse. But Data Factory differs from other ETL tools by performing these tasks without any code to be written. Now, don’t you agree that it is a solution that can perfectly fit in if you are looking to transform all your unstructured data into a structured one? Before getting into the concepts, here is a quick recap of Data Factory’s history The version we are using has improved and developed in numerous ways compared to the first version made generally available in 2015. Back then, you have to build a workflow only in Visual Studio. But the version 2 (public preview in 2017) was released to overshadow all the challenges in v1. With Data Factory v2, build code-free ETL processes where you can also leverage 90+ built-in connectors to acquire data from any data store of your choice. Top-level Concepts Now imagine, if you are moving a CSV file from a Blob Storage to a customer table in SQL database, then all the below-mentioned concepts will get involved, Here are the six essential components that you must know, Pipeline A pipeline is a logical grouping of activities that performs a unit of work. For example, a pipeline performs a series of tasks like ingesting data from Blob Storage, transforming it into meaningful data, and then writing it into the SQL Database. It involves mapping the activities in a sequential. So, you can automate the ETL process by creating any number of pipelines for a particular Data Factory. Activities These are the actions that get performed on the data in a pipeline. It includes three activities – Data Movement (Copy), Data transformation & control flow activities. But copying & transforming are the two core activities of Azure Data Factory. So here, copy data activity will get the CSV file from a Blob and loads it into the database, during which you can also convert the file formats. And transformation is mainly done with the help of a capability called Data Flows, which allows developing data transformation logic without using code. Datasets The datasets show what kind of data you are pulling from the data stores. So, it simply points to the data used in the activity as an input or output. Linked Services Linked Services helps to connect other resources with Data Factory, acting like connection strings. When considering the above example, Linked Service will serve as a definition of connectivity to the Blob storage & performs authorization. Similarly, the target (SQL Database) will also have a separate Linked Service. Triggers Triggers are to execute your pipelines without any manual intervention (i.e.,) it determines when a pipeline should get completed. There are three essential triggers in Data Factory, Schedule Trigger: A trigger that invokes a pipeline on a set schedule. You can specify both the date and time on which the trigger should initiate the pipeline run.
Tumbling Window Trigger: A trigger that operates on a periodic interval. Event-based Trigger: This trigger executes whenever an event occurs. For instance, when a file is uploaded or deleted in Blob Storage, the trigger will respond to that event. The triggers and pipelines will have a many-to-many relationship where multiple Triggers can kick off a single pipeline, or a single Trigger can also kick off various pipelines. But as an exception, Tumbling Window Triggers alone will have one-to-many relation with the pipelines. Integration Runtime Integration Runtime is the compute infrastructure used by the Data Factory to provide the following data integration capabilities (Data Flow, Data Movement, Activity dispatch, and SSIS package execution) across different networks. It has three types: Azure integration runtime: This is preferred when you want to copy and transform data between data stores in the cloud. Self-hosted integration runtime: Utilize this when you want to execute using On-premises data stores. Azure-SSIS integration runtime: It helps to execute SSIS packages through Data Factory. I hope that you have understood what a Data Factory is and how it works. We are now moving into its monitoring and managing aspects. Monitoring Azure Data Factory The Azure Monitor supports monitoring your pipeline runs, trigger runs, integration runtimes, and other various metrics. It has an interactive Dashboard where you will view the statistics of all the runs involved in your Data Factory. In addition, you get to create alerts on the metrics to get notified whenever something goes wrong in the Data Factory. Azure Monitor does offer all the necessities for monitoring and alerting, but the real-time business demands much more than that! Also, with the Azure Portal, it becomes difficult to manage when there are Data Factories with different pipelines, data sources across various Subscriptions, Regions, and Tenants. So, here is a third-party tool, Serverless360 that can help your operations and support team manage and monitor the Data Factory much more efficiently. Capabilities of Serverless360 Serverless360 will serve as a complete support tool for managing and monitoring your Azure resources. It helps to achieve application-level grouping and extensive monitoring features that are not available in the Azure portal. A glimpse of what Serverless360 can offer: An interactive and vivid dashboard for visualizing complex data metrics. Group all the siloed Azure resources using business application feature to achieve application-level monitoring. Get one consolidated monitoring report to know the status of all your Azure resources. Monitor the health status and get a report at regular intervals, say every 2 hours. Configure Threshold monitoring rules and get alerted whenever your resource is not in the expected state, and it can automatically correct it and bring it back to the active state. Monitor the resources on various metrics like canceled activity runs, failed pipeline runs, succeeded trigger runs, etc., without any additional cost. Conclusion In this blog, I gave an overview of one of the essential ETL Tools (Azure Data Factory) and its core features that you should be aware of if you plan to use it for your business. Along with that, I have also mentioned a third-party Azure support tool capable of reducing the pressure in managing and monitoring your resources. I hope you had a great time reading this article!
0 notes